
Key Insights
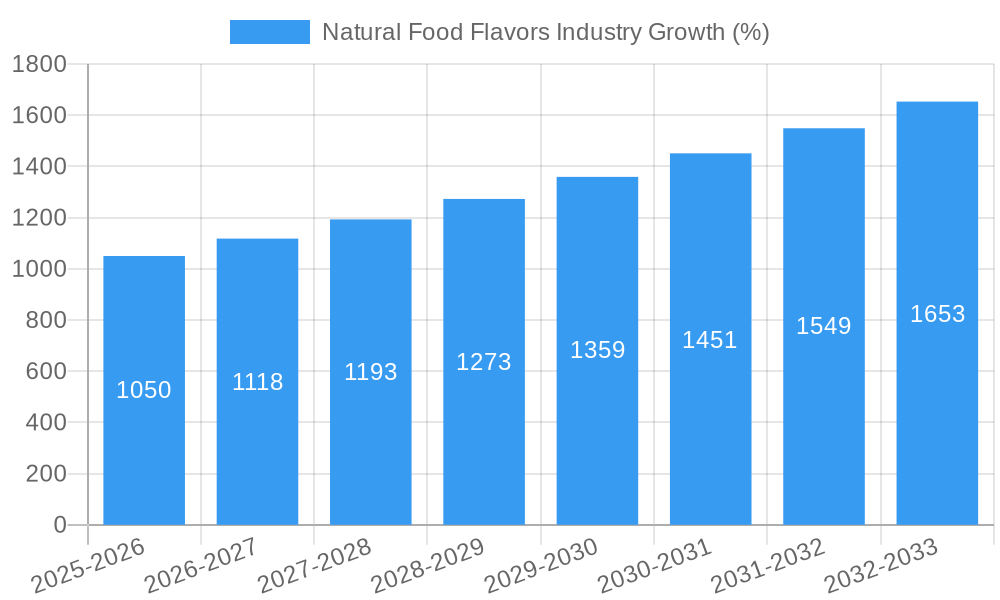
The global natural food flavors market is experiencing robust growth, projected to reach a significant value by 2033. A Compound Annual Growth Rate (CAGR) of 6.75% from 2025 to 2033 indicates a consistently expanding market driven by several key factors. The increasing consumer demand for clean-label products, free from artificial additives and preservatives, is a primary driver. Health-conscious consumers are actively seeking natural alternatives, fueling the growth of this segment. Furthermore, the rising popularity of functional foods and beverages, enriched with added health benefits, is boosting demand for natural flavors that enhance both taste and nutritional profile. The diverse applications across various food and beverage categories, including bakery, confectionery, dairy, beverages, and savory snacks, contribute significantly to market expansion. Innovation in flavor profiles and the development of sustainable and ethically sourced ingredients are also contributing trends. While challenges exist, such as maintaining consistent quality and supply chain complexities associated with natural ingredients, the overall market outlook remains positive, driven by long-term consumer preference shifts towards healthier and more natural food options.
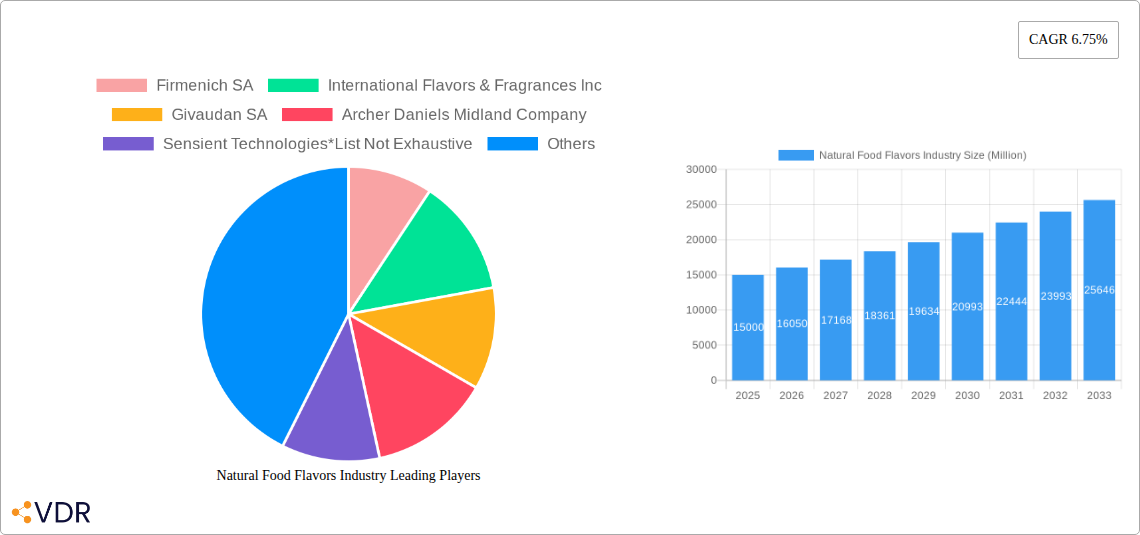
The market segmentation reveals a dynamic landscape. The bakery and confectionery segments are likely to remain substantial contributors due to the established use of flavors in these sectors. However, significant growth opportunities exist in the expanding market for natural flavors in dairy and desserts, and beverages, particularly in non-alcoholic options and functional drinks. The savory and snack segment is also expected to see considerable expansion, driven by the rise in demand for healthier snack choices. Major players like Firmenich SA, International Flavors & Fragrances Inc., and Givaudan SA, alongside other prominent companies, are actively engaged in research and development, aiming to capitalize on market growth by offering innovative and high-quality products. Geographic expansion, particularly in rapidly developing economies of Asia-Pacific and other regions, presents a compelling avenue for future growth and market penetration. Overall, the global natural food flavors market anticipates a positive trajectory, driven by consumer trends, technological advancements, and the strategic actions of key market participants.
Natural Food Flavors Market Report: 2019-2033
This comprehensive report provides an in-depth analysis of the global natural food flavors industry, offering invaluable insights for industry professionals, investors, and stakeholders. With a study period spanning 2019-2033, a base year of 2025, and a forecast period of 2025-2033, this report leverages rigorous data analysis to predict future market trends and opportunities. The report covers key segments, including bakery, confectionery, beverages, and savory applications, and profiles leading players such as Firmenich SA, International Flavors & Fragrances Inc., and Givaudan SA.
Natural Food Flavors Industry Market Dynamics & Structure
The natural food flavors market is characterized by moderate concentration, with a few dominant players holding significant market share. Technological innovation, particularly in extraction and synthesis techniques, is a key driver, alongside rising consumer demand for clean-label products. Stringent regulatory frameworks governing food additives influence market dynamics, while competitive pressures from artificial flavoring alternatives remain a factor. The market witnesses frequent M&A activity, with larger companies acquiring smaller, specialized firms to expand their product portfolios and geographic reach. End-user demographics, particularly the growing health-conscious consumer base, significantly influence market growth.
- Market Concentration: The top 5 players hold approximately xx% of the market share in 2025 (estimated).
- M&A Activity: An average of xx M&A deals per year were observed during the historical period (2019-2024).
- Innovation Barriers: High R&D costs and challenges in replicating complex natural flavor profiles are significant hurdles.
- Regulatory Landscape: Stringent regulations concerning labeling and safety standards across different regions create compliance challenges.
Natural Food Flavors Industry Growth Trends & Insights
The global natural food flavors market experienced robust growth during the historical period (2019-2024), driven by increasing consumer preference for natural and organic food products. The market size expanded from xx million in 2019 to xx million in 2024, exhibiting a CAGR of xx%. This growth is fueled by rising disposable incomes, changing consumer lifestyles, and increased health awareness. Technological advancements in flavor extraction and encapsulation methods have further accelerated market expansion. Furthermore, the rising popularity of plant-based foods and beverages is driving demand for natural flavors in these product categories. Market penetration in emerging economies remains relatively low, presenting significant untapped potential for future growth. The forecast period (2025-2033) projects continued growth, with a projected CAGR of xx%, reaching a market size of xx million by 2033.
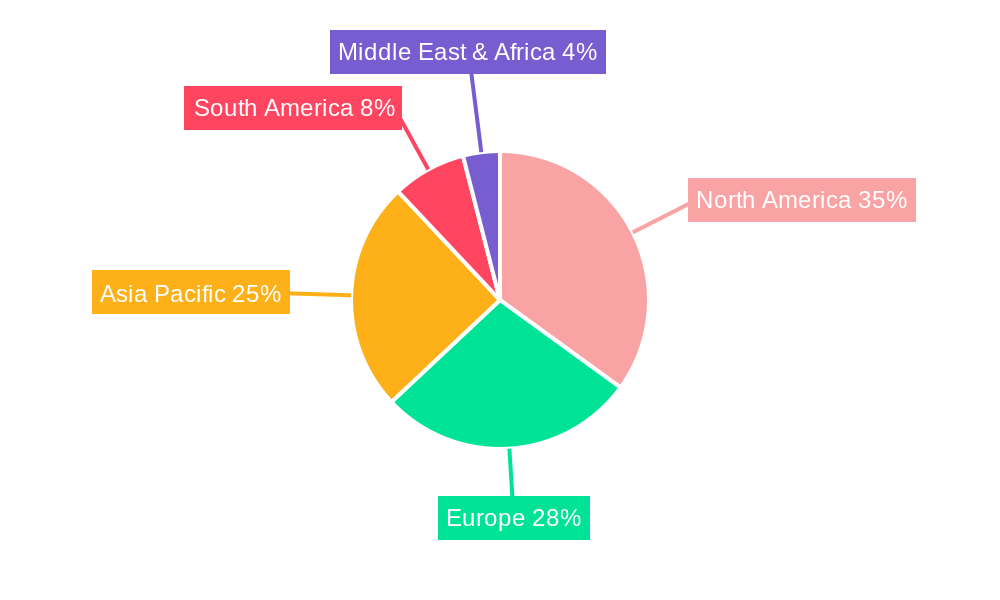
Dominant Regions, Countries, or Segments in Natural Food Flavors Industry
North America and Europe currently dominate the natural food flavors market, driven by high consumer awareness of natural ingredients and strong regulatory frameworks supporting their use. However, the Asia-Pacific region is expected to witness the fastest growth during the forecast period, propelled by rising disposable incomes and a growing preference for Westernized diets. Within application types, the beverages segment holds a significant market share, followed by bakery and confectionery.
- North America: High consumer demand for clean-label products drives significant growth.
- Europe: Stringent regulations and consumer focus on health and wellness contribute to market dominance.
- Asia-Pacific: Rapid economic growth and changing dietary preferences fuel high growth potential.
- Beverages Segment: Largest segment by value, driven by the popularity of functional beverages and ready-to-drink products.
- Bakery and Confectionery: Significant demand for natural flavors in baked goods and sweets contributes substantially to market value.
Natural Food Flavors Industry Product Landscape
The natural food flavors market offers a diverse range of products, from single-ingredient extracts to complex flavor blends designed to meet specific applications. Continuous innovation focuses on improving flavor stability, enhancing sensory attributes, and developing sustainable extraction methods. Unique selling propositions include organic certification, non-GMO status, and allergen-free options. Advances in biotechnology and precision fermentation are revolutionizing the production of natural flavors, enabling the creation of more complex and nuanced flavor profiles.
Key Drivers, Barriers & Challenges in Natural Food Flavors Industry
Key Drivers:
- Increasing consumer preference for natural and clean-label products.
- Growing health consciousness and demand for healthier food choices.
- Technological advancements in extraction and production techniques.
- Expansion of the functional food and beverage market.
Challenges:
- High cost of production for some natural flavors compared to artificial alternatives.
- Fluctuations in raw material prices impacting profitability.
- Stringent regulatory requirements and compliance complexities.
- Competition from synthetic and artificial flavoring agents. The competitive landscape presents significant challenges, with estimated price wars reducing profit margins by an estimated xx% annually during the forecast period.
Emerging Opportunities in Natural Food Flavors Industry
- Growing demand for natural flavors in plant-based foods and beverages presents a significant opportunity.
- Expansion into emerging markets with untapped potential for growth.
- Development of novel flavor profiles and ingredient combinations catering to evolving consumer preferences (e.g., ethnic cuisines, exotic fruits).
- Innovation in flavor delivery systems and encapsulation technologies.
Growth Accelerators in the Natural Food Flavors Industry Industry
Strategic partnerships and collaborations between flavor manufacturers and food and beverage companies are accelerating market growth. Technological breakthroughs in fermentation and bio-engineering enable the production of new and sustainable natural flavor ingredients. Expansion into untapped markets and the development of customized flavor solutions for specific applications further drive market growth.
Key Players Shaping the Natural Food Flavors Industry Market
- Firmenich SA
- International Flavors & Fragrances Inc
- Givaudan SA
- Archer Daniels Midland Company
- Sensient Technologies
- BASF SE
- Kerry Group PLC
- Corbion NV
Notable Milestones in Natural Food Flavors Industry Sector
- 2021: Firmenich SA launched a new line of sustainably sourced natural flavors.
- 2022: Givaudan SA acquired a smaller flavor company, expanding its product portfolio.
- 2023: Increased investment in R&D for natural flavor extraction techniques by several key players. (Specific details would need to be researched for greater accuracy).
In-Depth Natural Food Flavors Industry Market Outlook
The future of the natural food flavors market appears bright, with sustained growth driven by an ongoing shift towards healthier and more natural food options. The market’s expansion into emerging economies, coupled with technological advancements and strategic partnerships, will unlock significant growth opportunities. The focus on sustainability and ethical sourcing will further shape market dynamics, creating new opportunities for innovative and responsible businesses.
Natural Food Flavors Industry Segmentation
-
1. Application Type
- 1.1. Bakery
- 1.2. Confectionery
- 1.3. Dairy and Desserts
-
1.4. Beverages
- 1.4.1. Alcoholic
- 1.4.2. Non-alcoholic
- 1.5. Savory and Snacks
- 1.6. Meat and Meat Products
- 1.7. Sauces, Soups, and Seasonings
- 1.8. Other Applications
Natural Food Flavors Industry Segmentation By Geography
-
1. North America
- 1.1. United States
- 1.2. Canada
- 1.3. Mexico
- 1.4. Rest of North America
-
2. Europe
- 2.1. Germany
- 2.2. United Kingdom
- 2.3. France
- 2.4. Spain
- 2.5. Italy
- 2.6. Rest of Europe
-
3. Asia Pacific
- 3.1. China
- 3.2. Japan
- 3.3. India
- 3.4. Australia
- 3.5. Rest of Asia Pacific
-
4. Rest of the World
- 4.1. South America
- 4.2. Middle East
Natural Food Flavors Industry REPORT HIGHLIGHTS
| Aspects | Details |
|---|---|
| Study Period | 2019-2033 |
| Base Year | 2024 |
| Estimated Year | 2025 |
| Forecast Period | 2025-2033 |
| Historical Period | 2019-2024 |
| Growth Rate | CAGR of 6.75% from 2019-2033 |
| Segmentation |
|
Table of Contents
- 1. Introduction
- 1.1. Research Scope
- 1.2. Market Segmentation
- 1.3. Research Methodology
- 1.4. Definitions and Assumptions
- 2. Executive Summary
- 2.1. Introduction
- 3. Market Dynamics
- 3.1. Introduction
- 3.2. Market Drivers
- 3.2.1. Demand for Convenient Ready-to-Eat Food Products; Growing Affinity Toward Ethnic and Organic Frozen Ready Meals
- 3.3. Market Restrains
- 3.3.1. Rising Concerns Over Food Safety and Quality
- 3.4. Market Trends
- 3.4.1. Resurgance of Natural Food Products Among Consumers
- 4. Market Factor Analysis
- 4.1. Porters Five Forces
- 4.2. Supply/Value Chain
- 4.3. PESTEL analysis
- 4.4. Market Entropy
- 4.5. Patent/Trademark Analysis
- 5. Global Natural Food Flavors Industry Analysis, Insights and Forecast, 2019-2031
- 5.1. Market Analysis, Insights and Forecast - by Application Type
- 5.1.1. Bakery
- 5.1.2. Confectionery
- 5.1.3. Dairy and Desserts
- 5.1.4. Beverages
- 5.1.4.1. Alcoholic
- 5.1.4.2. Non-alcoholic
- 5.1.5. Savory and Snacks
- 5.1.6. Meat and Meat Products
- 5.1.7. Sauces, Soups, and Seasonings
- 5.1.8. Other Applications
- 5.2. Market Analysis, Insights and Forecast - by Region
- 5.2.1. North America
- 5.2.2. Europe
- 5.2.3. Asia Pacific
- 5.2.4. Rest of the World
- 5.1. Market Analysis, Insights and Forecast - by Application Type
- 6. North America Natural Food Flavors Industry Analysis, Insights and Forecast, 2019-2031
- 6.1. Market Analysis, Insights and Forecast - by Application Type
- 6.1.1. Bakery
- 6.1.2. Confectionery
- 6.1.3. Dairy and Desserts
- 6.1.4. Beverages
- 6.1.4.1. Alcoholic
- 6.1.4.2. Non-alcoholic
- 6.1.5. Savory and Snacks
- 6.1.6. Meat and Meat Products
- 6.1.7. Sauces, Soups, and Seasonings
- 6.1.8. Other Applications
- 6.1. Market Analysis, Insights and Forecast - by Application Type
- 7. Europe Natural Food Flavors Industry Analysis, Insights and Forecast, 2019-2031
- 7.1. Market Analysis, Insights and Forecast - by Application Type
- 7.1.1. Bakery
- 7.1.2. Confectionery
- 7.1.3. Dairy and Desserts
- 7.1.4. Beverages
- 7.1.4.1. Alcoholic
- 7.1.4.2. Non-alcoholic
- 7.1.5. Savory and Snacks
- 7.1.6. Meat and Meat Products
- 7.1.7. Sauces, Soups, and Seasonings
- 7.1.8. Other Applications
- 7.1. Market Analysis, Insights and Forecast - by Application Type
- 8. Asia Pacific Natural Food Flavors Industry Analysis, Insights and Forecast, 2019-2031
- 8.1. Market Analysis, Insights and Forecast - by Application Type
- 8.1.1. Bakery
- 8.1.2. Confectionery
- 8.1.3. Dairy and Desserts
- 8.1.4. Beverages
- 8.1.4.1. Alcoholic
- 8.1.4.2. Non-alcoholic
- 8.1.5. Savory and Snacks
- 8.1.6. Meat and Meat Products
- 8.1.7. Sauces, Soups, and Seasonings
- 8.1.8. Other Applications
- 8.1. Market Analysis, Insights and Forecast - by Application Type
- 9. Rest of the World Natural Food Flavors Industry Analysis, Insights and Forecast, 2019-2031
- 9.1. Market Analysis, Insights and Forecast - by Application Type
- 9.1.1. Bakery
- 9.1.2. Confectionery
- 9.1.3. Dairy and Desserts
- 9.1.4. Beverages
- 9.1.4.1. Alcoholic
- 9.1.4.2. Non-alcoholic
- 9.1.5. Savory and Snacks
- 9.1.6. Meat and Meat Products
- 9.1.7. Sauces, Soups, and Seasonings
- 9.1.8. Other Applications
- 9.1. Market Analysis, Insights and Forecast - by Application Type
- 10. North America Natural Food Flavors Industry Analysis, Insights and Forecast, 2019-2031
- 10.1. Market Analysis, Insights and Forecast - By Country/Sub-region
- 10.1.1 United States
- 10.1.2 Canada
- 10.1.3 Mexico
- 11. Europe Natural Food Flavors Industry Analysis, Insights and Forecast, 2019-2031
- 11.1. Market Analysis, Insights and Forecast - By Country/Sub-region
- 11.1.1 Germany
- 11.1.2 United Kingdom
- 11.1.3 France
- 11.1.4 Spain
- 11.1.5 Italy
- 11.1.6 Spain
- 11.1.7 Belgium
- 11.1.8 Netherland
- 11.1.9 Nordics
- 11.1.10 Rest of Europe
- 12. Asia Pacific Natural Food Flavors Industry Analysis, Insights and Forecast, 2019-2031
- 12.1. Market Analysis, Insights and Forecast - By Country/Sub-region
- 12.1.1 China
- 12.1.2 Japan
- 12.1.3 India
- 12.1.4 South Korea
- 12.1.5 Southeast Asia
- 12.1.6 Australia
- 12.1.7 Indonesia
- 12.1.8 Phillipes
- 12.1.9 Singapore
- 12.1.10 Thailandc
- 12.1.11 Rest of Asia Pacific
- 13. South America Natural Food Flavors Industry Analysis, Insights and Forecast, 2019-2031
- 13.1. Market Analysis, Insights and Forecast - By Country/Sub-region
- 13.1.1 Brazil
- 13.1.2 Argentina
- 13.1.3 Peru
- 13.1.4 Chile
- 13.1.5 Colombia
- 13.1.6 Ecuador
- 13.1.7 Venezuela
- 13.1.8 Rest of South America
- 14. Middle East & Africa Natural Food Flavors Industry Analysis, Insights and Forecast, 2019-2031
- 14.1. Market Analysis, Insights and Forecast - By Country/Sub-region
- 14.1.1 UAE
- 14.1.2 South Africa
- 14.1.3 Saudi Arabia
- 14.1.4 Rest of MEA
- 15. Competitive Analysis
- 15.1. Global Market Share Analysis 2024
- 15.2. Company Profiles
- 15.2.1 Firmenich SA
- 15.2.1.1. Overview
- 15.2.1.2. Products
- 15.2.1.3. SWOT Analysis
- 15.2.1.4. Recent Developments
- 15.2.1.5. Financials (Based on Availability)
- 15.2.2 International Flavors & Fragrances Inc
- 15.2.2.1. Overview
- 15.2.2.2. Products
- 15.2.2.3. SWOT Analysis
- 15.2.2.4. Recent Developments
- 15.2.2.5. Financials (Based on Availability)
- 15.2.3 Givaudan SA
- 15.2.3.1. Overview
- 15.2.3.2. Products
- 15.2.3.3. SWOT Analysis
- 15.2.3.4. Recent Developments
- 15.2.3.5. Financials (Based on Availability)
- 15.2.4 Archer Daniels Midland Company
- 15.2.4.1. Overview
- 15.2.4.2. Products
- 15.2.4.3. SWOT Analysis
- 15.2.4.4. Recent Developments
- 15.2.4.5. Financials (Based on Availability)
- 15.2.5 Sensient Technologies*List Not Exhaustive
- 15.2.5.1. Overview
- 15.2.5.2. Products
- 15.2.5.3. SWOT Analysis
- 15.2.5.4. Recent Developments
- 15.2.5.5. Financials (Based on Availability)
- 15.2.6 BASF SE
- 15.2.6.1. Overview
- 15.2.6.2. Products
- 15.2.6.3. SWOT Analysis
- 15.2.6.4. Recent Developments
- 15.2.6.5. Financials (Based on Availability)
- 15.2.7 Kerry Group PLC
- 15.2.7.1. Overview
- 15.2.7.2. Products
- 15.2.7.3. SWOT Analysis
- 15.2.7.4. Recent Developments
- 15.2.7.5. Financials (Based on Availability)
- 15.2.8 Corbion NV
- 15.2.8.1. Overview
- 15.2.8.2. Products
- 15.2.8.3. SWOT Analysis
- 15.2.8.4. Recent Developments
- 15.2.8.5. Financials (Based on Availability)
- 15.2.1 Firmenich SA
List of Figures
- Figure 1: Global Natural Food Flavors Industry Revenue Breakdown (Million, %) by Region 2024 & 2032
- Figure 2: North America Natural Food Flavors Industry Revenue (Million), by Country 2024 & 2032
- Figure 3: North America Natural Food Flavors Industry Revenue Share (%), by Country 2024 & 2032
- Figure 4: Europe Natural Food Flavors Industry Revenue (Million), by Country 2024 & 2032
- Figure 5: Europe Natural Food Flavors Industry Revenue Share (%), by Country 2024 & 2032
- Figure 6: Asia Pacific Natural Food Flavors Industry Revenue (Million), by Country 2024 & 2032
- Figure 7: Asia Pacific Natural Food Flavors Industry Revenue Share (%), by Country 2024 & 2032
- Figure 8: South America Natural Food Flavors Industry Revenue (Million), by Country 2024 & 2032
- Figure 9: South America Natural Food Flavors Industry Revenue Share (%), by Country 2024 & 2032
- Figure 10: Middle East & Africa Natural Food Flavors Industry Revenue (Million), by Country 2024 & 2032
- Figure 11: Middle East & Africa Natural Food Flavors Industry Revenue Share (%), by Country 2024 & 2032
- Figure 12: North America Natural Food Flavors Industry Revenue (Million), by Application Type 2024 & 2032
- Figure 13: North America Natural Food Flavors Industry Revenue Share (%), by Application Type 2024 & 2032
- Figure 14: North America Natural Food Flavors Industry Revenue (Million), by Country 2024 & 2032
- Figure 15: North America Natural Food Flavors Industry Revenue Share (%), by Country 2024 & 2032
- Figure 16: Europe Natural Food Flavors Industry Revenue (Million), by Application Type 2024 & 2032
- Figure 17: Europe Natural Food Flavors Industry Revenue Share (%), by Application Type 2024 & 2032
- Figure 18: Europe Natural Food Flavors Industry Revenue (Million), by Country 2024 & 2032
- Figure 19: Europe Natural Food Flavors Industry Revenue Share (%), by Country 2024 & 2032
- Figure 20: Asia Pacific Natural Food Flavors Industry Revenue (Million), by Application Type 2024 & 2032
- Figure 21: Asia Pacific Natural Food Flavors Industry Revenue Share (%), by Application Type 2024 & 2032
- Figure 22: Asia Pacific Natural Food Flavors Industry Revenue (Million), by Country 2024 & 2032
- Figure 23: Asia Pacific Natural Food Flavors Industry Revenue Share (%), by Country 2024 & 2032
- Figure 24: Rest of the World Natural Food Flavors Industry Revenue (Million), by Application Type 2024 & 2032
- Figure 25: Rest of the World Natural Food Flavors Industry Revenue Share (%), by Application Type 2024 & 2032
- Figure 26: Rest of the World Natural Food Flavors Industry Revenue (Million), by Country 2024 & 2032
- Figure 27: Rest of the World Natural Food Flavors Industry Revenue Share (%), by Country 2024 & 2032
List of Tables
- Table 1: Global Natural Food Flavors Industry Revenue Million Forecast, by Region 2019 & 2032
- Table 2: Global Natural Food Flavors Industry Revenue Million Forecast, by Application Type 2019 & 2032
- Table 3: Global Natural Food Flavors Industry Revenue Million Forecast, by Region 2019 & 2032
- Table 4: Global Natural Food Flavors Industry Revenue Million Forecast, by Country 2019 & 2032
- Table 5: United States Natural Food Flavors Industry Revenue (Million) Forecast, by Application 2019 & 2032
- Table 6: Canada Natural Food Flavors Industry Revenue (Million) Forecast, by Application 2019 & 2032
- Table 7: Mexico Natural Food Flavors Industry Revenue (Million) Forecast, by Application 2019 & 2032
- Table 8: Global Natural Food Flavors Industry Revenue Million Forecast, by Country 2019 & 2032
- Table 9: Germany Natural Food Flavors Industry Revenue (Million) Forecast, by Application 2019 & 2032
- Table 10: United Kingdom Natural Food Flavors Industry Revenue (Million) Forecast, by Application 2019 & 2032
- Table 11: France Natural Food Flavors Industry Revenue (Million) Forecast, by Application 2019 & 2032
- Table 12: Spain Natural Food Flavors Industry Revenue (Million) Forecast, by Application 2019 & 2032
- Table 13: Italy Natural Food Flavors Industry Revenue (Million) Forecast, by Application 2019 & 2032
- Table 14: Spain Natural Food Flavors Industry Revenue (Million) Forecast, by Application 2019 & 2032
- Table 15: Belgium Natural Food Flavors Industry Revenue (Million) Forecast, by Application 2019 & 2032
- Table 16: Netherland Natural Food Flavors Industry Revenue (Million) Forecast, by Application 2019 & 2032
- Table 17: Nordics Natural Food Flavors Industry Revenue (Million) Forecast, by Application 2019 & 2032
- Table 18: Rest of Europe Natural Food Flavors Industry Revenue (Million) Forecast, by Application 2019 & 2032
- Table 19: Global Natural Food Flavors Industry Revenue Million Forecast, by Country 2019 & 2032
- Table 20: China Natural Food Flavors Industry Revenue (Million) Forecast, by Application 2019 & 2032
- Table 21: Japan Natural Food Flavors Industry Revenue (Million) Forecast, by Application 2019 & 2032
- Table 22: India Natural Food Flavors Industry Revenue (Million) Forecast, by Application 2019 & 2032
- Table 23: South Korea Natural Food Flavors Industry Revenue (Million) Forecast, by Application 2019 & 2032
- Table 24: Southeast Asia Natural Food Flavors Industry Revenue (Million) Forecast, by Application 2019 & 2032
- Table 25: Australia Natural Food Flavors Industry Revenue (Million) Forecast, by Application 2019 & 2032
- Table 26: Indonesia Natural Food Flavors Industry Revenue (Million) Forecast, by Application 2019 & 2032
- Table 27: Phillipes Natural Food Flavors Industry Revenue (Million) Forecast, by Application 2019 & 2032
- Table 28: Singapore Natural Food Flavors Industry Revenue (Million) Forecast, by Application 2019 & 2032
- Table 29: Thailandc Natural Food Flavors Industry Revenue (Million) Forecast, by Application 2019 & 2032
- Table 30: Rest of Asia Pacific Natural Food Flavors Industry Revenue (Million) Forecast, by Application 2019 & 2032
- Table 31: Global Natural Food Flavors Industry Revenue Million Forecast, by Country 2019 & 2032
- Table 32: Brazil Natural Food Flavors Industry Revenue (Million) Forecast, by Application 2019 & 2032
- Table 33: Argentina Natural Food Flavors Industry Revenue (Million) Forecast, by Application 2019 & 2032
- Table 34: Peru Natural Food Flavors Industry Revenue (Million) Forecast, by Application 2019 & 2032
- Table 35: Chile Natural Food Flavors Industry Revenue (Million) Forecast, by Application 2019 & 2032
- Table 36: Colombia Natural Food Flavors Industry Revenue (Million) Forecast, by Application 2019 & 2032
- Table 37: Ecuador Natural Food Flavors Industry Revenue (Million) Forecast, by Application 2019 & 2032
- Table 38: Venezuela Natural Food Flavors Industry Revenue (Million) Forecast, by Application 2019 & 2032
- Table 39: Rest of South America Natural Food Flavors Industry Revenue (Million) Forecast, by Application 2019 & 2032
- Table 40: Global Natural Food Flavors Industry Revenue Million Forecast, by Country 2019 & 2032
- Table 41: UAE Natural Food Flavors Industry Revenue (Million) Forecast, by Application 2019 & 2032
- Table 42: South Africa Natural Food Flavors Industry Revenue (Million) Forecast, by Application 2019 & 2032
- Table 43: Saudi Arabia Natural Food Flavors Industry Revenue (Million) Forecast, by Application 2019 & 2032
- Table 44: Rest of MEA Natural Food Flavors Industry Revenue (Million) Forecast, by Application 2019 & 2032
- Table 45: Global Natural Food Flavors Industry Revenue Million Forecast, by Application Type 2019 & 2032
- Table 46: Global Natural Food Flavors Industry Revenue Million Forecast, by Country 2019 & 2032
- Table 47: United States Natural Food Flavors Industry Revenue (Million) Forecast, by Application 2019 & 2032
- Table 48: Canada Natural Food Flavors Industry Revenue (Million) Forecast, by Application 2019 & 2032
- Table 49: Mexico Natural Food Flavors Industry Revenue (Million) Forecast, by Application 2019 & 2032
- Table 50: Rest of North America Natural Food Flavors Industry Revenue (Million) Forecast, by Application 2019 & 2032
- Table 51: Global Natural Food Flavors Industry Revenue Million Forecast, by Application Type 2019 & 2032
- Table 52: Global Natural Food Flavors Industry Revenue Million Forecast, by Country 2019 & 2032
- Table 53: Germany Natural Food Flavors Industry Revenue (Million) Forecast, by Application 2019 & 2032
- Table 54: United Kingdom Natural Food Flavors Industry Revenue (Million) Forecast, by Application 2019 & 2032
- Table 55: France Natural Food Flavors Industry Revenue (Million) Forecast, by Application 2019 & 2032
- Table 56: Spain Natural Food Flavors Industry Revenue (Million) Forecast, by Application 2019 & 2032
- Table 57: Italy Natural Food Flavors Industry Revenue (Million) Forecast, by Application 2019 & 2032
- Table 58: Rest of Europe Natural Food Flavors Industry Revenue (Million) Forecast, by Application 2019 & 2032
- Table 59: Global Natural Food Flavors Industry Revenue Million Forecast, by Application Type 2019 & 2032
- Table 60: Global Natural Food Flavors Industry Revenue Million Forecast, by Country 2019 & 2032
- Table 61: China Natural Food Flavors Industry Revenue (Million) Forecast, by Application 2019 & 2032
- Table 62: Japan Natural Food Flavors Industry Revenue (Million) Forecast, by Application 2019 & 2032
- Table 63: India Natural Food Flavors Industry Revenue (Million) Forecast, by Application 2019 & 2032
- Table 64: Australia Natural Food Flavors Industry Revenue (Million) Forecast, by Application 2019 & 2032
- Table 65: Rest of Asia Pacific Natural Food Flavors Industry Revenue (Million) Forecast, by Application 2019 & 2032
- Table 66: Global Natural Food Flavors Industry Revenue Million Forecast, by Application Type 2019 & 2032
- Table 67: Global Natural Food Flavors Industry Revenue Million Forecast, by Country 2019 & 2032
- Table 68: South America Natural Food Flavors Industry Revenue (Million) Forecast, by Application 2019 & 2032
- Table 69: Middle East Natural Food Flavors Industry Revenue (Million) Forecast, by Application 2019 & 2032
Frequently Asked Questions
1. What is the projected Compound Annual Growth Rate (CAGR) of the Natural Food Flavors Industry?
The projected CAGR is approximately 6.75%.
2. Which companies are prominent players in the Natural Food Flavors Industry?
Key companies in the market include Firmenich SA, International Flavors & Fragrances Inc, Givaudan SA, Archer Daniels Midland Company, Sensient Technologies*List Not Exhaustive, BASF SE, Kerry Group PLC, Corbion NV.
3. What are the main segments of the Natural Food Flavors Industry?
The market segments include Application Type.
4. Can you provide details about the market size?
The market size is estimated to be USD XX Million as of 2022.
5. What are some drivers contributing to market growth?
Demand for Convenient Ready-to-Eat Food Products; Growing Affinity Toward Ethnic and Organic Frozen Ready Meals.
6. What are the notable trends driving market growth?
Resurgance of Natural Food Products Among Consumers.
7. Are there any restraints impacting market growth?
Rising Concerns Over Food Safety and Quality.
8. Can you provide examples of recent developments in the market?
N/A
9. What pricing options are available for accessing the report?
Pricing options include single-user, multi-user, and enterprise licenses priced at USD 4750, USD 5250, and USD 8750 respectively.
10. Is the market size provided in terms of value or volume?
The market size is provided in terms of value, measured in Million.
11. Are there any specific market keywords associated with the report?
Yes, the market keyword associated with the report is "Natural Food Flavors Industry," which aids in identifying and referencing the specific market segment covered.
12. How do I determine which pricing option suits my needs best?
The pricing options vary based on user requirements and access needs. Individual users may opt for single-user licenses, while businesses requiring broader access may choose multi-user or enterprise licenses for cost-effective access to the report.
13. Are there any additional resources or data provided in the Natural Food Flavors Industry report?
While the report offers comprehensive insights, it's advisable to review the specific contents or supplementary materials provided to ascertain if additional resources or data are available.
14. How can I stay updated on further developments or reports in the Natural Food Flavors Industry?
To stay informed about further developments, trends, and reports in the Natural Food Flavors Industry, consider subscribing to industry newsletters, following relevant companies and organizations, or regularly checking reputable industry news sources and publications.
Methodology
Step 1 - Identification of Relevant Samples Size from Population Database


Step 2 - Approaches for Defining Global Market Size (Value, Volume* & Price*)

Note*: In applicable scenarios
Step 3 - Data Sources
Primary Research
- Web Analytics
- Survey Reports
- Research Institute
- Latest Research Reports
- Opinion Leaders
Secondary Research
- Annual Reports
- White Paper
- Latest Press Release
- Industry Association
- Paid Database
- Investor Presentations

Step 4 - Data Triangulation
Involves using different sources of information in order to increase the validity of a study
These sources are likely to be stakeholders in a program - participants, other researchers, program staff, other community members, and so on.
Then we put all data in single framework & apply various statistical tools to find out the dynamic on the market.
During the analysis stage, feedback from the stakeholder groups would be compared to determine areas of agreement as well as areas of divergence


