
Key Insights
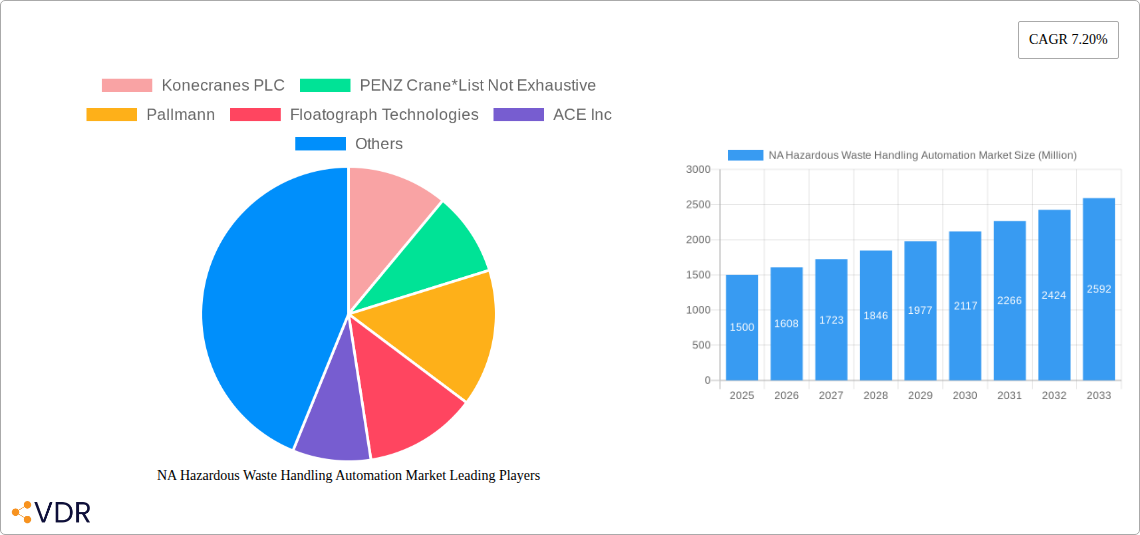
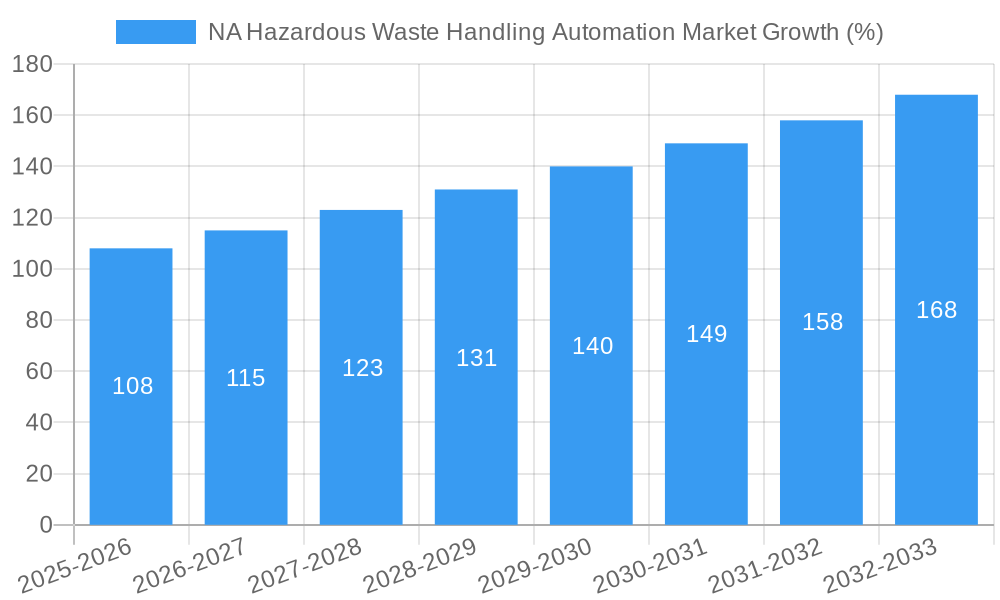
The North American hazardous waste handling automation market is experiencing robust growth, driven by stringent environmental regulations, increasing industrial waste generation, and the rising need for efficient and safe waste management solutions. The market, valued at approximately $1.5 billion in 2025, is projected to maintain a Compound Annual Growth Rate (CAGR) of 7.20% from 2025 to 2033, reaching an estimated value of over $3 billion by 2033. This expansion is fueled by several key factors. The manufacturing, chemical, and energy sectors are major contributors to market growth, demanding automated solutions to handle their hazardous waste efficiently and minimize environmental risks. Technological advancements in manipulator arms, telescoping masts, and size reduction systems are improving the speed, precision, and safety of waste handling processes, thereby driving market adoption. Furthermore, the increasing focus on worker safety and reducing the risk of human error in handling hazardous materials is a significant driver for automation. Government regulations and initiatives promoting sustainable waste management practices are also bolstering market growth.
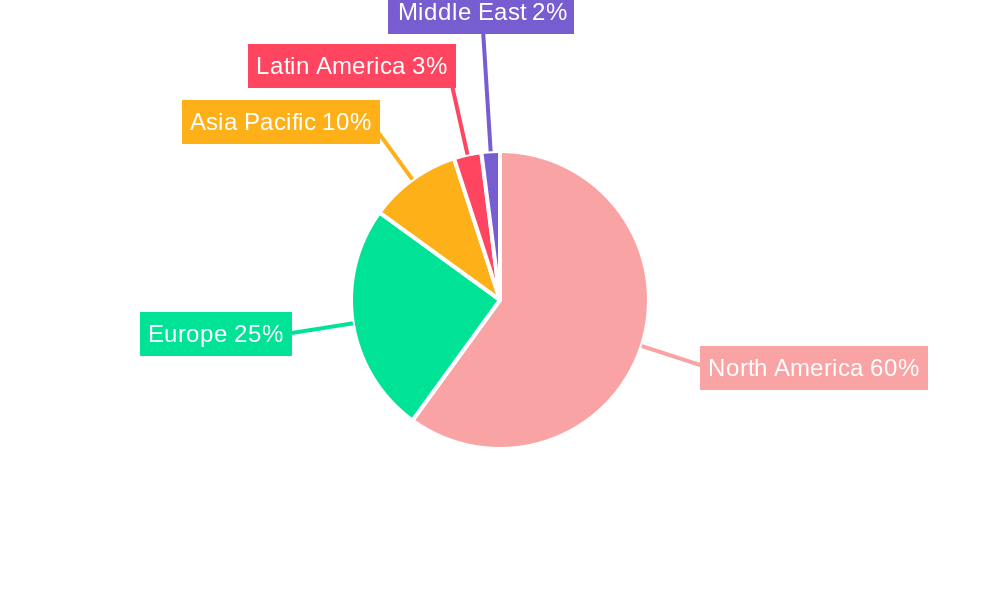
Despite the positive outlook, market growth faces some constraints. High initial investment costs associated with automation technologies can be a barrier for smaller companies. Integration challenges with existing waste management infrastructure and the need for skilled personnel to operate and maintain these systems also pose challenges. However, these challenges are likely to be offset by long-term cost savings and improved efficiency gains provided by automation. The market segmentation reveals a strong demand across various waste types, including listed, characteristic, universal, and mixed wastes, with manipulator arms and telescoping masts leading the product segment. North America dominates the market currently due to its strong regulatory environment and high concentration of industries generating hazardous waste. However, other regions are expected to see increased adoption in the coming years, offering further growth opportunities.
North American Hazardous Waste Handling Automation Market Report: 2019-2033
This comprehensive report provides a detailed analysis of the North American (NA) hazardous waste handling automation market, encompassing market dynamics, growth trends, key players, and future outlook. The study covers the period 2019-2033, with 2025 as the base year and a forecast period of 2025-2033. The market is segmented by type of waste (Listed, Characteristic, Universal, Mixed), product (Manipulator Arms, Telescoping Masts, Cranes, Trusses, Size Reduction Systems, Other Products), end-user industry (Manufacturing, Chemical, Energy, Consumer Care, Government, Other), and country (US, Canada). The market size is valued in million units.
NA Hazardous Waste Handling Automation Market Dynamics & Structure
The NA hazardous waste handling automation market is characterized by moderate concentration, with several key players dominating specific segments. Technological innovation, driven by increasing demand for improved safety and efficiency, is a major growth driver. Stringent regulatory frameworks regarding hazardous waste disposal are also shaping market dynamics, pushing adoption of automation solutions. The market experiences competitive pressure from alternative manual handling methods, however, automation offers significant advantages in terms of safety, speed, and reduced labor costs. End-user demographics, primarily driven by manufacturing and chemical industries, significantly influence market demand. The historical period (2019-2024) saw moderate M&A activity, with xx deals recorded, representing a xx% market share change. This activity is expected to accelerate in the forecast period, driven by consolidation and expansion strategies.
- Market Concentration: Moderately concentrated, with top 5 players holding xx% market share in 2025.
- Technological Innovation: Focus on AI-powered systems, robotics, and improved sensor technologies.
- Regulatory Framework: Stringent EPA and provincial regulations driving automation adoption.
- Competitive Substitutes: Manual handling methods posing a challenge to market growth.
- End-user Demographics: Manufacturing and chemical sectors are major consumers, contributing xx million units in 2025.
- M&A Trends: xx M&A deals recorded in the historical period, with an expected increase in the forecast period.
NA Hazardous Waste Handling Automation Market Growth Trends & Insights
The NA hazardous waste handling automation market experienced a CAGR of xx% during the historical period (2019-2024), reaching a market size of xx million units in 2025. This growth is primarily attributed to increasing environmental concerns, stricter regulations, and the rising demand for efficient and safe waste handling solutions. Adoption rates are increasing steadily across various end-user industries, particularly in the manufacturing and chemical sectors. Technological disruptions, such as the integration of AI and robotics, are accelerating market growth and creating new opportunities. Consumer behavior shifts towards sustainability and environmental responsibility are also supporting the market's expansion. The market penetration rate is expected to reach xx% by 2033. The forecast period (2025-2033) projects a CAGR of xx%, with the market size projected to reach xx million units by 2033.
Dominant Regions, Countries, or Segments in NA Hazardous Waste Handling Automation Market
The US dominates the NA hazardous waste handling automation market, accounting for xx% of the total market share in 2025, due to its large manufacturing and chemical industries. Canada represents a significant portion of the market with xx million units sales in 2025. Within the product segment, cranes hold the largest market share (xx%) followed by manipulator arms (xx%). The manufacturing and chemical end-user industries are the largest consumers, contributing xx% and xx% respectively to the total market value in 2025. Among waste types, Listed Wastes are currently the largest segment, although Characteristic Wastes show the highest growth potential.
- Key Drivers (US): Large manufacturing base, stringent environmental regulations, higher investment in automation.
- Key Drivers (Canada): Growing industrial sector, supportive government policies, increasing environmental awareness.
- Dominant Segments: Cranes (product), Manufacturing & Chemical (end-user), Listed Wastes (waste type).
- Growth Potential: Characteristic Wastes (waste type) shows the highest growth trajectory.
NA Hazardous Waste Handling Automation Market Product Landscape
The market offers a diverse range of products, including manipulator arms for precise waste handling, telescoping masts for extended reach, and various types of cranes for heavy-duty lifting. Size reduction systems are gaining popularity for pre-processing waste materials. Continuous innovation focuses on improving safety features, increasing efficiency, and enhancing precision. Unique selling propositions include AI-powered control systems, advanced sensor integration, and robust design for harsh environments. Technological advancements center on robotics, automation, and improved materials for durability and longevity.
Key Drivers, Barriers & Challenges in NA Hazardous Waste Handling Automation Market
Key Drivers: Increasing regulatory scrutiny, rising labor costs, and the need to improve worker safety are propelling market growth. Advancements in robotics and AI also contribute to efficiency gains, further driving adoption. Government incentives and subsidies for environmentally friendly technologies are also fueling market expansion.
Key Challenges: High initial investment costs for automation systems can be a barrier to entry for smaller companies. Integration complexities and potential supply chain disruptions could affect market expansion. Competition from existing manual handling methods and limited skilled labor for system operation and maintenance can also present challenges. Regulatory hurdles and compliance costs may deter widespread adoption in some cases.
Emerging Opportunities in NA Hazardous Waste Handling Automation Market
Untapped market segments, such as small and medium-sized enterprises (SMEs) in the manufacturing and consumer care industries, present significant opportunities for growth. Innovative applications of automation in specific waste streams (e.g., medical waste, electronic waste) are emerging. The increasing adoption of digital technologies for remote monitoring and predictive maintenance is creating new revenue streams. Evolving consumer preferences for sustainable and environmentally responsible waste management further open the market for automation solutions.
Growth Accelerators in the NA Hazardous Waste Handling Automation Market Industry
Technological breakthroughs in areas such as AI, robotics, and sensor technology will significantly boost market growth. Strategic partnerships between automation providers and waste management companies can enhance the scalability and effectiveness of automation solutions. Expansion strategies into untapped markets and the development of customized solutions for specific waste handling needs will accelerate market penetration. Government initiatives promoting the adoption of sustainable waste management practices will further stimulate market expansion.
Key Players Shaping the NA Hazardous Waste Handling Automation Market Market
- Konecranes PLC
- PENZ Crane
- Pallmann
- Floatograph Technologies
- ACE Inc
- PaR Systems Inc
- Hiab
- Hosokawa Micron Powder Systems
- DX Engineering
- Terex MHPS GmbH
Notable Milestones in NA Hazardous Waste Handling Automation Market Sector
- Aug 2022: DX Engineering acquired Hi-Z Antennas, expanding its product portfolio and strengthening its position in the market. This acquisition demonstrates a willingness to consolidate and strengthen capabilities within the sector, indicating an active market.
- Mar 2022: XL Kranlogistik's significant order for Terex Tower Cranes highlights the growing demand for automated crane systems within the waste handling industry, demonstrating a high level of confidence and indicating strong growth potential.
In-Depth NA Hazardous Waste Handling Automation Market Outlook
The NA hazardous waste handling automation market is poised for significant growth in the coming years, driven by technological advancements, increasing regulatory pressures, and a growing awareness of environmental sustainability. Strategic partnerships, market expansion into untapped segments, and continuous innovation will be key factors in realizing the market's full potential. The market presents attractive opportunities for both established players and new entrants who can offer innovative solutions addressing the evolving needs of the hazardous waste management industry.
NA Hazardous Waste Handling Automation Market Segmentation
-
1. Type of Waste
- 1.1. Listed Wastes
- 1.2. Characteristic Wastes
- 1.3. Universal Wastes
- 1.4. Mixed Wastes
-
2. Product
- 2.1. Manipulator Arms
- 2.2. Telescoping Masts
- 2.3. Cranes
- 2.4. Trusses
- 2.5. Size Reduction Systems
- 2.6. Other Products
-
3. End-user Industry
- 3.1. Manufacturing
- 3.2. Chemical
- 3.3. Energy
- 3.4. Consumer Care
- 3.5. Government
- 3.6. Other End-user Industries
NA Hazardous Waste Handling Automation Market Segmentation By Geography
-
1. North America
- 1.1. United States
- 1.2. Canada
- 1.3. Mexico
-
2. South America
- 2.1. Brazil
- 2.2. Argentina
- 2.3. Rest of South America
-
3. Europe
- 3.1. United Kingdom
- 3.2. Germany
- 3.3. France
- 3.4. Italy
- 3.5. Spain
- 3.6. Russia
- 3.7. Benelux
- 3.8. Nordics
- 3.9. Rest of Europe
-
4. Middle East & Africa
- 4.1. Turkey
- 4.2. Israel
- 4.3. GCC
- 4.4. North Africa
- 4.5. South Africa
- 4.6. Rest of Middle East & Africa
-
5. Asia Pacific
- 5.1. China
- 5.2. India
- 5.3. Japan
- 5.4. South Korea
- 5.5. ASEAN
- 5.6. Oceania
- 5.7. Rest of Asia Pacific
NA Hazardous Waste Handling Automation Market REPORT HIGHLIGHTS
| Aspects | Details |
|---|---|
| Study Period | 2019-2033 |
| Base Year | 2024 |
| Estimated Year | 2025 |
| Forecast Period | 2025-2033 |
| Historical Period | 2019-2024 |
| Growth Rate | CAGR of 7.20% from 2019-2033 |
| Segmentation |
|
Table of Contents
- 1. Introduction
- 1.1. Research Scope
- 1.2. Market Segmentation
- 1.3. Research Methodology
- 1.4. Definitions and Assumptions
- 2. Executive Summary
- 2.1. Introduction
- 3. Market Dynamics
- 3.1. Introduction
- 3.2. Market Drivers
- 3.2.1. Government and Industry Regulations; Growing Concerns overWaste Management
- 3.3. Market Restrains
- 3.3.1. Fluctuations in Raw Material Prices
- 3.4. Market Trends
- 3.4.1. Growing Concerns Over Listed Waste Management Expected to Drive Market Demand
- 4. Market Factor Analysis
- 4.1. Porters Five Forces
- 4.2. Supply/Value Chain
- 4.3. PESTEL analysis
- 4.4. Market Entropy
- 4.5. Patent/Trademark Analysis
- 5. Global NA Hazardous Waste Handling Automation Market Analysis, Insights and Forecast, 2019-2031
- 5.1. Market Analysis, Insights and Forecast - by Type of Waste
- 5.1.1. Listed Wastes
- 5.1.2. Characteristic Wastes
- 5.1.3. Universal Wastes
- 5.1.4. Mixed Wastes
- 5.2. Market Analysis, Insights and Forecast - by Product
- 5.2.1. Manipulator Arms
- 5.2.2. Telescoping Masts
- 5.2.3. Cranes
- 5.2.4. Trusses
- 5.2.5. Size Reduction Systems
- 5.2.6. Other Products
- 5.3. Market Analysis, Insights and Forecast - by End-user Industry
- 5.3.1. Manufacturing
- 5.3.2. Chemical
- 5.3.3. Energy
- 5.3.4. Consumer Care
- 5.3.5. Government
- 5.3.6. Other End-user Industries
- 5.4. Market Analysis, Insights and Forecast - by Region
- 5.4.1. North America
- 5.4.2. South America
- 5.4.3. Europe
- 5.4.4. Middle East & Africa
- 5.4.5. Asia Pacific
- 5.1. Market Analysis, Insights and Forecast - by Type of Waste
- 6. North America NA Hazardous Waste Handling Automation Market Analysis, Insights and Forecast, 2019-2031
- 6.1. Market Analysis, Insights and Forecast - by Type of Waste
- 6.1.1. Listed Wastes
- 6.1.2. Characteristic Wastes
- 6.1.3. Universal Wastes
- 6.1.4. Mixed Wastes
- 6.2. Market Analysis, Insights and Forecast - by Product
- 6.2.1. Manipulator Arms
- 6.2.2. Telescoping Masts
- 6.2.3. Cranes
- 6.2.4. Trusses
- 6.2.5. Size Reduction Systems
- 6.2.6. Other Products
- 6.3. Market Analysis, Insights and Forecast - by End-user Industry
- 6.3.1. Manufacturing
- 6.3.2. Chemical
- 6.3.3. Energy
- 6.3.4. Consumer Care
- 6.3.5. Government
- 6.3.6. Other End-user Industries
- 6.1. Market Analysis, Insights and Forecast - by Type of Waste
- 7. South America NA Hazardous Waste Handling Automation Market Analysis, Insights and Forecast, 2019-2031
- 7.1. Market Analysis, Insights and Forecast - by Type of Waste
- 7.1.1. Listed Wastes
- 7.1.2. Characteristic Wastes
- 7.1.3. Universal Wastes
- 7.1.4. Mixed Wastes
- 7.2. Market Analysis, Insights and Forecast - by Product
- 7.2.1. Manipulator Arms
- 7.2.2. Telescoping Masts
- 7.2.3. Cranes
- 7.2.4. Trusses
- 7.2.5. Size Reduction Systems
- 7.2.6. Other Products
- 7.3. Market Analysis, Insights and Forecast - by End-user Industry
- 7.3.1. Manufacturing
- 7.3.2. Chemical
- 7.3.3. Energy
- 7.3.4. Consumer Care
- 7.3.5. Government
- 7.3.6. Other End-user Industries
- 7.1. Market Analysis, Insights and Forecast - by Type of Waste
- 8. Europe NA Hazardous Waste Handling Automation Market Analysis, Insights and Forecast, 2019-2031
- 8.1. Market Analysis, Insights and Forecast - by Type of Waste
- 8.1.1. Listed Wastes
- 8.1.2. Characteristic Wastes
- 8.1.3. Universal Wastes
- 8.1.4. Mixed Wastes
- 8.2. Market Analysis, Insights and Forecast - by Product
- 8.2.1. Manipulator Arms
- 8.2.2. Telescoping Masts
- 8.2.3. Cranes
- 8.2.4. Trusses
- 8.2.5. Size Reduction Systems
- 8.2.6. Other Products
- 8.3. Market Analysis, Insights and Forecast - by End-user Industry
- 8.3.1. Manufacturing
- 8.3.2. Chemical
- 8.3.3. Energy
- 8.3.4. Consumer Care
- 8.3.5. Government
- 8.3.6. Other End-user Industries
- 8.1. Market Analysis, Insights and Forecast - by Type of Waste
- 9. Middle East & Africa NA Hazardous Waste Handling Automation Market Analysis, Insights and Forecast, 2019-2031
- 9.1. Market Analysis, Insights and Forecast - by Type of Waste
- 9.1.1. Listed Wastes
- 9.1.2. Characteristic Wastes
- 9.1.3. Universal Wastes
- 9.1.4. Mixed Wastes
- 9.2. Market Analysis, Insights and Forecast - by Product
- 9.2.1. Manipulator Arms
- 9.2.2. Telescoping Masts
- 9.2.3. Cranes
- 9.2.4. Trusses
- 9.2.5. Size Reduction Systems
- 9.2.6. Other Products
- 9.3. Market Analysis, Insights and Forecast - by End-user Industry
- 9.3.1. Manufacturing
- 9.3.2. Chemical
- 9.3.3. Energy
- 9.3.4. Consumer Care
- 9.3.5. Government
- 9.3.6. Other End-user Industries
- 9.1. Market Analysis, Insights and Forecast - by Type of Waste
- 10. Asia Pacific NA Hazardous Waste Handling Automation Market Analysis, Insights and Forecast, 2019-2031
- 10.1. Market Analysis, Insights and Forecast - by Type of Waste
- 10.1.1. Listed Wastes
- 10.1.2. Characteristic Wastes
- 10.1.3. Universal Wastes
- 10.1.4. Mixed Wastes
- 10.2. Market Analysis, Insights and Forecast - by Product
- 10.2.1. Manipulator Arms
- 10.2.2. Telescoping Masts
- 10.2.3. Cranes
- 10.2.4. Trusses
- 10.2.5. Size Reduction Systems
- 10.2.6. Other Products
- 10.3. Market Analysis, Insights and Forecast - by End-user Industry
- 10.3.1. Manufacturing
- 10.3.2. Chemical
- 10.3.3. Energy
- 10.3.4. Consumer Care
- 10.3.5. Government
- 10.3.6. Other End-user Industries
- 10.1. Market Analysis, Insights and Forecast - by Type of Waste
- 11. North America NA Hazardous Waste Handling Automation Market Analysis, Insights and Forecast, 2019-2031
- 11.1. Market Analysis, Insights and Forecast - By Country/Sub-region
- 11.1.1.
- 12. Europe NA Hazardous Waste Handling Automation Market Analysis, Insights and Forecast, 2019-2031
- 12.1. Market Analysis, Insights and Forecast - By Country/Sub-region
- 12.1.1.
- 13. Asia Pacific NA Hazardous Waste Handling Automation Market Analysis, Insights and Forecast, 2019-2031
- 13.1. Market Analysis, Insights and Forecast - By Country/Sub-region
- 13.1.1.
- 14. Latin America NA Hazardous Waste Handling Automation Market Analysis, Insights and Forecast, 2019-2031
- 14.1. Market Analysis, Insights and Forecast - By Country/Sub-region
- 14.1.1.
- 15. Middle East NA Hazardous Waste Handling Automation Market Analysis, Insights and Forecast, 2019-2031
- 15.1. Market Analysis, Insights and Forecast - By Country/Sub-region
- 15.1.1.
- 16. Competitive Analysis
- 16.1. Global Market Share Analysis 2024
- 16.2. Company Profiles
- 16.2.1 Konecranes PLC
- 16.2.1.1. Overview
- 16.2.1.2. Products
- 16.2.1.3. SWOT Analysis
- 16.2.1.4. Recent Developments
- 16.2.1.5. Financials (Based on Availability)
- 16.2.2 PENZ Crane*List Not Exhaustive
- 16.2.2.1. Overview
- 16.2.2.2. Products
- 16.2.2.3. SWOT Analysis
- 16.2.2.4. Recent Developments
- 16.2.2.5. Financials (Based on Availability)
- 16.2.3 Pallmann
- 16.2.3.1. Overview
- 16.2.3.2. Products
- 16.2.3.3. SWOT Analysis
- 16.2.3.4. Recent Developments
- 16.2.3.5. Financials (Based on Availability)
- 16.2.4 Floatograph Technologies
- 16.2.4.1. Overview
- 16.2.4.2. Products
- 16.2.4.3. SWOT Analysis
- 16.2.4.4. Recent Developments
- 16.2.4.5. Financials (Based on Availability)
- 16.2.5 ACE Inc
- 16.2.5.1. Overview
- 16.2.5.2. Products
- 16.2.5.3. SWOT Analysis
- 16.2.5.4. Recent Developments
- 16.2.5.5. Financials (Based on Availability)
- 16.2.6 PaR Systems Inc
- 16.2.6.1. Overview
- 16.2.6.2. Products
- 16.2.6.3. SWOT Analysis
- 16.2.6.4. Recent Developments
- 16.2.6.5. Financials (Based on Availability)
- 16.2.7 Hiab
- 16.2.7.1. Overview
- 16.2.7.2. Products
- 16.2.7.3. SWOT Analysis
- 16.2.7.4. Recent Developments
- 16.2.7.5. Financials (Based on Availability)
- 16.2.8 Hosokawa Micron Powder Systems
- 16.2.8.1. Overview
- 16.2.8.2. Products
- 16.2.8.3. SWOT Analysis
- 16.2.8.4. Recent Developments
- 16.2.8.5. Financials (Based on Availability)
- 16.2.9 DX Engineering
- 16.2.9.1. Overview
- 16.2.9.2. Products
- 16.2.9.3. SWOT Analysis
- 16.2.9.4. Recent Developments
- 16.2.9.5. Financials (Based on Availability)
- 16.2.10 Terex MHPS GmbH
- 16.2.10.1. Overview
- 16.2.10.2. Products
- 16.2.10.3. SWOT Analysis
- 16.2.10.4. Recent Developments
- 16.2.10.5. Financials (Based on Availability)
- 16.2.1 Konecranes PLC
List of Figures
- Figure 1: Global NA Hazardous Waste Handling Automation Market Revenue Breakdown (Million, %) by Region 2024 & 2032
- Figure 2: North America NA Hazardous Waste Handling Automation Market Revenue (Million), by Country 2024 & 2032
- Figure 3: North America NA Hazardous Waste Handling Automation Market Revenue Share (%), by Country 2024 & 2032
- Figure 4: Europe NA Hazardous Waste Handling Automation Market Revenue (Million), by Country 2024 & 2032
- Figure 5: Europe NA Hazardous Waste Handling Automation Market Revenue Share (%), by Country 2024 & 2032
- Figure 6: Asia Pacific NA Hazardous Waste Handling Automation Market Revenue (Million), by Country 2024 & 2032
- Figure 7: Asia Pacific NA Hazardous Waste Handling Automation Market Revenue Share (%), by Country 2024 & 2032
- Figure 8: Latin America NA Hazardous Waste Handling Automation Market Revenue (Million), by Country 2024 & 2032
- Figure 9: Latin America NA Hazardous Waste Handling Automation Market Revenue Share (%), by Country 2024 & 2032
- Figure 10: Middle East NA Hazardous Waste Handling Automation Market Revenue (Million), by Country 2024 & 2032
- Figure 11: Middle East NA Hazardous Waste Handling Automation Market Revenue Share (%), by Country 2024 & 2032
- Figure 12: North America NA Hazardous Waste Handling Automation Market Revenue (Million), by Type of Waste 2024 & 2032
- Figure 13: North America NA Hazardous Waste Handling Automation Market Revenue Share (%), by Type of Waste 2024 & 2032
- Figure 14: North America NA Hazardous Waste Handling Automation Market Revenue (Million), by Product 2024 & 2032
- Figure 15: North America NA Hazardous Waste Handling Automation Market Revenue Share (%), by Product 2024 & 2032
- Figure 16: North America NA Hazardous Waste Handling Automation Market Revenue (Million), by End-user Industry 2024 & 2032
- Figure 17: North America NA Hazardous Waste Handling Automation Market Revenue Share (%), by End-user Industry 2024 & 2032
- Figure 18: North America NA Hazardous Waste Handling Automation Market Revenue (Million), by Country 2024 & 2032
- Figure 19: North America NA Hazardous Waste Handling Automation Market Revenue Share (%), by Country 2024 & 2032
- Figure 20: South America NA Hazardous Waste Handling Automation Market Revenue (Million), by Type of Waste 2024 & 2032
- Figure 21: South America NA Hazardous Waste Handling Automation Market Revenue Share (%), by Type of Waste 2024 & 2032
- Figure 22: South America NA Hazardous Waste Handling Automation Market Revenue (Million), by Product 2024 & 2032
- Figure 23: South America NA Hazardous Waste Handling Automation Market Revenue Share (%), by Product 2024 & 2032
- Figure 24: South America NA Hazardous Waste Handling Automation Market Revenue (Million), by End-user Industry 2024 & 2032
- Figure 25: South America NA Hazardous Waste Handling Automation Market Revenue Share (%), by End-user Industry 2024 & 2032
- Figure 26: South America NA Hazardous Waste Handling Automation Market Revenue (Million), by Country 2024 & 2032
- Figure 27: South America NA Hazardous Waste Handling Automation Market Revenue Share (%), by Country 2024 & 2032
- Figure 28: Europe NA Hazardous Waste Handling Automation Market Revenue (Million), by Type of Waste 2024 & 2032
- Figure 29: Europe NA Hazardous Waste Handling Automation Market Revenue Share (%), by Type of Waste 2024 & 2032
- Figure 30: Europe NA Hazardous Waste Handling Automation Market Revenue (Million), by Product 2024 & 2032
- Figure 31: Europe NA Hazardous Waste Handling Automation Market Revenue Share (%), by Product 2024 & 2032
- Figure 32: Europe NA Hazardous Waste Handling Automation Market Revenue (Million), by End-user Industry 2024 & 2032
- Figure 33: Europe NA Hazardous Waste Handling Automation Market Revenue Share (%), by End-user Industry 2024 & 2032
- Figure 34: Europe NA Hazardous Waste Handling Automation Market Revenue (Million), by Country 2024 & 2032
- Figure 35: Europe NA Hazardous Waste Handling Automation Market Revenue Share (%), by Country 2024 & 2032
- Figure 36: Middle East & Africa NA Hazardous Waste Handling Automation Market Revenue (Million), by Type of Waste 2024 & 2032
- Figure 37: Middle East & Africa NA Hazardous Waste Handling Automation Market Revenue Share (%), by Type of Waste 2024 & 2032
- Figure 38: Middle East & Africa NA Hazardous Waste Handling Automation Market Revenue (Million), by Product 2024 & 2032
- Figure 39: Middle East & Africa NA Hazardous Waste Handling Automation Market Revenue Share (%), by Product 2024 & 2032
- Figure 40: Middle East & Africa NA Hazardous Waste Handling Automation Market Revenue (Million), by End-user Industry 2024 & 2032
- Figure 41: Middle East & Africa NA Hazardous Waste Handling Automation Market Revenue Share (%), by End-user Industry 2024 & 2032
- Figure 42: Middle East & Africa NA Hazardous Waste Handling Automation Market Revenue (Million), by Country 2024 & 2032
- Figure 43: Middle East & Africa NA Hazardous Waste Handling Automation Market Revenue Share (%), by Country 2024 & 2032
- Figure 44: Asia Pacific NA Hazardous Waste Handling Automation Market Revenue (Million), by Type of Waste 2024 & 2032
- Figure 45: Asia Pacific NA Hazardous Waste Handling Automation Market Revenue Share (%), by Type of Waste 2024 & 2032
- Figure 46: Asia Pacific NA Hazardous Waste Handling Automation Market Revenue (Million), by Product 2024 & 2032
- Figure 47: Asia Pacific NA Hazardous Waste Handling Automation Market Revenue Share (%), by Product 2024 & 2032
- Figure 48: Asia Pacific NA Hazardous Waste Handling Automation Market Revenue (Million), by End-user Industry 2024 & 2032
- Figure 49: Asia Pacific NA Hazardous Waste Handling Automation Market Revenue Share (%), by End-user Industry 2024 & 2032
- Figure 50: Asia Pacific NA Hazardous Waste Handling Automation Market Revenue (Million), by Country 2024 & 2032
- Figure 51: Asia Pacific NA Hazardous Waste Handling Automation Market Revenue Share (%), by Country 2024 & 2032
List of Tables
- Table 1: Global NA Hazardous Waste Handling Automation Market Revenue Million Forecast, by Region 2019 & 2032
- Table 2: Global NA Hazardous Waste Handling Automation Market Revenue Million Forecast, by Type of Waste 2019 & 2032
- Table 3: Global NA Hazardous Waste Handling Automation Market Revenue Million Forecast, by Product 2019 & 2032
- Table 4: Global NA Hazardous Waste Handling Automation Market Revenue Million Forecast, by End-user Industry 2019 & 2032
- Table 5: Global NA Hazardous Waste Handling Automation Market Revenue Million Forecast, by Region 2019 & 2032
- Table 6: Global NA Hazardous Waste Handling Automation Market Revenue Million Forecast, by Country 2019 & 2032
- Table 7: NA Hazardous Waste Handling Automation Market Revenue (Million) Forecast, by Application 2019 & 2032
- Table 8: Global NA Hazardous Waste Handling Automation Market Revenue Million Forecast, by Country 2019 & 2032
- Table 9: NA Hazardous Waste Handling Automation Market Revenue (Million) Forecast, by Application 2019 & 2032
- Table 10: Global NA Hazardous Waste Handling Automation Market Revenue Million Forecast, by Country 2019 & 2032
- Table 11: NA Hazardous Waste Handling Automation Market Revenue (Million) Forecast, by Application 2019 & 2032
- Table 12: Global NA Hazardous Waste Handling Automation Market Revenue Million Forecast, by Country 2019 & 2032
- Table 13: NA Hazardous Waste Handling Automation Market Revenue (Million) Forecast, by Application 2019 & 2032
- Table 14: Global NA Hazardous Waste Handling Automation Market Revenue Million Forecast, by Country 2019 & 2032
- Table 15: NA Hazardous Waste Handling Automation Market Revenue (Million) Forecast, by Application 2019 & 2032
- Table 16: Global NA Hazardous Waste Handling Automation Market Revenue Million Forecast, by Type of Waste 2019 & 2032
- Table 17: Global NA Hazardous Waste Handling Automation Market Revenue Million Forecast, by Product 2019 & 2032
- Table 18: Global NA Hazardous Waste Handling Automation Market Revenue Million Forecast, by End-user Industry 2019 & 2032
- Table 19: Global NA Hazardous Waste Handling Automation Market Revenue Million Forecast, by Country 2019 & 2032
- Table 20: United States NA Hazardous Waste Handling Automation Market Revenue (Million) Forecast, by Application 2019 & 2032
- Table 21: Canada NA Hazardous Waste Handling Automation Market Revenue (Million) Forecast, by Application 2019 & 2032
- Table 22: Mexico NA Hazardous Waste Handling Automation Market Revenue (Million) Forecast, by Application 2019 & 2032
- Table 23: Global NA Hazardous Waste Handling Automation Market Revenue Million Forecast, by Type of Waste 2019 & 2032
- Table 24: Global NA Hazardous Waste Handling Automation Market Revenue Million Forecast, by Product 2019 & 2032
- Table 25: Global NA Hazardous Waste Handling Automation Market Revenue Million Forecast, by End-user Industry 2019 & 2032
- Table 26: Global NA Hazardous Waste Handling Automation Market Revenue Million Forecast, by Country 2019 & 2032
- Table 27: Brazil NA Hazardous Waste Handling Automation Market Revenue (Million) Forecast, by Application 2019 & 2032
- Table 28: Argentina NA Hazardous Waste Handling Automation Market Revenue (Million) Forecast, by Application 2019 & 2032
- Table 29: Rest of South America NA Hazardous Waste Handling Automation Market Revenue (Million) Forecast, by Application 2019 & 2032
- Table 30: Global NA Hazardous Waste Handling Automation Market Revenue Million Forecast, by Type of Waste 2019 & 2032
- Table 31: Global NA Hazardous Waste Handling Automation Market Revenue Million Forecast, by Product 2019 & 2032
- Table 32: Global NA Hazardous Waste Handling Automation Market Revenue Million Forecast, by End-user Industry 2019 & 2032
- Table 33: Global NA Hazardous Waste Handling Automation Market Revenue Million Forecast, by Country 2019 & 2032
- Table 34: United Kingdom NA Hazardous Waste Handling Automation Market Revenue (Million) Forecast, by Application 2019 & 2032
- Table 35: Germany NA Hazardous Waste Handling Automation Market Revenue (Million) Forecast, by Application 2019 & 2032
- Table 36: France NA Hazardous Waste Handling Automation Market Revenue (Million) Forecast, by Application 2019 & 2032
- Table 37: Italy NA Hazardous Waste Handling Automation Market Revenue (Million) Forecast, by Application 2019 & 2032
- Table 38: Spain NA Hazardous Waste Handling Automation Market Revenue (Million) Forecast, by Application 2019 & 2032
- Table 39: Russia NA Hazardous Waste Handling Automation Market Revenue (Million) Forecast, by Application 2019 & 2032
- Table 40: Benelux NA Hazardous Waste Handling Automation Market Revenue (Million) Forecast, by Application 2019 & 2032
- Table 41: Nordics NA Hazardous Waste Handling Automation Market Revenue (Million) Forecast, by Application 2019 & 2032
- Table 42: Rest of Europe NA Hazardous Waste Handling Automation Market Revenue (Million) Forecast, by Application 2019 & 2032
- Table 43: Global NA Hazardous Waste Handling Automation Market Revenue Million Forecast, by Type of Waste 2019 & 2032
- Table 44: Global NA Hazardous Waste Handling Automation Market Revenue Million Forecast, by Product 2019 & 2032
- Table 45: Global NA Hazardous Waste Handling Automation Market Revenue Million Forecast, by End-user Industry 2019 & 2032
- Table 46: Global NA Hazardous Waste Handling Automation Market Revenue Million Forecast, by Country 2019 & 2032
- Table 47: Turkey NA Hazardous Waste Handling Automation Market Revenue (Million) Forecast, by Application 2019 & 2032
- Table 48: Israel NA Hazardous Waste Handling Automation Market Revenue (Million) Forecast, by Application 2019 & 2032
- Table 49: GCC NA Hazardous Waste Handling Automation Market Revenue (Million) Forecast, by Application 2019 & 2032
- Table 50: North Africa NA Hazardous Waste Handling Automation Market Revenue (Million) Forecast, by Application 2019 & 2032
- Table 51: South Africa NA Hazardous Waste Handling Automation Market Revenue (Million) Forecast, by Application 2019 & 2032
- Table 52: Rest of Middle East & Africa NA Hazardous Waste Handling Automation Market Revenue (Million) Forecast, by Application 2019 & 2032
- Table 53: Global NA Hazardous Waste Handling Automation Market Revenue Million Forecast, by Type of Waste 2019 & 2032
- Table 54: Global NA Hazardous Waste Handling Automation Market Revenue Million Forecast, by Product 2019 & 2032
- Table 55: Global NA Hazardous Waste Handling Automation Market Revenue Million Forecast, by End-user Industry 2019 & 2032
- Table 56: Global NA Hazardous Waste Handling Automation Market Revenue Million Forecast, by Country 2019 & 2032
- Table 57: China NA Hazardous Waste Handling Automation Market Revenue (Million) Forecast, by Application 2019 & 2032
- Table 58: India NA Hazardous Waste Handling Automation Market Revenue (Million) Forecast, by Application 2019 & 2032
- Table 59: Japan NA Hazardous Waste Handling Automation Market Revenue (Million) Forecast, by Application 2019 & 2032
- Table 60: South Korea NA Hazardous Waste Handling Automation Market Revenue (Million) Forecast, by Application 2019 & 2032
- Table 61: ASEAN NA Hazardous Waste Handling Automation Market Revenue (Million) Forecast, by Application 2019 & 2032
- Table 62: Oceania NA Hazardous Waste Handling Automation Market Revenue (Million) Forecast, by Application 2019 & 2032
- Table 63: Rest of Asia Pacific NA Hazardous Waste Handling Automation Market Revenue (Million) Forecast, by Application 2019 & 2032
Frequently Asked Questions
1. What is the projected Compound Annual Growth Rate (CAGR) of the NA Hazardous Waste Handling Automation Market?
The projected CAGR is approximately 7.20%.
2. Which companies are prominent players in the NA Hazardous Waste Handling Automation Market?
Key companies in the market include Konecranes PLC, PENZ Crane*List Not Exhaustive, Pallmann, Floatograph Technologies, ACE Inc, PaR Systems Inc, Hiab, Hosokawa Micron Powder Systems, DX Engineering, Terex MHPS GmbH.
3. What are the main segments of the NA Hazardous Waste Handling Automation Market?
The market segments include Type of Waste, Product, End-user Industry.
4. Can you provide details about the market size?
The market size is estimated to be USD XX Million as of 2022.
5. What are some drivers contributing to market growth?
Government and Industry Regulations; Growing Concerns overWaste Management.
6. What are the notable trends driving market growth?
Growing Concerns Over Listed Waste Management Expected to Drive Market Demand.
7. Are there any restraints impacting market growth?
Fluctuations in Raw Material Prices.
8. Can you provide examples of recent developments in the market?
Aug 2022: Hi-Z Antennas' whole range of HF directive receiving array products for ham radio operators was bought by DX Engineering, assuring that hams worldwide will still be able to use the company's equipment. The design/manufacturing team at DX Engineering will now create Hi-Z devices.
9. What pricing options are available for accessing the report?
Pricing options include single-user, multi-user, and enterprise licenses priced at USD 4750, USD 4950, and USD 6800 respectively.
10. Is the market size provided in terms of value or volume?
The market size is provided in terms of value, measured in Million.
11. Are there any specific market keywords associated with the report?
Yes, the market keyword associated with the report is "NA Hazardous Waste Handling Automation Market," which aids in identifying and referencing the specific market segment covered.
12. How do I determine which pricing option suits my needs best?
The pricing options vary based on user requirements and access needs. Individual users may opt for single-user licenses, while businesses requiring broader access may choose multi-user or enterprise licenses for cost-effective access to the report.
13. Are there any additional resources or data provided in the NA Hazardous Waste Handling Automation Market report?
While the report offers comprehensive insights, it's advisable to review the specific contents or supplementary materials provided to ascertain if additional resources or data are available.
14. How can I stay updated on further developments or reports in the NA Hazardous Waste Handling Automation Market?
To stay informed about further developments, trends, and reports in the NA Hazardous Waste Handling Automation Market, consider subscribing to industry newsletters, following relevant companies and organizations, or regularly checking reputable industry news sources and publications.
Methodology
Step 1 - Identification of Relevant Samples Size from Population Database


Step 2 - Approaches for Defining Global Market Size (Value, Volume* & Price*)

Note*: In applicable scenarios
Step 3 - Data Sources
Primary Research
- Web Analytics
- Survey Reports
- Research Institute
- Latest Research Reports
- Opinion Leaders
Secondary Research
- Annual Reports
- White Paper
- Latest Press Release
- Industry Association
- Paid Database
- Investor Presentations

Step 4 - Data Triangulation
Involves using different sources of information in order to increase the validity of a study
These sources are likely to be stakeholders in a program - participants, other researchers, program staff, other community members, and so on.
Then we put all data in single framework & apply various statistical tools to find out the dynamic on the market.
During the analysis stage, feedback from the stakeholder groups would be compared to determine areas of agreement as well as areas of divergence


