
Key Insights
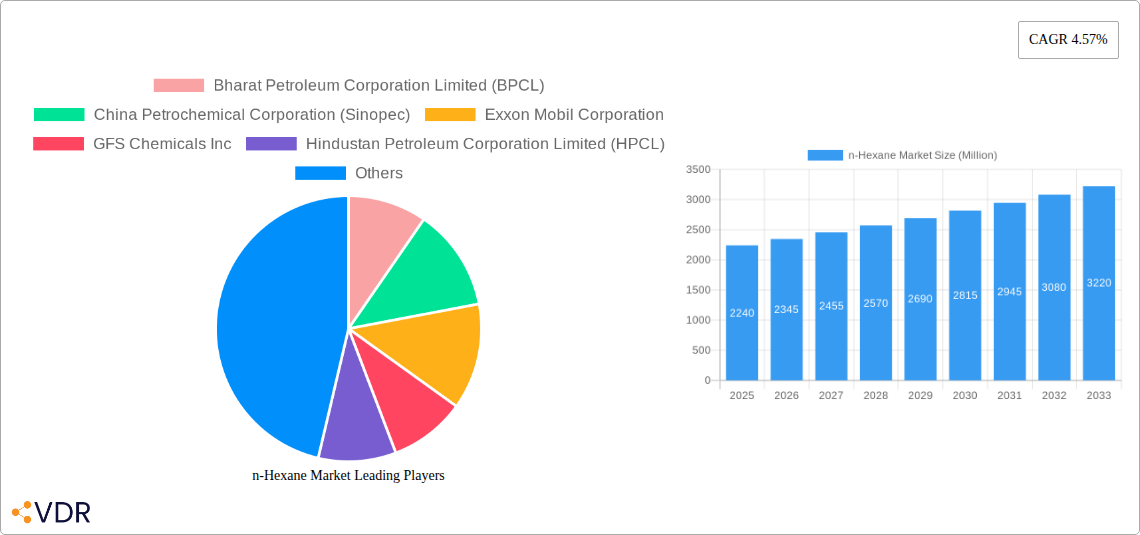
The n-Hexane market, valued at $2.24 billion in 2025, is projected to experience steady growth, driven primarily by its increasing demand in the solvent and chemical manufacturing sectors. The 4.57% CAGR from 2025 to 2033 indicates a robust expansion, fueled by the burgeoning need for n-hexane in the production of adhesives, paints, coatings, and various specialty chemicals. Growth is further supported by the expanding downstream industries like pharmaceuticals and electronics, which rely on n-hexane as a crucial component in their manufacturing processes. While regulatory constraints related to its flammability and toxicity might pose some challenges, technological advancements aimed at improving safety and handling are expected to mitigate these limitations. Furthermore, the increasing adoption of sustainable manufacturing practices within the chemical industry could create opportunities for bio-based n-hexane alternatives, potentially impacting market dynamics in the long term. Major players like Bharat Petroleum Corporation Limited, Sinopec, ExxonMobil, and others are strategically investing in capacity expansions and technological upgrades to cater to the growing demand and maintain market competitiveness. This competitive landscape, coupled with evolving consumer preferences towards eco-friendly products, will shape the trajectory of the n-hexane market over the forecast period.
The competitive dynamics are influenced by the established presence of large multinational corporations alongside regional players. These companies are actively involved in research and development, aiming to enhance the efficiency and sustainability of n-hexane production and applications. The geographical distribution of the market is likely to see variations, with regions possessing robust chemical industries and downstream sectors experiencing higher growth rates. The market is expected to witness strategic alliances, mergers, and acquisitions as companies strive to consolidate their market shares and expand their product portfolios. The ongoing technological innovations focused on improving safety protocols and production efficiency will contribute to the overall growth and development of the n-hexane market, creating opportunities for both established companies and emerging players.
n-Hexane Market: A Comprehensive Market Report (2019-2033)
This in-depth report provides a comprehensive analysis of the global n-Hexane market, encompassing market dynamics, growth trends, regional dominance, product landscape, key players, and future outlook. The study covers the historical period (2019-2024), base year (2025), and forecast period (2025-2033), offering invaluable insights for industry professionals, investors, and strategic decision-makers. The parent market is the petrochemical industry, and the child market is the solvents segment. Market values are presented in million units.
n-Hexane Market Dynamics & Structure
This section analyzes the competitive landscape of the n-hexane market, encompassing market concentration, technological advancements, regulatory compliance, substitute products, end-user demographics, and mergers & acquisitions (M&A) activities. We delve into quantitative data such as market share percentages and M&A deal volumes, alongside qualitative factors like innovation barriers.
- Market Concentration: The n-hexane market exhibits a moderately concentrated structure with a few dominant players holding significant market share. We estimate the top 5 players hold approximately xx% of the global market share in 2025.
- Technological Innovation: Ongoing research focuses on improving production efficiency and exploring alternative synthesis methods to reduce environmental impact. However, high capital expenditure requirements and stringent regulatory hurdles pose significant barriers to innovation.
- Regulatory Landscape: Stringent environmental regulations regarding volatile organic compound (VOC) emissions are impacting production processes and driving the adoption of cleaner technologies. Specific regional regulations are analyzed within the report.
- Competitive Substitutes: Alternative solvents, such as heptane and octane, pose competition; however, n-hexane’s unique properties maintain its dominance in specific applications.
- End-User Demographics: The primary end-users include the adhesives, coatings, and extractions industries, with varying regional demand patterns impacting market segmentation.
- M&A Trends: The n-hexane market has witnessed several M&A activities, primarily driven by consolidation and expansion strategies. The report details xx significant M&A deals that occurred between 2019 and 2024.
n-Hexane Market Growth Trends & Insights
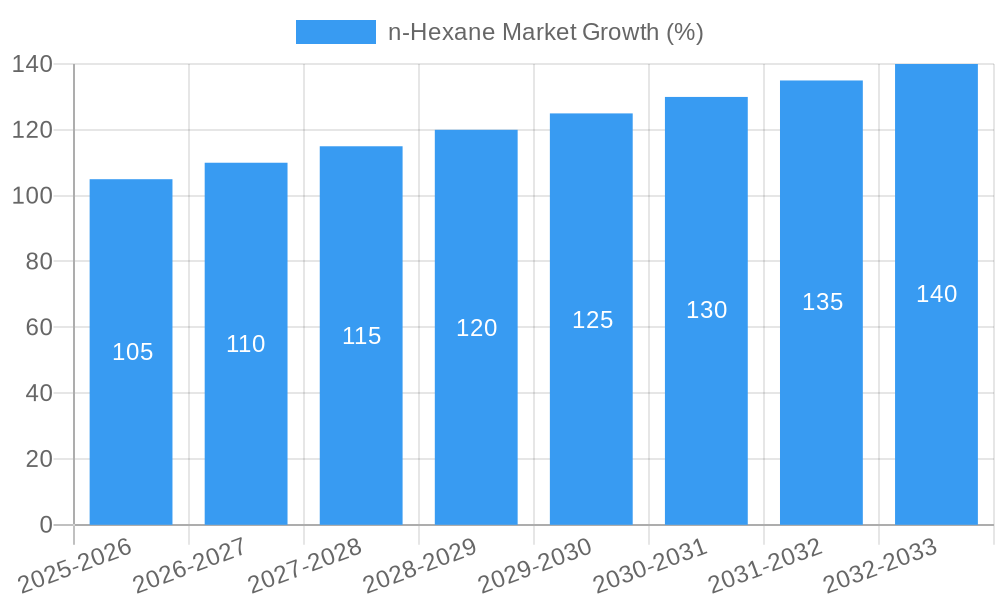
This section leverages extensive market research to analyze the evolution of market size, adoption rates, technological disruptions, and shifts in consumer behavior within the n-hexane market. The analysis includes detailed projections to 2033, incorporating specific metrics like Compound Annual Growth Rate (CAGR) and market penetration rates. The global n-hexane market is projected to reach xx million units by 2033, registering a CAGR of xx% during the forecast period (2025-2033). The increase in demand from key end-use industries, coupled with technological advancements in production processes, is a significant growth driver. The report explores the impact of economic fluctuations and changing consumer preferences on market demand. Specific regions showing higher growth rates are detailed, and a breakdown by application sector (e.g. adhesives, extractions) illustrates the varying growth trajectories.
Dominant Regions, Countries, or Segments in n-Hexane Market
This section identifies the leading regions, countries, or segments driving n-hexane market growth. We analyze dominance factors through detailed market share data and growth potential forecasts.
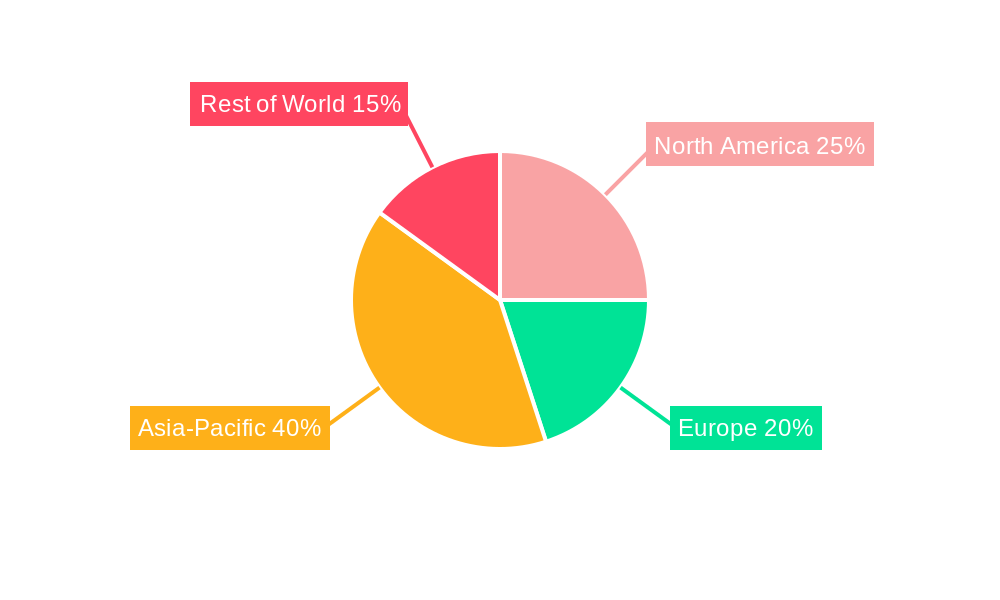
- Asia-Pacific Dominance: The Asia-Pacific region is projected to dominate the n-hexane market throughout the forecast period, driven by rapid industrialization and expanding downstream industries like adhesives and coatings. China and India are key contributors to this regional dominance.
- North America & Europe: North America and Europe hold significant market share, however, growth is expected to be more moderate compared to the Asia-Pacific region.
- Key Drivers:
- Strong economic growth in developing economies.
- Growing demand from key end-use industries.
- Favorable government policies supporting industrial development.
- Expanding infrastructure projects.
The report includes a detailed regional breakdown, incorporating market share data and growth projections for each region.
n-Hexane Market Product Landscape
The n-hexane market primarily comprises high-purity grades, meeting stringent quality requirements for various applications. Recent innovations focus on improved purity levels and enhanced performance characteristics, catering to specific end-user needs. Technological advancements have also led to more efficient and environmentally friendly production processes. The report analyzes the various grades of n-hexane available and their specific applications.
Key Drivers, Barriers & Challenges in n-Hexane Market
Key Drivers:
- Increasing demand from the adhesives and coatings industries.
- Growth in the pharmaceutical and food processing sectors.
- Expanding use in chemical extraction processes.
Key Challenges and Restraints:
- Volatility in crude oil prices, which significantly impacts n-hexane production costs.
- Stringent environmental regulations regarding VOC emissions.
- Intense competition from alternative solvents.
- Supply chain disruptions and logistical challenges.
Emerging Opportunities in n-Hexane Market
Emerging opportunities lie in untapped markets in developing economies, particularly in specialized applications within the pharmaceutical and electronics industries. Innovative applications, such as in the development of sustainable solvents and biodegradable adhesives, present lucrative avenues for growth. The rising demand for environmentally friendly solvents also presents an opportunity for manufacturers to invest in sustainable production methods.
Growth Accelerators in the n-Hexane Market Industry
Technological breakthroughs in production processes, leading to enhanced efficiency and reduced costs, are major growth catalysts. Strategic partnerships and collaborations among industry players are fostering innovation and expansion into new markets. Government initiatives promoting sustainable industrial development further fuel market growth.
Key Players Shaping the n-Hexane Market Market
- Bharat Petroleum Corporation Limited (BPCL)
- China Petrochemical Corporation (Sinopec)
- Exxon Mobil Corporation
- GFS Chemicals Inc
- Hindustan Petroleum Corporation Limited (HPCL)
- Indian Oil Corporation Ltd
- Jun Yuan Petroleum Group
- Liaoning Yufeng Chemical Co Ltd
- Phillips 66 Company
- Rompetrol
- Shell plc
- Shenyang Huifeng Petrochemical Co Ltd
- Sumitomo Chemical Co Ltd
- THAI OIL GROUP
- *List Not Exhaustive
Notable Milestones in n-Hexane Market Sector
- March 2022: Phillips 66 announced its merger with Phillips 66 Partners, strengthening its market position and potentially impacting n-hexane production and distribution strategies.
In-Depth n-Hexane Market Market Outlook
The n-hexane market is poised for substantial growth, driven by ongoing industrial expansion, technological advancements, and increasing demand from key end-use industries. Strategic opportunities exist for players focusing on sustainable production methods, innovative applications, and expanding into emerging markets. The report concludes with a detailed forecast, outlining the potential for market expansion and strategic opportunities for businesses in the coming years.
n-Hexane Market Segmentation
-
1. Type
- 1.1. n-Hexane
- 1.2. Isohexane
- 1.3. Neohexane
-
2. Grade
- 2.1. Polymer Grade
- 2.2. Food Grade
- 2.3. Other Grades
-
3. Application
- 3.1. Industrial Solvents
- 3.2. Edible Oil Extractant
- 3.3. Cleansing and Degreasing
- 3.4. Other Ap
n-Hexane Market Segmentation By Geography
-
1. Asia Pacific
- 1.1. China
- 1.2. India
- 1.3. Japan
- 1.4. South Korea
- 1.5. Malaysia
- 1.6. Thailand
- 1.7. Indonesia
- 1.8. Vietnam
- 1.9. Rest of Asia Pacific
-
2. North America
- 2.1. United States
- 2.2. Canada
- 2.3. Mexico
-
3. Europe
- 3.1. Germany
- 3.2. United Kingdom
- 3.3. Italy
- 3.4. France
- 3.5. Spain
- 3.6. NORDIC
- 3.7. Turkey
- 3.8. Russia
- 3.9. Rest of Europe
-
4. South America
- 4.1. Brazil
- 4.2. Argentina
- 4.3. Colombia
- 4.4. Rest of South America
-
5. Middle East and Africa
- 5.1. Saudi Arabia
- 5.2. South Africa
- 5.3. Nigeria
- 5.4. Qatar
- 5.5. Egypt
- 5.6. United Arab Emirates
- 5.7. Rest of Middle East and Africa
n-Hexane Market REPORT HIGHLIGHTS
| Aspects | Details |
|---|---|
| Study Period | 2019-2033 |
| Base Year | 2024 |
| Estimated Year | 2025 |
| Forecast Period | 2025-2033 |
| Historical Period | 2019-2024 |
| Growth Rate | CAGR of 4.57% from 2019-2033 |
| Segmentation |
|
Table of Contents
- 1. Introduction
- 1.1. Research Scope
- 1.2. Market Segmentation
- 1.3. Research Methodology
- 1.4. Definitions and Assumptions
- 2. Executive Summary
- 2.1. Introduction
- 3. Market Dynamics
- 3.1. Introduction
- 3.2. Market Drivers
- 3.2.1. Growing Demand from Petrochemical Industries; Increasing Demand for Edible Oil Extraction; Other Drivers
- 3.3. Market Restrains
- 3.3.1. Growing Demand from Petrochemical Industries; Increasing Demand for Edible Oil Extraction; Other Drivers
- 3.4. Market Trends
- 3.4.1. Edible Oil Extraction to Dominate the Market
- 4. Market Factor Analysis
- 4.1. Porters Five Forces
- 4.2. Supply/Value Chain
- 4.3. PESTEL analysis
- 4.4. Market Entropy
- 4.5. Patent/Trademark Analysis
- 5. Global n-Hexane Market Analysis, Insights and Forecast, 2019-2031
- 5.1. Market Analysis, Insights and Forecast - by Type
- 5.1.1. n-Hexane
- 5.1.2. Isohexane
- 5.1.3. Neohexane
- 5.2. Market Analysis, Insights and Forecast - by Grade
- 5.2.1. Polymer Grade
- 5.2.2. Food Grade
- 5.2.3. Other Grades
- 5.3. Market Analysis, Insights and Forecast - by Application
- 5.3.1. Industrial Solvents
- 5.3.2. Edible Oil Extractant
- 5.3.3. Cleansing and Degreasing
- 5.3.4. Other Ap
- 5.4. Market Analysis, Insights and Forecast - by Region
- 5.4.1. Asia Pacific
- 5.4.2. North America
- 5.4.3. Europe
- 5.4.4. South America
- 5.4.5. Middle East and Africa
- 5.1. Market Analysis, Insights and Forecast - by Type
- 6. Asia Pacific n-Hexane Market Analysis, Insights and Forecast, 2019-2031
- 6.1. Market Analysis, Insights and Forecast - by Type
- 6.1.1. n-Hexane
- 6.1.2. Isohexane
- 6.1.3. Neohexane
- 6.2. Market Analysis, Insights and Forecast - by Grade
- 6.2.1. Polymer Grade
- 6.2.2. Food Grade
- 6.2.3. Other Grades
- 6.3. Market Analysis, Insights and Forecast - by Application
- 6.3.1. Industrial Solvents
- 6.3.2. Edible Oil Extractant
- 6.3.3. Cleansing and Degreasing
- 6.3.4. Other Ap
- 6.1. Market Analysis, Insights and Forecast - by Type
- 7. North America n-Hexane Market Analysis, Insights and Forecast, 2019-2031
- 7.1. Market Analysis, Insights and Forecast - by Type
- 7.1.1. n-Hexane
- 7.1.2. Isohexane
- 7.1.3. Neohexane
- 7.2. Market Analysis, Insights and Forecast - by Grade
- 7.2.1. Polymer Grade
- 7.2.2. Food Grade
- 7.2.3. Other Grades
- 7.3. Market Analysis, Insights and Forecast - by Application
- 7.3.1. Industrial Solvents
- 7.3.2. Edible Oil Extractant
- 7.3.3. Cleansing and Degreasing
- 7.3.4. Other Ap
- 7.1. Market Analysis, Insights and Forecast - by Type
- 8. Europe n-Hexane Market Analysis, Insights and Forecast, 2019-2031
- 8.1. Market Analysis, Insights and Forecast - by Type
- 8.1.1. n-Hexane
- 8.1.2. Isohexane
- 8.1.3. Neohexane
- 8.2. Market Analysis, Insights and Forecast - by Grade
- 8.2.1. Polymer Grade
- 8.2.2. Food Grade
- 8.2.3. Other Grades
- 8.3. Market Analysis, Insights and Forecast - by Application
- 8.3.1. Industrial Solvents
- 8.3.2. Edible Oil Extractant
- 8.3.3. Cleansing and Degreasing
- 8.3.4. Other Ap
- 8.1. Market Analysis, Insights and Forecast - by Type
- 9. South America n-Hexane Market Analysis, Insights and Forecast, 2019-2031
- 9.1. Market Analysis, Insights and Forecast - by Type
- 9.1.1. n-Hexane
- 9.1.2. Isohexane
- 9.1.3. Neohexane
- 9.2. Market Analysis, Insights and Forecast - by Grade
- 9.2.1. Polymer Grade
- 9.2.2. Food Grade
- 9.2.3. Other Grades
- 9.3. Market Analysis, Insights and Forecast - by Application
- 9.3.1. Industrial Solvents
- 9.3.2. Edible Oil Extractant
- 9.3.3. Cleansing and Degreasing
- 9.3.4. Other Ap
- 9.1. Market Analysis, Insights and Forecast - by Type
- 10. Middle East and Africa n-Hexane Market Analysis, Insights and Forecast, 2019-2031
- 10.1. Market Analysis, Insights and Forecast - by Type
- 10.1.1. n-Hexane
- 10.1.2. Isohexane
- 10.1.3. Neohexane
- 10.2. Market Analysis, Insights and Forecast - by Grade
- 10.2.1. Polymer Grade
- 10.2.2. Food Grade
- 10.2.3. Other Grades
- 10.3. Market Analysis, Insights and Forecast - by Application
- 10.3.1. Industrial Solvents
- 10.3.2. Edible Oil Extractant
- 10.3.3. Cleansing and Degreasing
- 10.3.4. Other Ap
- 10.1. Market Analysis, Insights and Forecast - by Type
- 11. Competitive Analysis
- 11.1. Global Market Share Analysis 2024
- 11.2. Company Profiles
- 11.2.1 Bharat Petroleum Corporation Limited (BPCL)
- 11.2.1.1. Overview
- 11.2.1.2. Products
- 11.2.1.3. SWOT Analysis
- 11.2.1.4. Recent Developments
- 11.2.1.5. Financials (Based on Availability)
- 11.2.2 China Petrochemical Corporation (Sinopec)
- 11.2.2.1. Overview
- 11.2.2.2. Products
- 11.2.2.3. SWOT Analysis
- 11.2.2.4. Recent Developments
- 11.2.2.5. Financials (Based on Availability)
- 11.2.3 Exxon Mobil Corporation
- 11.2.3.1. Overview
- 11.2.3.2. Products
- 11.2.3.3. SWOT Analysis
- 11.2.3.4. Recent Developments
- 11.2.3.5. Financials (Based on Availability)
- 11.2.4 GFS Chemicals Inc
- 11.2.4.1. Overview
- 11.2.4.2. Products
- 11.2.4.3. SWOT Analysis
- 11.2.4.4. Recent Developments
- 11.2.4.5. Financials (Based on Availability)
- 11.2.5 Hindustan Petroleum Corporation Limited (HPCL)
- 11.2.5.1. Overview
- 11.2.5.2. Products
- 11.2.5.3. SWOT Analysis
- 11.2.5.4. Recent Developments
- 11.2.5.5. Financials (Based on Availability)
- 11.2.6 Indian Oil Corporation Ltd
- 11.2.6.1. Overview
- 11.2.6.2. Products
- 11.2.6.3. SWOT Analysis
- 11.2.6.4. Recent Developments
- 11.2.6.5. Financials (Based on Availability)
- 11.2.7 Jun Yuan Petroleum Group
- 11.2.7.1. Overview
- 11.2.7.2. Products
- 11.2.7.3. SWOT Analysis
- 11.2.7.4. Recent Developments
- 11.2.7.5. Financials (Based on Availability)
- 11.2.8 Liaoning Yufeng Chemical Co Ltd
- 11.2.8.1. Overview
- 11.2.8.2. Products
- 11.2.8.3. SWOT Analysis
- 11.2.8.4. Recent Developments
- 11.2.8.5. Financials (Based on Availability)
- 11.2.9 Phillips 66 Company
- 11.2.9.1. Overview
- 11.2.9.2. Products
- 11.2.9.3. SWOT Analysis
- 11.2.9.4. Recent Developments
- 11.2.9.5. Financials (Based on Availability)
- 11.2.10 Rompetrol
- 11.2.10.1. Overview
- 11.2.10.2. Products
- 11.2.10.3. SWOT Analysis
- 11.2.10.4. Recent Developments
- 11.2.10.5. Financials (Based on Availability)
- 11.2.11 Shell plc
- 11.2.11.1. Overview
- 11.2.11.2. Products
- 11.2.11.3. SWOT Analysis
- 11.2.11.4. Recent Developments
- 11.2.11.5. Financials (Based on Availability)
- 11.2.12 Shenyang Huifeng Petrochemical Co Ltd
- 11.2.12.1. Overview
- 11.2.12.2. Products
- 11.2.12.3. SWOT Analysis
- 11.2.12.4. Recent Developments
- 11.2.12.5. Financials (Based on Availability)
- 11.2.13 Sumitomo Chemical Co Ltd
- 11.2.13.1. Overview
- 11.2.13.2. Products
- 11.2.13.3. SWOT Analysis
- 11.2.13.4. Recent Developments
- 11.2.13.5. Financials (Based on Availability)
- 11.2.14 THAI OIL GROUP*List Not Exhaustive
- 11.2.14.1. Overview
- 11.2.14.2. Products
- 11.2.14.3. SWOT Analysis
- 11.2.14.4. Recent Developments
- 11.2.14.5. Financials (Based on Availability)
- 11.2.1 Bharat Petroleum Corporation Limited (BPCL)
List of Figures
- Figure 1: Global n-Hexane Market Revenue Breakdown (Million, %) by Region 2024 & 2032
- Figure 2: Global n-Hexane Market Volume Breakdown (Billion, %) by Region 2024 & 2032
- Figure 3: Asia Pacific n-Hexane Market Revenue (Million), by Type 2024 & 2032
- Figure 4: Asia Pacific n-Hexane Market Volume (Billion), by Type 2024 & 2032
- Figure 5: Asia Pacific n-Hexane Market Revenue Share (%), by Type 2024 & 2032
- Figure 6: Asia Pacific n-Hexane Market Volume Share (%), by Type 2024 & 2032
- Figure 7: Asia Pacific n-Hexane Market Revenue (Million), by Grade 2024 & 2032
- Figure 8: Asia Pacific n-Hexane Market Volume (Billion), by Grade 2024 & 2032
- Figure 9: Asia Pacific n-Hexane Market Revenue Share (%), by Grade 2024 & 2032
- Figure 10: Asia Pacific n-Hexane Market Volume Share (%), by Grade 2024 & 2032
- Figure 11: Asia Pacific n-Hexane Market Revenue (Million), by Application 2024 & 2032
- Figure 12: Asia Pacific n-Hexane Market Volume (Billion), by Application 2024 & 2032
- Figure 13: Asia Pacific n-Hexane Market Revenue Share (%), by Application 2024 & 2032
- Figure 14: Asia Pacific n-Hexane Market Volume Share (%), by Application 2024 & 2032
- Figure 15: Asia Pacific n-Hexane Market Revenue (Million), by Country 2024 & 2032
- Figure 16: Asia Pacific n-Hexane Market Volume (Billion), by Country 2024 & 2032
- Figure 17: Asia Pacific n-Hexane Market Revenue Share (%), by Country 2024 & 2032
- Figure 18: Asia Pacific n-Hexane Market Volume Share (%), by Country 2024 & 2032
- Figure 19: North America n-Hexane Market Revenue (Million), by Type 2024 & 2032
- Figure 20: North America n-Hexane Market Volume (Billion), by Type 2024 & 2032
- Figure 21: North America n-Hexane Market Revenue Share (%), by Type 2024 & 2032
- Figure 22: North America n-Hexane Market Volume Share (%), by Type 2024 & 2032
- Figure 23: North America n-Hexane Market Revenue (Million), by Grade 2024 & 2032
- Figure 24: North America n-Hexane Market Volume (Billion), by Grade 2024 & 2032
- Figure 25: North America n-Hexane Market Revenue Share (%), by Grade 2024 & 2032
- Figure 26: North America n-Hexane Market Volume Share (%), by Grade 2024 & 2032
- Figure 27: North America n-Hexane Market Revenue (Million), by Application 2024 & 2032
- Figure 28: North America n-Hexane Market Volume (Billion), by Application 2024 & 2032
- Figure 29: North America n-Hexane Market Revenue Share (%), by Application 2024 & 2032
- Figure 30: North America n-Hexane Market Volume Share (%), by Application 2024 & 2032
- Figure 31: North America n-Hexane Market Revenue (Million), by Country 2024 & 2032
- Figure 32: North America n-Hexane Market Volume (Billion), by Country 2024 & 2032
- Figure 33: North America n-Hexane Market Revenue Share (%), by Country 2024 & 2032
- Figure 34: North America n-Hexane Market Volume Share (%), by Country 2024 & 2032
- Figure 35: Europe n-Hexane Market Revenue (Million), by Type 2024 & 2032
- Figure 36: Europe n-Hexane Market Volume (Billion), by Type 2024 & 2032
- Figure 37: Europe n-Hexane Market Revenue Share (%), by Type 2024 & 2032
- Figure 38: Europe n-Hexane Market Volume Share (%), by Type 2024 & 2032
- Figure 39: Europe n-Hexane Market Revenue (Million), by Grade 2024 & 2032
- Figure 40: Europe n-Hexane Market Volume (Billion), by Grade 2024 & 2032
- Figure 41: Europe n-Hexane Market Revenue Share (%), by Grade 2024 & 2032
- Figure 42: Europe n-Hexane Market Volume Share (%), by Grade 2024 & 2032
- Figure 43: Europe n-Hexane Market Revenue (Million), by Application 2024 & 2032
- Figure 44: Europe n-Hexane Market Volume (Billion), by Application 2024 & 2032
- Figure 45: Europe n-Hexane Market Revenue Share (%), by Application 2024 & 2032
- Figure 46: Europe n-Hexane Market Volume Share (%), by Application 2024 & 2032
- Figure 47: Europe n-Hexane Market Revenue (Million), by Country 2024 & 2032
- Figure 48: Europe n-Hexane Market Volume (Billion), by Country 2024 & 2032
- Figure 49: Europe n-Hexane Market Revenue Share (%), by Country 2024 & 2032
- Figure 50: Europe n-Hexane Market Volume Share (%), by Country 2024 & 2032
- Figure 51: South America n-Hexane Market Revenue (Million), by Type 2024 & 2032
- Figure 52: South America n-Hexane Market Volume (Billion), by Type 2024 & 2032
- Figure 53: South America n-Hexane Market Revenue Share (%), by Type 2024 & 2032
- Figure 54: South America n-Hexane Market Volume Share (%), by Type 2024 & 2032
- Figure 55: South America n-Hexane Market Revenue (Million), by Grade 2024 & 2032
- Figure 56: South America n-Hexane Market Volume (Billion), by Grade 2024 & 2032
- Figure 57: South America n-Hexane Market Revenue Share (%), by Grade 2024 & 2032
- Figure 58: South America n-Hexane Market Volume Share (%), by Grade 2024 & 2032
- Figure 59: South America n-Hexane Market Revenue (Million), by Application 2024 & 2032
- Figure 60: South America n-Hexane Market Volume (Billion), by Application 2024 & 2032
- Figure 61: South America n-Hexane Market Revenue Share (%), by Application 2024 & 2032
- Figure 62: South America n-Hexane Market Volume Share (%), by Application 2024 & 2032
- Figure 63: South America n-Hexane Market Revenue (Million), by Country 2024 & 2032
- Figure 64: South America n-Hexane Market Volume (Billion), by Country 2024 & 2032
- Figure 65: South America n-Hexane Market Revenue Share (%), by Country 2024 & 2032
- Figure 66: South America n-Hexane Market Volume Share (%), by Country 2024 & 2032
- Figure 67: Middle East and Africa n-Hexane Market Revenue (Million), by Type 2024 & 2032
- Figure 68: Middle East and Africa n-Hexane Market Volume (Billion), by Type 2024 & 2032
- Figure 69: Middle East and Africa n-Hexane Market Revenue Share (%), by Type 2024 & 2032
- Figure 70: Middle East and Africa n-Hexane Market Volume Share (%), by Type 2024 & 2032
- Figure 71: Middle East and Africa n-Hexane Market Revenue (Million), by Grade 2024 & 2032
- Figure 72: Middle East and Africa n-Hexane Market Volume (Billion), by Grade 2024 & 2032
- Figure 73: Middle East and Africa n-Hexane Market Revenue Share (%), by Grade 2024 & 2032
- Figure 74: Middle East and Africa n-Hexane Market Volume Share (%), by Grade 2024 & 2032
- Figure 75: Middle East and Africa n-Hexane Market Revenue (Million), by Application 2024 & 2032
- Figure 76: Middle East and Africa n-Hexane Market Volume (Billion), by Application 2024 & 2032
- Figure 77: Middle East and Africa n-Hexane Market Revenue Share (%), by Application 2024 & 2032
- Figure 78: Middle East and Africa n-Hexane Market Volume Share (%), by Application 2024 & 2032
- Figure 79: Middle East and Africa n-Hexane Market Revenue (Million), by Country 2024 & 2032
- Figure 80: Middle East and Africa n-Hexane Market Volume (Billion), by Country 2024 & 2032
- Figure 81: Middle East and Africa n-Hexane Market Revenue Share (%), by Country 2024 & 2032
- Figure 82: Middle East and Africa n-Hexane Market Volume Share (%), by Country 2024 & 2032
List of Tables
- Table 1: Global n-Hexane Market Revenue Million Forecast, by Region 2019 & 2032
- Table 2: Global n-Hexane Market Volume Billion Forecast, by Region 2019 & 2032
- Table 3: Global n-Hexane Market Revenue Million Forecast, by Type 2019 & 2032
- Table 4: Global n-Hexane Market Volume Billion Forecast, by Type 2019 & 2032
- Table 5: Global n-Hexane Market Revenue Million Forecast, by Grade 2019 & 2032
- Table 6: Global n-Hexane Market Volume Billion Forecast, by Grade 2019 & 2032
- Table 7: Global n-Hexane Market Revenue Million Forecast, by Application 2019 & 2032
- Table 8: Global n-Hexane Market Volume Billion Forecast, by Application 2019 & 2032
- Table 9: Global n-Hexane Market Revenue Million Forecast, by Region 2019 & 2032
- Table 10: Global n-Hexane Market Volume Billion Forecast, by Region 2019 & 2032
- Table 11: Global n-Hexane Market Revenue Million Forecast, by Type 2019 & 2032
- Table 12: Global n-Hexane Market Volume Billion Forecast, by Type 2019 & 2032
- Table 13: Global n-Hexane Market Revenue Million Forecast, by Grade 2019 & 2032
- Table 14: Global n-Hexane Market Volume Billion Forecast, by Grade 2019 & 2032
- Table 15: Global n-Hexane Market Revenue Million Forecast, by Application 2019 & 2032
- Table 16: Global n-Hexane Market Volume Billion Forecast, by Application 2019 & 2032
- Table 17: Global n-Hexane Market Revenue Million Forecast, by Country 2019 & 2032
- Table 18: Global n-Hexane Market Volume Billion Forecast, by Country 2019 & 2032
- Table 19: China n-Hexane Market Revenue (Million) Forecast, by Application 2019 & 2032
- Table 20: China n-Hexane Market Volume (Billion) Forecast, by Application 2019 & 2032
- Table 21: India n-Hexane Market Revenue (Million) Forecast, by Application 2019 & 2032
- Table 22: India n-Hexane Market Volume (Billion) Forecast, by Application 2019 & 2032
- Table 23: Japan n-Hexane Market Revenue (Million) Forecast, by Application 2019 & 2032
- Table 24: Japan n-Hexane Market Volume (Billion) Forecast, by Application 2019 & 2032
- Table 25: South Korea n-Hexane Market Revenue (Million) Forecast, by Application 2019 & 2032
- Table 26: South Korea n-Hexane Market Volume (Billion) Forecast, by Application 2019 & 2032
- Table 27: Malaysia n-Hexane Market Revenue (Million) Forecast, by Application 2019 & 2032
- Table 28: Malaysia n-Hexane Market Volume (Billion) Forecast, by Application 2019 & 2032
- Table 29: Thailand n-Hexane Market Revenue (Million) Forecast, by Application 2019 & 2032
- Table 30: Thailand n-Hexane Market Volume (Billion) Forecast, by Application 2019 & 2032
- Table 31: Indonesia n-Hexane Market Revenue (Million) Forecast, by Application 2019 & 2032
- Table 32: Indonesia n-Hexane Market Volume (Billion) Forecast, by Application 2019 & 2032
- Table 33: Vietnam n-Hexane Market Revenue (Million) Forecast, by Application 2019 & 2032
- Table 34: Vietnam n-Hexane Market Volume (Billion) Forecast, by Application 2019 & 2032
- Table 35: Rest of Asia Pacific n-Hexane Market Revenue (Million) Forecast, by Application 2019 & 2032
- Table 36: Rest of Asia Pacific n-Hexane Market Volume (Billion) Forecast, by Application 2019 & 2032
- Table 37: Global n-Hexane Market Revenue Million Forecast, by Type 2019 & 2032
- Table 38: Global n-Hexane Market Volume Billion Forecast, by Type 2019 & 2032
- Table 39: Global n-Hexane Market Revenue Million Forecast, by Grade 2019 & 2032
- Table 40: Global n-Hexane Market Volume Billion Forecast, by Grade 2019 & 2032
- Table 41: Global n-Hexane Market Revenue Million Forecast, by Application 2019 & 2032
- Table 42: Global n-Hexane Market Volume Billion Forecast, by Application 2019 & 2032
- Table 43: Global n-Hexane Market Revenue Million Forecast, by Country 2019 & 2032
- Table 44: Global n-Hexane Market Volume Billion Forecast, by Country 2019 & 2032
- Table 45: United States n-Hexane Market Revenue (Million) Forecast, by Application 2019 & 2032
- Table 46: United States n-Hexane Market Volume (Billion) Forecast, by Application 2019 & 2032
- Table 47: Canada n-Hexane Market Revenue (Million) Forecast, by Application 2019 & 2032
- Table 48: Canada n-Hexane Market Volume (Billion) Forecast, by Application 2019 & 2032
- Table 49: Mexico n-Hexane Market Revenue (Million) Forecast, by Application 2019 & 2032
- Table 50: Mexico n-Hexane Market Volume (Billion) Forecast, by Application 2019 & 2032
- Table 51: Global n-Hexane Market Revenue Million Forecast, by Type 2019 & 2032
- Table 52: Global n-Hexane Market Volume Billion Forecast, by Type 2019 & 2032
- Table 53: Global n-Hexane Market Revenue Million Forecast, by Grade 2019 & 2032
- Table 54: Global n-Hexane Market Volume Billion Forecast, by Grade 2019 & 2032
- Table 55: Global n-Hexane Market Revenue Million Forecast, by Application 2019 & 2032
- Table 56: Global n-Hexane Market Volume Billion Forecast, by Application 2019 & 2032
- Table 57: Global n-Hexane Market Revenue Million Forecast, by Country 2019 & 2032
- Table 58: Global n-Hexane Market Volume Billion Forecast, by Country 2019 & 2032
- Table 59: Germany n-Hexane Market Revenue (Million) Forecast, by Application 2019 & 2032
- Table 60: Germany n-Hexane Market Volume (Billion) Forecast, by Application 2019 & 2032
- Table 61: United Kingdom n-Hexane Market Revenue (Million) Forecast, by Application 2019 & 2032
- Table 62: United Kingdom n-Hexane Market Volume (Billion) Forecast, by Application 2019 & 2032
- Table 63: Italy n-Hexane Market Revenue (Million) Forecast, by Application 2019 & 2032
- Table 64: Italy n-Hexane Market Volume (Billion) Forecast, by Application 2019 & 2032
- Table 65: France n-Hexane Market Revenue (Million) Forecast, by Application 2019 & 2032
- Table 66: France n-Hexane Market Volume (Billion) Forecast, by Application 2019 & 2032
- Table 67: Spain n-Hexane Market Revenue (Million) Forecast, by Application 2019 & 2032
- Table 68: Spain n-Hexane Market Volume (Billion) Forecast, by Application 2019 & 2032
- Table 69: NORDIC n-Hexane Market Revenue (Million) Forecast, by Application 2019 & 2032
- Table 70: NORDIC n-Hexane Market Volume (Billion) Forecast, by Application 2019 & 2032
- Table 71: Turkey n-Hexane Market Revenue (Million) Forecast, by Application 2019 & 2032
- Table 72: Turkey n-Hexane Market Volume (Billion) Forecast, by Application 2019 & 2032
- Table 73: Russia n-Hexane Market Revenue (Million) Forecast, by Application 2019 & 2032
- Table 74: Russia n-Hexane Market Volume (Billion) Forecast, by Application 2019 & 2032
- Table 75: Rest of Europe n-Hexane Market Revenue (Million) Forecast, by Application 2019 & 2032
- Table 76: Rest of Europe n-Hexane Market Volume (Billion) Forecast, by Application 2019 & 2032
- Table 77: Global n-Hexane Market Revenue Million Forecast, by Type 2019 & 2032
- Table 78: Global n-Hexane Market Volume Billion Forecast, by Type 2019 & 2032
- Table 79: Global n-Hexane Market Revenue Million Forecast, by Grade 2019 & 2032
- Table 80: Global n-Hexane Market Volume Billion Forecast, by Grade 2019 & 2032
- Table 81: Global n-Hexane Market Revenue Million Forecast, by Application 2019 & 2032
- Table 82: Global n-Hexane Market Volume Billion Forecast, by Application 2019 & 2032
- Table 83: Global n-Hexane Market Revenue Million Forecast, by Country 2019 & 2032
- Table 84: Global n-Hexane Market Volume Billion Forecast, by Country 2019 & 2032
- Table 85: Brazil n-Hexane Market Revenue (Million) Forecast, by Application 2019 & 2032
- Table 86: Brazil n-Hexane Market Volume (Billion) Forecast, by Application 2019 & 2032
- Table 87: Argentina n-Hexane Market Revenue (Million) Forecast, by Application 2019 & 2032
- Table 88: Argentina n-Hexane Market Volume (Billion) Forecast, by Application 2019 & 2032
- Table 89: Colombia n-Hexane Market Revenue (Million) Forecast, by Application 2019 & 2032
- Table 90: Colombia n-Hexane Market Volume (Billion) Forecast, by Application 2019 & 2032
- Table 91: Rest of South America n-Hexane Market Revenue (Million) Forecast, by Application 2019 & 2032
- Table 92: Rest of South America n-Hexane Market Volume (Billion) Forecast, by Application 2019 & 2032
- Table 93: Global n-Hexane Market Revenue Million Forecast, by Type 2019 & 2032
- Table 94: Global n-Hexane Market Volume Billion Forecast, by Type 2019 & 2032
- Table 95: Global n-Hexane Market Revenue Million Forecast, by Grade 2019 & 2032
- Table 96: Global n-Hexane Market Volume Billion Forecast, by Grade 2019 & 2032
- Table 97: Global n-Hexane Market Revenue Million Forecast, by Application 2019 & 2032
- Table 98: Global n-Hexane Market Volume Billion Forecast, by Application 2019 & 2032
- Table 99: Global n-Hexane Market Revenue Million Forecast, by Country 2019 & 2032
- Table 100: Global n-Hexane Market Volume Billion Forecast, by Country 2019 & 2032
- Table 101: Saudi Arabia n-Hexane Market Revenue (Million) Forecast, by Application 2019 & 2032
- Table 102: Saudi Arabia n-Hexane Market Volume (Billion) Forecast, by Application 2019 & 2032
- Table 103: South Africa n-Hexane Market Revenue (Million) Forecast, by Application 2019 & 2032
- Table 104: South Africa n-Hexane Market Volume (Billion) Forecast, by Application 2019 & 2032
- Table 105: Nigeria n-Hexane Market Revenue (Million) Forecast, by Application 2019 & 2032
- Table 106: Nigeria n-Hexane Market Volume (Billion) Forecast, by Application 2019 & 2032
- Table 107: Qatar n-Hexane Market Revenue (Million) Forecast, by Application 2019 & 2032
- Table 108: Qatar n-Hexane Market Volume (Billion) Forecast, by Application 2019 & 2032
- Table 109: Egypt n-Hexane Market Revenue (Million) Forecast, by Application 2019 & 2032
- Table 110: Egypt n-Hexane Market Volume (Billion) Forecast, by Application 2019 & 2032
- Table 111: United Arab Emirates n-Hexane Market Revenue (Million) Forecast, by Application 2019 & 2032
- Table 112: United Arab Emirates n-Hexane Market Volume (Billion) Forecast, by Application 2019 & 2032
- Table 113: Rest of Middle East and Africa n-Hexane Market Revenue (Million) Forecast, by Application 2019 & 2032
- Table 114: Rest of Middle East and Africa n-Hexane Market Volume (Billion) Forecast, by Application 2019 & 2032
Frequently Asked Questions
1. What is the projected Compound Annual Growth Rate (CAGR) of the n-Hexane Market?
The projected CAGR is approximately 4.57%.
2. Which companies are prominent players in the n-Hexane Market?
Key companies in the market include Bharat Petroleum Corporation Limited (BPCL), China Petrochemical Corporation (Sinopec), Exxon Mobil Corporation, GFS Chemicals Inc, Hindustan Petroleum Corporation Limited (HPCL), Indian Oil Corporation Ltd, Jun Yuan Petroleum Group, Liaoning Yufeng Chemical Co Ltd, Phillips 66 Company, Rompetrol, Shell plc, Shenyang Huifeng Petrochemical Co Ltd, Sumitomo Chemical Co Ltd, THAI OIL GROUP*List Not Exhaustive.
3. What are the main segments of the n-Hexane Market?
The market segments include Type, Grade, Application.
4. Can you provide details about the market size?
The market size is estimated to be USD 2.24 Million as of 2022.
5. What are some drivers contributing to market growth?
Growing Demand from Petrochemical Industries; Increasing Demand for Edible Oil Extraction; Other Drivers.
6. What are the notable trends driving market growth?
Edible Oil Extraction to Dominate the Market.
7. Are there any restraints impacting market growth?
Growing Demand from Petrochemical Industries; Increasing Demand for Edible Oil Extraction; Other Drivers.
8. Can you provide examples of recent developments in the market?
March 2022: Phillips 66 announced its merger with Phillips 66 Partners. The merger resulted in Phillips 66 acquiring all limited partnership interests in PSXP not already owned by Phillips 66 and its affiliates.
9. What pricing options are available for accessing the report?
Pricing options include single-user, multi-user, and enterprise licenses priced at USD 4750, USD 5250, and USD 8750 respectively.
10. Is the market size provided in terms of value or volume?
The market size is provided in terms of value, measured in Million and volume, measured in Billion.
11. Are there any specific market keywords associated with the report?
Yes, the market keyword associated with the report is "n-Hexane Market," which aids in identifying and referencing the specific market segment covered.
12. How do I determine which pricing option suits my needs best?
The pricing options vary based on user requirements and access needs. Individual users may opt for single-user licenses, while businesses requiring broader access may choose multi-user or enterprise licenses for cost-effective access to the report.
13. Are there any additional resources or data provided in the n-Hexane Market report?
While the report offers comprehensive insights, it's advisable to review the specific contents or supplementary materials provided to ascertain if additional resources or data are available.
14. How can I stay updated on further developments or reports in the n-Hexane Market?
To stay informed about further developments, trends, and reports in the n-Hexane Market, consider subscribing to industry newsletters, following relevant companies and organizations, or regularly checking reputable industry news sources and publications.
Methodology
Step 1 - Identification of Relevant Samples Size from Population Database


Step 2 - Approaches for Defining Global Market Size (Value, Volume* & Price*)

Note*: In applicable scenarios
Step 3 - Data Sources
Primary Research
- Web Analytics
- Survey Reports
- Research Institute
- Latest Research Reports
- Opinion Leaders
Secondary Research
- Annual Reports
- White Paper
- Latest Press Release
- Industry Association
- Paid Database
- Investor Presentations

Step 4 - Data Triangulation
Involves using different sources of information in order to increase the validity of a study
These sources are likely to be stakeholders in a program - participants, other researchers, program staff, other community members, and so on.
Then we put all data in single framework & apply various statistical tools to find out the dynamic on the market.
During the analysis stage, feedback from the stakeholder groups would be compared to determine areas of agreement as well as areas of divergence


