

Key Insights
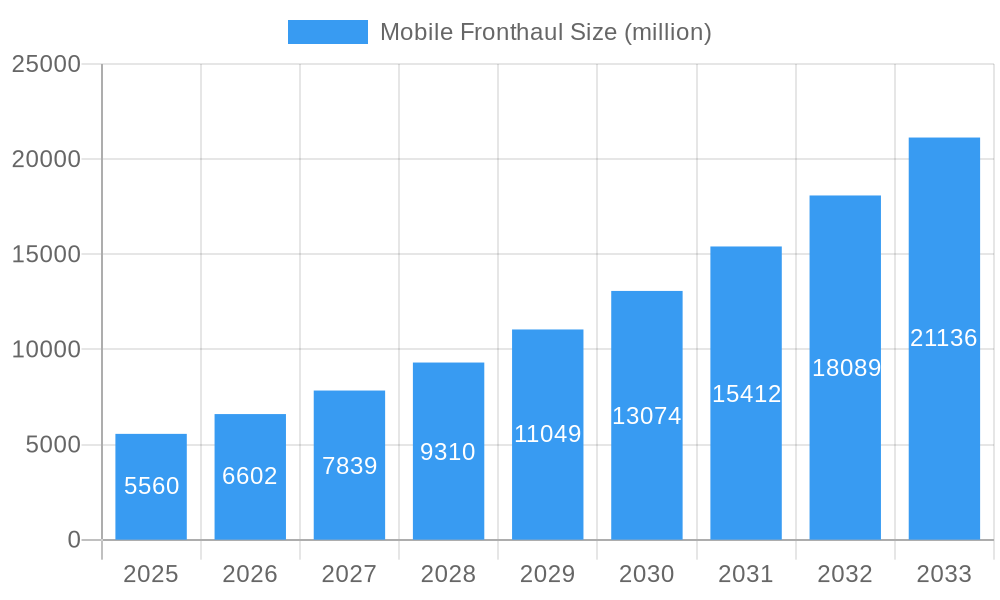
The global Mobile Fronthaul market is poised for significant expansion, with a projected market size of $5560 million. This robust growth is underpinned by an impressive Compound Annual Growth Rate (CAGR) of 18.8%, indicating substantial investment and increasing adoption of advanced mobile network infrastructure. The burgeoning demand for higher data speeds, increased capacity, and the proliferation of 5G and future mobile technologies are the primary catalysts for this market surge. Key drivers include the continuous evolution of mobile network architectures, such as the increasing deployment of C-RAN (Centralized Radio Access Network) and O-RAN (Open Radio Access Network) which necessitate more sophisticated and efficient fronthaul solutions. These advancements are crucial for enabling features like low latency, massive MIMO, and network slicing, all vital for next-generation mobile services and an enhanced user experience. The market is witnessing a strategic shift towards more intelligent and flexible fronthaul systems, facilitating easier network management and cost optimization for telecom operators.
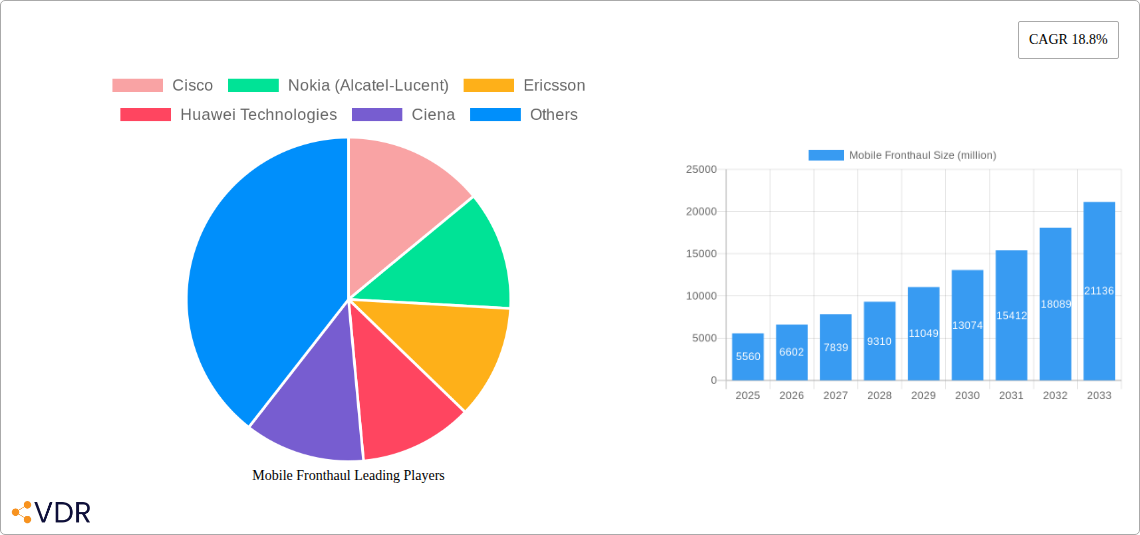
Mobile Fronthaul Market Size (In Billion)
The market segmentation reveals a dynamic landscape, with the "Application" segment dominated by C-RAN and O-RAN, reflecting the industry's pivot towards these flexible and open network architectures. The "Types" segment, encompassing Fronthaul Semi-active, Passive, and Active Systems, showcases innovation in providing tailored solutions to meet diverse network deployment needs. While the market is experiencing strong tailwinds, potential restraints might emerge from the significant upfront investment required for infrastructure upgrades and the complex integration challenges with existing legacy systems. However, ongoing technological advancements in fiber optics, cost reductions in active components, and the strategic focus of major players like Cisco, Nokia, Ericsson, and Huawei are expected to mitigate these challenges. The extensive geographical reach, encompassing North America, Europe, Asia Pacific, South America, and the Middle East & Africa, indicates a global appetite for improved mobile connectivity, with the Asia Pacific region likely to be a key growth engine due to rapid 5G rollout and increasing smartphone penetration.
Mobile Fronthaul Company Market Share
This in-depth report provides a definitive analysis of the global mobile fronthaul market, forecasting robust growth and evolving dynamics from 2019 to 2033, with a base year of 2025. With the exponential increase in mobile data traffic driven by 5G deployments and the growing adoption of C-RAN and O-RAN architectures, the mobile fronthaul sector is poised for significant expansion. This report is an essential resource for telecom operators, equipment manufacturers, technology providers, and investors seeking to understand the intricate market structure, growth trajectories, and strategic imperatives within this critical segment of the telecommunications infrastructure. We delve into market concentration, technological innovation, regulatory influences, competitive landscapes, and emerging opportunities, offering actionable insights for strategic decision-making.
Mobile Fronthaul Market Dynamics & Structure
The global mobile fronthaul market is characterized by a dynamic and moderately concentrated structure, with a few major players dominating a significant portion of the market share. Technological innovation serves as a primary driver, fueled by the relentless pursuit of higher bandwidth, lower latency, and increased efficiency in mobile network deployments. The evolution of 5G and the nascent stages of 6G development necessitate advanced fronthaul solutions capable of supporting the massive data volumes and ultra-low latency requirements. Regulatory frameworks, while generally supportive of infrastructure development, can introduce complexities related to spectrum allocation and deployment standards, impacting market entry and expansion. Competitive product substitutes, such as direct fiber deployments or evolving backhaul solutions, are closely monitored, although the dedicated nature of fronthaul links offers distinct advantages. End-user demographics are shifting, with an increasing demand for enhanced mobile broadband (eMBB), massive machine-type communications (mMTC), and ultra-reliable low-latency communications (URLLC) driving the need for more sophisticated fronthaul. Mergers and acquisitions (M&A) play a crucial role in market consolidation and talent acquisition, with key players strategically acquiring smaller innovators to enhance their technology portfolios and expand their market reach.
- Market Concentration: Dominated by a blend of established telecom equipment giants and specialized fronthaul solution providers.
- Technological Innovation Drivers: 5G/6G deployment mandates, virtualization of network functions (VNF), and the need for flexible, scalable infrastructure.
- Regulatory Frameworks: Evolving standards for fiber deployment, spectrum utilization, and network security.
- Competitive Product Substitutes: While fronthaul is a distinct segment, advancements in passive optical networks (PON) and other high-capacity backhaul solutions are considered.
- End-User Demographics: Increased demand from enterprises, IoT applications, and enhanced consumer mobile experiences.
- M&A Trends: Strategic acquisitions to consolidate market share, acquire intellectual property, and expand service offerings.
Mobile Fronthaul Growth Trends & Insights
The mobile fronthaul market is experiencing an accelerated growth trajectory, projected to witness a significant compound annual growth rate (CAGR) during the forecast period of 2025–2033. This expansion is primarily fueled by the global rollout of 5G networks, which inherently require a more robust and high-capacity fronthaul infrastructure compared to previous generations. The migration towards centralized RAN (C-RAN) and Open RAN (O-RAN) architectures, designed for greater flexibility, cost-efficiency, and vendor interoperability, further amplifies the demand for advanced fronthaul solutions. These architectural shifts necessitate efficient data transmission between the Remote Radio Heads (RRHs) and the baseband units (BBUs), making fronthaul a critical enabler.
The adoption rate of advanced fronthaul technologies is steadily increasing as telecom operators prioritize network modernization to meet the ever-growing mobile data consumption. The proliferation of smart devices, the burgeoning Internet of Things (IoT) ecosystem, and the demand for immersive experiences like augmented reality (AR) and virtual reality (VR) are all contributing to the surge in data traffic, placing immense pressure on fronthaul capacities. Technological disruptions, such as the advancements in fiber optics, optical networking, and synchronization technologies, are continuously enhancing the performance and cost-effectiveness of fronthaul solutions.
Consumer behavior is also indirectly influencing market growth. The increasing reliance on mobile connectivity for work, entertainment, and communication necessitates reliable and high-speed access, pushing operators to invest in scalable infrastructure, including the fronthaul. This demand for enhanced mobile broadband experiences translates directly into a greater need for efficient and high-bandwidth fronthaul. The shift from traditional point-to-point fronthaul deployments to more flexible, scalable, and cost-effective solutions like passive and semi-active fronthaul systems is a notable trend. Furthermore, the increasing implementation of advanced features like dynamic bandwidth allocation and traffic management within fronthaul networks is crucial for optimizing network performance. The estimated market size for mobile fronthaul is projected to reach xx million units by 2025, with substantial growth anticipated in the coming years.
Dominant Regions, Countries, or Segments in Mobile Fronthaul
Asia-Pacific, particularly China, stands as a dominant region in the mobile fronthaul market, driven by its aggressive 5G network deployment initiatives, massive subscriber base, and government support for telecommunications infrastructure development. The region's commitment to building out extensive 5G networks, including the adoption of C-RAN and O-RAN architectures, places it at the forefront of fronthaul innovation and deployment. China's leading telecom operators are investing heavily in upgrading their existing infrastructure and deploying new fronthaul solutions to support the increasing demand for mobile data and advanced services.
Within the application segment, O-RAN is emerging as a significant growth driver. The O-RAN alliance's focus on open interfaces and interoperability among different vendors is fostering a more competitive and innovative fronthaul ecosystem. This shift is compelling operators to adopt flexible fronthaul solutions that can accommodate a diverse range of equipment and software. While C-RAN remains a crucial application, the increasing momentum behind O-RAN signifies a future trend towards more disaggregated and intelligent network architectures.
In terms of types, Fronthaul Active Systems currently hold a significant market share due to their established performance and reliability in supporting high-bandwidth and low-latency requirements. However, Fronthaul Semi-active Systems are witnessing rapid growth, offering a compelling balance between performance, cost-efficiency, and scalability. These systems are increasingly favored for their ability to support diverse deployment scenarios and optimize resource utilization. The market penetration of Fronthaul Passive Systems is also expected to grow as technology matures and cost considerations become more critical for widespread deployments.
Key drivers of dominance in this region and these segments include:
- Aggressive 5G Rollouts: China's leadership in 5G deployment creates a massive demand for fronthaul.
- Government Support and Investment: Favorable policies and substantial public investment in telecommunications infrastructure.
- Technological Adoption: Early and widespread adoption of new technologies like O-RAN and advanced fiber optics.
- Large Subscriber Base: The sheer volume of mobile users necessitates robust and scalable network infrastructure.
- Emergence of O-RAN: The O-RAN ecosystem fosters innovation and drives demand for flexible fronthaul solutions.
- Cost-Effectiveness and Scalability: The increasing adoption of semi-active and passive fronthaul solutions driven by the need for economical and scalable deployments.
Mobile Fronthaul Product Landscape
The mobile fronthaul product landscape is characterized by continuous innovation aimed at enhancing bandwidth, reducing latency, and improving cost-effectiveness. Key product developments include advancements in high-speed optical transceivers, efficient wavelength division multiplexing (WDM) solutions, and robust synchronization technologies. These innovations are crucial for supporting the demanding requirements of 5G and future wireless generations. Products are designed to offer a range of options, from high-performance active systems for dense urban areas to more cost-optimized passive and semi-active systems for suburban and rural deployments. The emphasis is on modularity, flexibility, and seamless integration with existing network infrastructure, enabling telecom operators to adapt to evolving network demands and spectrum availability.
Key Drivers, Barriers & Challenges in Mobile Fronthaul
Key Drivers:
The primary forces propelling the mobile fronthaul market include the accelerating global deployment of 5G networks, which inherently demand higher bandwidth and lower latency fronthaul solutions. The increasing adoption of C-RAN and O-RAN architectures, aimed at network flexibility and cost optimization, is a significant catalyst. Furthermore, the burgeoning demand for enhanced mobile broadband (eMBB), massive machine-type communications (mMTC), and ultra-reliable low-latency communications (URLLC) applications is a strong growth stimulant. Technological advancements in fiber optics, optical networking equipment, and synchronization technologies also play a crucial role.
Barriers & Challenges:
Despite the robust growth, the mobile fronthaul market faces several challenges. High initial deployment costs for fiber infrastructure and specialized fronthaul equipment can be a significant barrier, particularly in less densely populated areas. Regulatory hurdles related to right-of-way acquisition and permitting processes can also lead to deployment delays. Supply chain disruptions and the availability of skilled labor for fiber installation and maintenance pose ongoing challenges. Intense competition among vendors can lead to price pressures, impacting profitability. Cybersecurity concerns related to the increased connectivity and data flow within fronthaul networks also require careful consideration and robust solutions. The estimated impact of these challenges on market growth is xx%.
Emerging Opportunities in Mobile Fronthaul
Emerging opportunities in the mobile fronthaul sector are closely tied to the evolution of wireless technologies and the increasing demand for advanced mobile services. The continued expansion of 5G, alongside the early research and development of 6G, presents a significant opportunity for next-generation fronthaul solutions with even higher capacities and lower latencies. The growth of private 5G networks for industrial applications, smart cities, and enterprise use cases opens up new markets for specialized fronthaul deployments. Furthermore, the increasing focus on edge computing and network densification creates a demand for distributed fronthaul solutions that can efficiently connect numerous small cells and distributed units. The integration of AI and machine learning into fronthaul network management for optimization and predictive maintenance offers further avenues for innovation.
Growth Accelerators in the Mobile Fronthaul Industry
Several factors are acting as growth accelerators for the mobile fronthaul industry. Technological breakthroughs, particularly in areas like advanced optical components and coherent optics, are enabling higher data transmission rates and longer reach, making fronthaul deployments more feasible and cost-effective. Strategic partnerships and collaborations between telecom operators, equipment manufacturers, and technology providers are crucial for driving innovation and accelerating the adoption of new solutions. Market expansion strategies, including the targeting of underserved regions and the development of tailored solutions for specific industry verticals, are also contributing to sustained growth. The increasing standardization efforts within the O-RAN ecosystem are fostering interoperability and reducing vendor lock-in, thereby encouraging broader adoption and investment.
Key Players Shaping the Mobile Fronthaul Market
- Cisco
- Nokia (Alcatel-Lucent)
- Ericsson
- Huawei Technologies
- Ciena
- Infinera
- LS Networks
- Fujitsu
- Omnitron Systems
- ZTE
- Visint Communication
- Sintai Communication
Notable Milestones in Mobile Fronthaul Sector
- 2019: Increased focus on fiber-to-the-antenna (FTTA) solutions to support early 5G trials.
- 2020: Growing interest and early development in C-RAN architectures for network efficiency.
- 2021: Initial deployments of O-RAN-compliant fronthaul solutions gain traction.
- 2022: Advancements in high-speed optical transceivers enable higher bandwidth fronthaul.
- 2023: Increased adoption of fronthaul solutions supporting dynamic spectrum sharing (DSS).
- 2024: Significant investment in passive and semi-active fronthaul technologies for cost optimization.
In-Depth Mobile Fronthaul Market Outlook
The future outlook for the mobile fronthaul market is exceptionally bright, driven by the sustained demand for high-performance mobile networks and the ongoing evolution of wireless technologies. Growth accelerators such as continued advancements in optical networking, the widespread adoption of O-RAN principles, and strategic market expansions will propel the industry forward. The increasing focus on enabling advanced mobile services like immersive AR/VR experiences and massive IoT deployments will necessitate further innovation and investment in fronthaul infrastructure. Telecom operators are expected to prioritize flexible, scalable, and cost-efficient fronthaul solutions to meet the escalating data traffic demands and ensure seamless connectivity across diverse geographical landscapes, securing a robust growth trajectory for the foreseeable future.
Mobile Fronthaul Segmentation
-
1. Application
- 1.1. C-RAN
- 1.2. O-RAN
- 1.3. Others
-
2. Types
- 2.1. Fronthaul Semi-active System
- 2.2. Fronthaul Passive System
- 2.3. Fronthaul Active System
Mobile Fronthaul Segmentation By Geography
-
1. North America
- 1.1. United States
- 1.2. Canada
- 1.3. Mexico
-
2. South America
- 2.1. Brazil
- 2.2. Argentina
- 2.3. Rest of South America
-
3. Europe
- 3.1. United Kingdom
- 3.2. Germany
- 3.3. France
- 3.4. Italy
- 3.5. Spain
- 3.6. Russia
- 3.7. Benelux
- 3.8. Nordics
- 3.9. Rest of Europe
-
4. Middle East & Africa
- 4.1. Turkey
- 4.2. Israel
- 4.3. GCC
- 4.4. North Africa
- 4.5. South Africa
- 4.6. Rest of Middle East & Africa
-
5. Asia Pacific
- 5.1. China
- 5.2. India
- 5.3. Japan
- 5.4. South Korea
- 5.5. ASEAN
- 5.6. Oceania
- 5.7. Rest of Asia Pacific
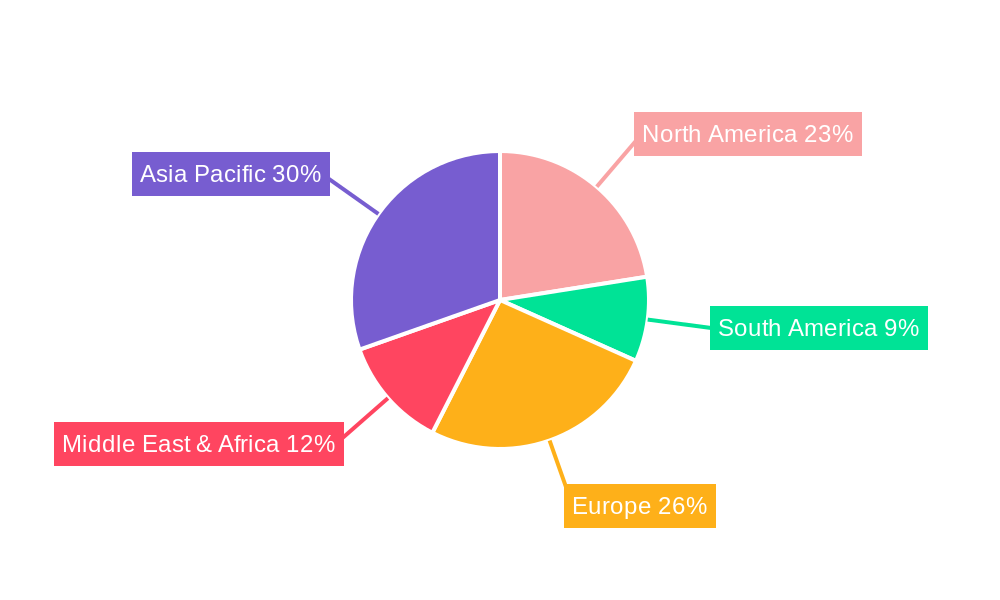
Mobile Fronthaul Regional Market Share
Geographic Coverage of Mobile Fronthaul
Mobile Fronthaul REPORT HIGHLIGHTS
| Aspects | Details |
|---|---|
| Study Period | 2020-2034 |
| Base Year | 2025 |
| Estimated Year | 2026 |
| Forecast Period | 2026-2034 |
| Historical Period | 2020-2025 |
| Growth Rate | CAGR of 18.8% from 2020-2034 |
| Segmentation |
|
Table of Contents
- 1. Introduction
- 1.1. Research Scope
- 1.2. Market Segmentation
- 1.3. Research Objective
- 1.4. Definitions and Assumptions
- 2. Executive Summary
- 2.1. Market Snapshot
- 3. Market Dynamics
- 3.1. Market Drivers
- 3.2. Market Restrains
- 3.3. Market Trends
- 3.4. Market Opportunities
- 4. Market Factor Analysis
- 4.1. Porters Five Forces
- 4.1.1. Bargaining Power of Suppliers
- 4.1.2. Bargaining Power of Buyers
- 4.1.3. Threat of New Entrants
- 4.1.4. Threat of Substitutes
- 4.1.5. Competitive Rivalry
- 4.2. PESTEL analysis
- 4.3. BCG Analysis
- 4.3.1. Stars (High Growth, High Market Share)
- 4.3.2. Cash Cows (Low Growth, High Market Share)
- 4.3.3. Question Mark (High Growth, Low Market Share)
- 4.3.4. Dogs (Low Growth, Low Market Share)
- 4.4. Ansoff Matrix Analysis
- 4.5. Supply Chain Analysis
- 4.6. Regulatory Landscape
- 4.7. Current Market Potential and Opportunity Assessment (TAM–SAM–SOM Framework)
- 4.8. VDR Analyst Note
- 4.1. Porters Five Forces
- 5. Market Analysis, Insights and Forecast 2021-2033
- 5.1. Market Analysis, Insights and Forecast - by Application
- 5.1.1. C-RAN
- 5.1.2. O-RAN
- 5.1.3. Others
- 5.2. Market Analysis, Insights and Forecast - by Types
- 5.2.1. Fronthaul Semi-active System
- 5.2.2. Fronthaul Passive System
- 5.2.3. Fronthaul Active System
- 5.3. Market Analysis, Insights and Forecast - by Region
- 5.3.1. North America
- 5.3.2. South America
- 5.3.3. Europe
- 5.3.4. Middle East & Africa
- 5.3.5. Asia Pacific
- 5.1. Market Analysis, Insights and Forecast - by Application
- 6. Global Mobile Fronthaul Analysis, Insights and Forecast, 2021-2033
- 6.1. Market Analysis, Insights and Forecast - by Application
- 6.1.1. C-RAN
- 6.1.2. O-RAN
- 6.1.3. Others
- 6.2. Market Analysis, Insights and Forecast - by Types
- 6.2.1. Fronthaul Semi-active System
- 6.2.2. Fronthaul Passive System
- 6.2.3. Fronthaul Active System
- 6.1. Market Analysis, Insights and Forecast - by Application
- 7. North America Mobile Fronthaul Analysis, Insights and Forecast, 2021-2033
- 7.1. Market Analysis, Insights and Forecast - by Application
- 7.1.1. C-RAN
- 7.1.2. O-RAN
- 7.1.3. Others
- 7.2. Market Analysis, Insights and Forecast - by Types
- 7.2.1. Fronthaul Semi-active System
- 7.2.2. Fronthaul Passive System
- 7.2.3. Fronthaul Active System
- 7.1. Market Analysis, Insights and Forecast - by Application
- 8. South America Mobile Fronthaul Analysis, Insights and Forecast, 2021-2033
- 8.1. Market Analysis, Insights and Forecast - by Application
- 8.1.1. C-RAN
- 8.1.2. O-RAN
- 8.1.3. Others
- 8.2. Market Analysis, Insights and Forecast - by Types
- 8.2.1. Fronthaul Semi-active System
- 8.2.2. Fronthaul Passive System
- 8.2.3. Fronthaul Active System
- 8.1. Market Analysis, Insights and Forecast - by Application
- 9. Europe Mobile Fronthaul Analysis, Insights and Forecast, 2021-2033
- 9.1. Market Analysis, Insights and Forecast - by Application
- 9.1.1. C-RAN
- 9.1.2. O-RAN
- 9.1.3. Others
- 9.2. Market Analysis, Insights and Forecast - by Types
- 9.2.1. Fronthaul Semi-active System
- 9.2.2. Fronthaul Passive System
- 9.2.3. Fronthaul Active System
- 9.1. Market Analysis, Insights and Forecast - by Application
- 10. Middle East & Africa Mobile Fronthaul Analysis, Insights and Forecast, 2021-2033
- 10.1. Market Analysis, Insights and Forecast - by Application
- 10.1.1. C-RAN
- 10.1.2. O-RAN
- 10.1.3. Others
- 10.2. Market Analysis, Insights and Forecast - by Types
- 10.2.1. Fronthaul Semi-active System
- 10.2.2. Fronthaul Passive System
- 10.2.3. Fronthaul Active System
- 10.1. Market Analysis, Insights and Forecast - by Application
- 11. Asia Pacific Mobile Fronthaul Analysis, Insights and Forecast, 2021-2033
- 11.1. Market Analysis, Insights and Forecast - by Application
- 11.1.1. C-RAN
- 11.1.2. O-RAN
- 11.1.3. Others
- 11.2. Market Analysis, Insights and Forecast - by Types
- 11.2.1. Fronthaul Semi-active System
- 11.2.2. Fronthaul Passive System
- 11.2.3. Fronthaul Active System
- 11.1. Market Analysis, Insights and Forecast - by Application
- 12. Competitive Analysis
- 12.1. Company Profiles
- 12.1.1 Cisco
- 12.1.1.1. Company Overview
- 12.1.1.2. Products
- 12.1.1.3. Company Financials
- 12.1.1.4. SWOT Analysis
- 12.1.2 Nokia (Alcatel-Lucent)
- 12.1.2.1. Company Overview
- 12.1.2.2. Products
- 12.1.2.3. Company Financials
- 12.1.2.4. SWOT Analysis
- 12.1.3 Ericsson
- 12.1.3.1. Company Overview
- 12.1.3.2. Products
- 12.1.3.3. Company Financials
- 12.1.3.4. SWOT Analysis
- 12.1.4 Huawei Technologies
- 12.1.4.1. Company Overview
- 12.1.4.2. Products
- 12.1.4.3. Company Financials
- 12.1.4.4. SWOT Analysis
- 12.1.5 Ciena
- 12.1.5.1. Company Overview
- 12.1.5.2. Products
- 12.1.5.3. Company Financials
- 12.1.5.4. SWOT Analysis
- 12.1.6 Infinera
- 12.1.6.1. Company Overview
- 12.1.6.2. Products
- 12.1.6.3. Company Financials
- 12.1.6.4. SWOT Analysis
- 12.1.7 LS Networks
- 12.1.7.1. Company Overview
- 12.1.7.2. Products
- 12.1.7.3. Company Financials
- 12.1.7.4. SWOT Analysis
- 12.1.8 Fujitsu
- 12.1.8.1. Company Overview
- 12.1.8.2. Products
- 12.1.8.3. Company Financials
- 12.1.8.4. SWOT Analysis
- 12.1.9 Omnitron Systems
- 12.1.9.1. Company Overview
- 12.1.9.2. Products
- 12.1.9.3. Company Financials
- 12.1.9.4. SWOT Analysis
- 12.1.10 ZTE
- 12.1.10.1. Company Overview
- 12.1.10.2. Products
- 12.1.10.3. Company Financials
- 12.1.10.4. SWOT Analysis
- 12.1.11 Visint Communication
- 12.1.11.1. Company Overview
- 12.1.11.2. Products
- 12.1.11.3. Company Financials
- 12.1.11.4. SWOT Analysis
- 12.1.12 Sintai Communication
- 12.1.12.1. Company Overview
- 12.1.12.2. Products
- 12.1.12.3. Company Financials
- 12.1.12.4. SWOT Analysis
- 12.1.1 Cisco
- 12.2. Market Entropy
- 12.2.1 Company's Key Areas Served
- 12.2.2 Recent Developments
- 12.3. Company Market Share Analysis 2025
- 12.3.1 Top 5 Companies Market Share Analysis
- 12.3.2 Top 3 Companies Market Share Analysis
- 12.4. List of Potential Customers
- 13. Research Methodology
List of Figures
- Figure 1: Global Mobile Fronthaul Revenue Breakdown (million, %) by Region 2025 & 2033
- Figure 2: North America Mobile Fronthaul Revenue (million), by Application 2025 & 2033
- Figure 3: North America Mobile Fronthaul Revenue Share (%), by Application 2025 & 2033
- Figure 4: North America Mobile Fronthaul Revenue (million), by Types 2025 & 2033
- Figure 5: North America Mobile Fronthaul Revenue Share (%), by Types 2025 & 2033
- Figure 6: North America Mobile Fronthaul Revenue (million), by Country 2025 & 2033
- Figure 7: North America Mobile Fronthaul Revenue Share (%), by Country 2025 & 2033
- Figure 8: South America Mobile Fronthaul Revenue (million), by Application 2025 & 2033
- Figure 9: South America Mobile Fronthaul Revenue Share (%), by Application 2025 & 2033
- Figure 10: South America Mobile Fronthaul Revenue (million), by Types 2025 & 2033
- Figure 11: South America Mobile Fronthaul Revenue Share (%), by Types 2025 & 2033
- Figure 12: South America Mobile Fronthaul Revenue (million), by Country 2025 & 2033
- Figure 13: South America Mobile Fronthaul Revenue Share (%), by Country 2025 & 2033
- Figure 14: Europe Mobile Fronthaul Revenue (million), by Application 2025 & 2033
- Figure 15: Europe Mobile Fronthaul Revenue Share (%), by Application 2025 & 2033
- Figure 16: Europe Mobile Fronthaul Revenue (million), by Types 2025 & 2033
- Figure 17: Europe Mobile Fronthaul Revenue Share (%), by Types 2025 & 2033
- Figure 18: Europe Mobile Fronthaul Revenue (million), by Country 2025 & 2033
- Figure 19: Europe Mobile Fronthaul Revenue Share (%), by Country 2025 & 2033
- Figure 20: Middle East & Africa Mobile Fronthaul Revenue (million), by Application 2025 & 2033
- Figure 21: Middle East & Africa Mobile Fronthaul Revenue Share (%), by Application 2025 & 2033
- Figure 22: Middle East & Africa Mobile Fronthaul Revenue (million), by Types 2025 & 2033
- Figure 23: Middle East & Africa Mobile Fronthaul Revenue Share (%), by Types 2025 & 2033
- Figure 24: Middle East & Africa Mobile Fronthaul Revenue (million), by Country 2025 & 2033
- Figure 25: Middle East & Africa Mobile Fronthaul Revenue Share (%), by Country 2025 & 2033
- Figure 26: Asia Pacific Mobile Fronthaul Revenue (million), by Application 2025 & 2033
- Figure 27: Asia Pacific Mobile Fronthaul Revenue Share (%), by Application 2025 & 2033
- Figure 28: Asia Pacific Mobile Fronthaul Revenue (million), by Types 2025 & 2033
- Figure 29: Asia Pacific Mobile Fronthaul Revenue Share (%), by Types 2025 & 2033
- Figure 30: Asia Pacific Mobile Fronthaul Revenue (million), by Country 2025 & 2033
- Figure 31: Asia Pacific Mobile Fronthaul Revenue Share (%), by Country 2025 & 2033
List of Tables
- Table 1: Global Mobile Fronthaul Revenue million Forecast, by Application 2020 & 2033
- Table 2: Global Mobile Fronthaul Revenue million Forecast, by Types 2020 & 2033
- Table 3: Global Mobile Fronthaul Revenue million Forecast, by Region 2020 & 2033
- Table 4: Global Mobile Fronthaul Revenue million Forecast, by Application 2020 & 2033
- Table 5: Global Mobile Fronthaul Revenue million Forecast, by Types 2020 & 2033
- Table 6: Global Mobile Fronthaul Revenue million Forecast, by Country 2020 & 2033
- Table 7: United States Mobile Fronthaul Revenue (million) Forecast, by Application 2020 & 2033
- Table 8: Canada Mobile Fronthaul Revenue (million) Forecast, by Application 2020 & 2033
- Table 9: Mexico Mobile Fronthaul Revenue (million) Forecast, by Application 2020 & 2033
- Table 10: Global Mobile Fronthaul Revenue million Forecast, by Application 2020 & 2033
- Table 11: Global Mobile Fronthaul Revenue million Forecast, by Types 2020 & 2033
- Table 12: Global Mobile Fronthaul Revenue million Forecast, by Country 2020 & 2033
- Table 13: Brazil Mobile Fronthaul Revenue (million) Forecast, by Application 2020 & 2033
- Table 14: Argentina Mobile Fronthaul Revenue (million) Forecast, by Application 2020 & 2033
- Table 15: Rest of South America Mobile Fronthaul Revenue (million) Forecast, by Application 2020 & 2033
- Table 16: Global Mobile Fronthaul Revenue million Forecast, by Application 2020 & 2033
- Table 17: Global Mobile Fronthaul Revenue million Forecast, by Types 2020 & 2033
- Table 18: Global Mobile Fronthaul Revenue million Forecast, by Country 2020 & 2033
- Table 19: United Kingdom Mobile Fronthaul Revenue (million) Forecast, by Application 2020 & 2033
- Table 20: Germany Mobile Fronthaul Revenue (million) Forecast, by Application 2020 & 2033
- Table 21: France Mobile Fronthaul Revenue (million) Forecast, by Application 2020 & 2033
- Table 22: Italy Mobile Fronthaul Revenue (million) Forecast, by Application 2020 & 2033
- Table 23: Spain Mobile Fronthaul Revenue (million) Forecast, by Application 2020 & 2033
- Table 24: Russia Mobile Fronthaul Revenue (million) Forecast, by Application 2020 & 2033
- Table 25: Benelux Mobile Fronthaul Revenue (million) Forecast, by Application 2020 & 2033
- Table 26: Nordics Mobile Fronthaul Revenue (million) Forecast, by Application 2020 & 2033
- Table 27: Rest of Europe Mobile Fronthaul Revenue (million) Forecast, by Application 2020 & 2033
- Table 28: Global Mobile Fronthaul Revenue million Forecast, by Application 2020 & 2033
- Table 29: Global Mobile Fronthaul Revenue million Forecast, by Types 2020 & 2033
- Table 30: Global Mobile Fronthaul Revenue million Forecast, by Country 2020 & 2033
- Table 31: Turkey Mobile Fronthaul Revenue (million) Forecast, by Application 2020 & 2033
- Table 32: Israel Mobile Fronthaul Revenue (million) Forecast, by Application 2020 & 2033
- Table 33: GCC Mobile Fronthaul Revenue (million) Forecast, by Application 2020 & 2033
- Table 34: North Africa Mobile Fronthaul Revenue (million) Forecast, by Application 2020 & 2033
- Table 35: South Africa Mobile Fronthaul Revenue (million) Forecast, by Application 2020 & 2033
- Table 36: Rest of Middle East & Africa Mobile Fronthaul Revenue (million) Forecast, by Application 2020 & 2033
- Table 37: Global Mobile Fronthaul Revenue million Forecast, by Application 2020 & 2033
- Table 38: Global Mobile Fronthaul Revenue million Forecast, by Types 2020 & 2033
- Table 39: Global Mobile Fronthaul Revenue million Forecast, by Country 2020 & 2033
- Table 40: China Mobile Fronthaul Revenue (million) Forecast, by Application 2020 & 2033
- Table 41: India Mobile Fronthaul Revenue (million) Forecast, by Application 2020 & 2033
- Table 42: Japan Mobile Fronthaul Revenue (million) Forecast, by Application 2020 & 2033
- Table 43: South Korea Mobile Fronthaul Revenue (million) Forecast, by Application 2020 & 2033
- Table 44: ASEAN Mobile Fronthaul Revenue (million) Forecast, by Application 2020 & 2033
- Table 45: Oceania Mobile Fronthaul Revenue (million) Forecast, by Application 2020 & 2033
- Table 46: Rest of Asia Pacific Mobile Fronthaul Revenue (million) Forecast, by Application 2020 & 2033
Frequently Asked Questions
1. What is the projected Compound Annual Growth Rate (CAGR) of the Mobile Fronthaul?
The projected CAGR is approximately 18.8%.
2. Which companies are prominent players in the Mobile Fronthaul?
Key companies in the market include Cisco, Nokia (Alcatel-Lucent), Ericsson, Huawei Technologies, Ciena, Infinera, LS Networks, Fujitsu, Omnitron Systems, ZTE, Visint Communication, Sintai Communication.
3. What are the main segments of the Mobile Fronthaul?
The market segments include Application, Types.
4. Can you provide details about the market size?
The market size is estimated to be USD 5560 million as of 2022.
5. What are some drivers contributing to market growth?
N/A
6. What are the notable trends driving market growth?
N/A
7. Are there any restraints impacting market growth?
N/A
8. Can you provide examples of recent developments in the market?
N/A
9. What pricing options are available for accessing the report?
Pricing options include single-user, multi-user, and enterprise licenses priced at USD 3950.00, USD 5925.00, and USD 7900.00 respectively.
10. Is the market size provided in terms of value or volume?
The market size is provided in terms of value, measured in million.
11. Are there any specific market keywords associated with the report?
Yes, the market keyword associated with the report is "Mobile Fronthaul," which aids in identifying and referencing the specific market segment covered.
12. How do I determine which pricing option suits my needs best?
The pricing options vary based on user requirements and access needs. Individual users may opt for single-user licenses, while businesses requiring broader access may choose multi-user or enterprise licenses for cost-effective access to the report.
13. Are there any additional resources or data provided in the Mobile Fronthaul report?
While the report offers comprehensive insights, it's advisable to review the specific contents or supplementary materials provided to ascertain if additional resources or data are available.
14. How can I stay updated on further developments or reports in the Mobile Fronthaul?
To stay informed about further developments, trends, and reports in the Mobile Fronthaul, consider subscribing to industry newsletters, following relevant companies and organizations, or regularly checking reputable industry news sources and publications.
Methodology
Step 1 - Identification of Relevant Samples Size from Population Database


Step 2 - Approaches for Defining Global Market Size (Value, Volume* & Price*)

Note*: In applicable scenarios
Step 3 - Data Sources
Primary Research
- Web Analytics
- Survey Reports
- Research Institute
- Latest Research Reports
- Opinion Leaders
Secondary Research
- Annual Reports
- White Paper
- Latest Press Release
- Industry Association
- Paid Database
- Investor Presentations

Step 4 - Data Triangulation
Involves using different sources of information in order to increase the validity of a study
These sources are likely to be stakeholders in a program - participants, other researchers, program staff, other community members, and so on.
Then we put all data in single framework & apply various statistical tools to find out the dynamic on the market.
During the analysis stage, feedback from the stakeholder groups would be compared to determine areas of agreement as well as areas of divergence