
Key Insights
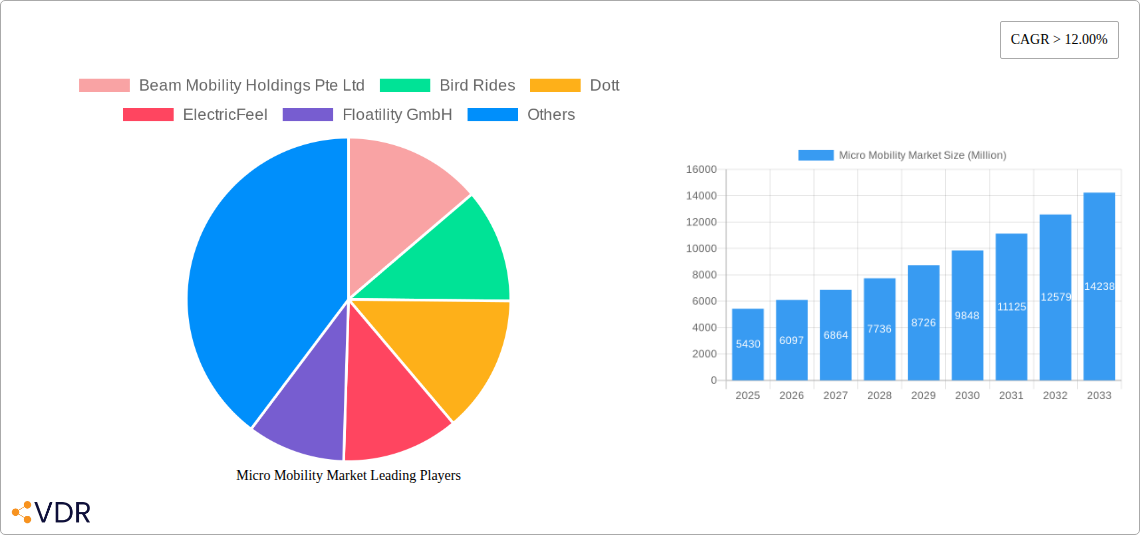
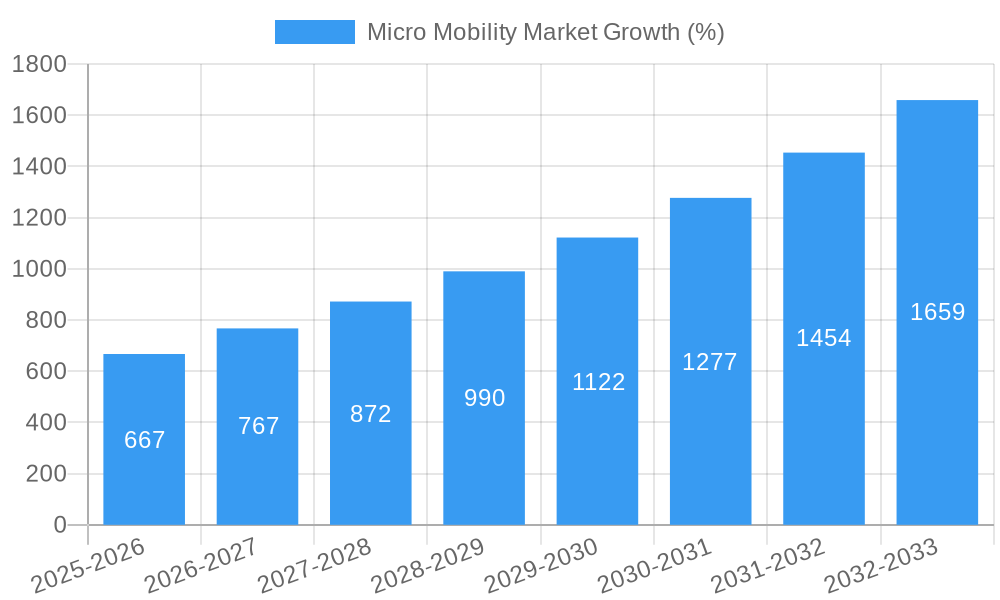
The micro-mobility market, encompassing shared e-scooters, e-bikes, and other light electric vehicles, is experiencing robust growth, projected to reach a market size of $5.43 billion in 2025 and maintain a Compound Annual Growth Rate (CAGR) exceeding 12% through 2033. This expansion is fueled by several key factors. Increasing urbanization and traffic congestion in major cities worldwide are driving demand for efficient and sustainable last-mile transportation solutions. Growing environmental concerns are also contributing to the adoption of electric micro-mobility options as a greener alternative to private vehicles. Furthermore, advancements in battery technology, leading to longer ranges and faster charging times, are enhancing the appeal and practicality of these vehicles. Government initiatives promoting sustainable transportation and the integration of micro-mobility services into public transit systems are also fostering market growth. However, challenges remain, including regulatory hurdles related to safety and infrastructure, concerns about sidewalk congestion and user safety, and the need for robust charging infrastructure to support widespread adoption.
Competition in the micro-mobility sector is intense, with established players like Lime and Bird Rides facing competition from newer entrants like Beam Mobility and Voi. Success will depend on factors such as effective fleet management, strategic partnerships with cities and municipalities, and the development of innovative business models that address user needs and concerns. The market is also expected to see further segmentation, with specialized vehicles for various purposes (e.g., delivery, tourism) and tailored subscription services likely emerging to meet specific user demands. The ongoing evolution of technology will also play a significant role, with advancements in AI, connectivity, and vehicle design expected to improve performance, safety, and user experience. Continued investment in research and development, coupled with strategic partnerships and robust marketing initiatives, will be crucial for companies aiming to secure market share and profitability in this dynamic and evolving market.
Micro Mobility Market Report: 2019-2033
This comprehensive report provides a detailed analysis of the Micro Mobility Market, encompassing its current state, future trajectory, and key players. With a study period spanning 2019-2033, a base year of 2025, and a forecast period of 2025-2033, this report offers invaluable insights for industry professionals, investors, and strategic decision-makers. The report analyzes the parent market of personal transportation and the child market of electric micromobility vehicles, offering a granular view of this rapidly evolving sector. The global market size is projected to reach xx Million units by 2033, exhibiting a CAGR of xx% during the forecast period.
Micro Mobility Market Market Dynamics & Structure
The micro-mobility market is characterized by intense competition, rapid technological innovation, and evolving regulatory landscapes. Market concentration is moderate, with several key players vying for market share. Technological advancements, such as improved battery technology and enhanced safety features, are driving growth. Regulatory frameworks, varying significantly across regions, present both opportunities and challenges. Competitive substitutes, including public transportation and bicycles, influence market adoption. End-user demographics skew towards younger, urban populations. M&A activity has been significant, with deals focused on expansion and technological integration.
- Market Concentration: Moderately fragmented, with top 5 players holding approximately xx% market share in 2025.
- Technological Innovation: Focus on battery life, safety features (e.g., integrated lights, improved braking), and smart connectivity.
- Regulatory Frameworks: Vary widely by region, impacting operational costs and market access. Significant hurdles exist in some markets regarding permits and safety regulations.
- Competitive Substitutes: Public transport, bicycles, and ride-hailing services present strong competition.
- End-User Demographics: Predominantly young adults (18-35) residing in urban areas, influenced by convenience and sustainability concerns.
- M&A Trends: Significant consolidation through acquisitions, driven by expansion strategies and technological integration. XX M&A deals were recorded during 2019-2024.
Micro Mobility Market Growth Trends & Insights
The micro-mobility market has experienced significant growth since 2019, driven by factors such as increasing urbanization, rising environmental concerns, and the convenience offered by these vehicles. Adoption rates have accelerated in recent years, particularly in major metropolitan areas with supportive infrastructure. Technological disruptions, such as the introduction of improved battery technology and enhanced safety features, have further boosted market expansion. Consumer behavior has shifted towards shared mobility services, preferring convenient and affordable options to personal vehicle ownership.
Market size has increased from xx Million units in 2019 to xx Million units in 2024. The market is projected to reach xx Million units by 2025 and xx Million units by 2033. The CAGR during the forecast period (2025-2033) is estimated at xx%. Market penetration remains relatively low in many regions, indicating significant future growth potential.
Dominant Regions, Countries, or Segments in Micro Mobility Market
The micro-mobility market is geographically diverse, with significant variations in adoption and growth rates across different regions and countries. North America and Europe currently hold the largest market share, driven by high levels of urbanization, favorable regulatory environments in some areas, and early adoption of shared mobility services. Asia-Pacific is experiencing rapid growth, driven by increasing urbanization and a burgeoning young population. Key growth drivers include supportive government policies promoting sustainable transportation and investments in infrastructure development to accommodate micro-mobility vehicles.
- North America: Strong market penetration in major cities; high consumer acceptance of shared mobility.
- Europe: Varied regulatory landscapes impacting market development; increasing adoption in key urban centers.
- Asia-Pacific: High growth potential, driven by urbanization and government support; challenges remain in infrastructure development.
Micro Mobility Market Product Landscape
The micro-mobility market offers a diverse range of products, including e-scooters, e-bikes, e-skateboards, and other personal electric vehicles. Product innovations focus on enhancing safety features, battery life, and connectivity. Applications span personal transportation, last-mile delivery, and tourism. Key performance metrics include range, speed, battery life, and safety features. Unique selling propositions include ease of use, affordability, and environmental friendliness.
Key Drivers, Barriers & Challenges in Micro Mobility Market
Key Drivers:
- Increasing urbanization and traffic congestion.
- Growing environmental concerns and the need for sustainable transportation solutions.
- Technological advancements improving vehicle performance and safety.
- Government initiatives promoting micro-mobility and shared mobility services.
Key Challenges & Restraints:
- Regulatory hurdles and inconsistent regulations across different regions.
- Safety concerns associated with accidents and improper use.
- Supply chain disruptions impacting the availability of key components (e.g., batteries).
- Intense competition from established players and new entrants. This competition contributes to pricing pressures and reduces profit margins for some companies.
Emerging Opportunities in Micro Mobility Market
Emerging opportunities include the expansion into untapped markets (e.g., smaller cities and rural areas), the development of innovative applications (e.g., integration with public transport systems), and the customization of vehicles to cater to specific consumer preferences. Furthermore, the integration of advanced technologies such as AI and IoT presents opportunities for enhancing safety, efficiency and the user experience.
Growth Accelerators in the Micro Mobility Market Industry
Long-term growth will be driven by technological breakthroughs in battery technology, enhancing range and lifespan; strategic partnerships between micro-mobility companies and public transport authorities, increasing integration and convenience; and expansion into new markets, particularly in developing countries experiencing rapid urbanization.
Key Players Shaping the Micro Mobility Market Market
- Beam Mobility Holdings Pte Ltd
- Bird Rides
- Dott
- ElectricFeel
- Floatility GmbH
- Lime
- Yulu Bikes Pvt Ltd
- Voi
- Superpedestrian Inc
Notable Milestones in Micro Mobility Market Sector
- March 2023: Voi Technology secured an additional USD 22.8 million in funding to expand its e-scooter services across Europe.
- September 2023: Bird acquired Spin from Tier Mobility for USD 19 million, strengthening its market position.
In-Depth Micro Mobility Market Market Outlook
The micro-mobility market holds significant future potential, driven by continued urbanization, technological advancements, and supportive government policies. Strategic opportunities exist in expanding into new markets, developing innovative products and services, and forming strategic partnerships to enhance market reach and strengthen operational capabilities. The market is poised for sustained growth, with considerable potential for innovation and expansion across diverse geographic regions and user segments.
Micro Mobility Market Segmentation
-
1. Vehicle Type
- 1.1. Electric Kick Scooters
- 1.2. Electric Mopeds
- 1.3. Electric Bicycles
-
2. Battery
- 2.1. Sealed Lead Acid
- 2.2. NiMH
- 2.3. Li-ion
-
3. Voltage
- 3.1. Below 24V
- 3.2. 36V
- 3.3. 48V
- 3.4. Greater than 48V
-
4. Sharing Type
- 4.1. Docked
- 4.2. Dockless
Micro Mobility Market Segmentation By Geography
-
1. North America
- 1.1. United States
- 1.2. Canada
- 1.3. Rest of North America
-
2. Europe
- 2.1. Germany
- 2.2. United Kingdom
- 2.3. France
- 2.4. Italy
- 2.5. Spain
- 2.6. Rest of Europe
-
3. Asia Pacific
- 3.1. China
- 3.2. Japan
- 3.3. India
- 3.4. South Korea
- 3.5. Rest of Asia Pacific
-
4. Rest of the World
- 4.1. South America
- 4.2. Middle East and Africa

Micro Mobility Market REPORT HIGHLIGHTS
| Aspects | Details |
|---|---|
| Study Period | 2019-2033 |
| Base Year | 2024 |
| Estimated Year | 2025 |
| Forecast Period | 2025-2033 |
| Historical Period | 2019-2024 |
| Growth Rate | CAGR of > 12.00% from 2019-2033 |
| Segmentation |
|
Table of Contents
- 1. Introduction
- 1.1. Research Scope
- 1.2. Market Segmentation
- 1.3. Research Methodology
- 1.4. Definitions and Assumptions
- 2. Executive Summary
- 2.1. Introduction
- 3. Market Dynamics
- 3.1. Introduction
- 3.2. Market Drivers
- 3.2.1. Increasing Urban Congestion and a Shift Toward Sustainable Transportation Solutions to Drive Market Growth
- 3.3. Market Restrains
- 3.3.1. Increasing Urban Congestion and a Shift Toward Sustainable Transportation Solutions to Drive Market Growth
- 3.4. Market Trends
- 3.4.1. Docked Micromobility Paving the Way for Sustainable Urban Transportation
- 4. Market Factor Analysis
- 4.1. Porters Five Forces
- 4.2. Supply/Value Chain
- 4.3. PESTEL analysis
- 4.4. Market Entropy
- 4.5. Patent/Trademark Analysis
- 5. Global Micro Mobility Market Analysis, Insights and Forecast, 2019-2031
- 5.1. Market Analysis, Insights and Forecast - by Vehicle Type
- 5.1.1. Electric Kick Scooters
- 5.1.2. Electric Mopeds
- 5.1.3. Electric Bicycles
- 5.2. Market Analysis, Insights and Forecast - by Battery
- 5.2.1. Sealed Lead Acid
- 5.2.2. NiMH
- 5.2.3. Li-ion
- 5.3. Market Analysis, Insights and Forecast - by Voltage
- 5.3.1. Below 24V
- 5.3.2. 36V
- 5.3.3. 48V
- 5.3.4. Greater than 48V
- 5.4. Market Analysis, Insights and Forecast - by Sharing Type
- 5.4.1. Docked
- 5.4.2. Dockless
- 5.5. Market Analysis, Insights and Forecast - by Region
- 5.5.1. North America
- 5.5.2. Europe
- 5.5.3. Asia Pacific
- 5.5.4. Rest of the World
- 5.1. Market Analysis, Insights and Forecast - by Vehicle Type
- 6. North America Micro Mobility Market Analysis, Insights and Forecast, 2019-2031
- 6.1. Market Analysis, Insights and Forecast - by Vehicle Type
- 6.1.1. Electric Kick Scooters
- 6.1.2. Electric Mopeds
- 6.1.3. Electric Bicycles
- 6.2. Market Analysis, Insights and Forecast - by Battery
- 6.2.1. Sealed Lead Acid
- 6.2.2. NiMH
- 6.2.3. Li-ion
- 6.3. Market Analysis, Insights and Forecast - by Voltage
- 6.3.1. Below 24V
- 6.3.2. 36V
- 6.3.3. 48V
- 6.3.4. Greater than 48V
- 6.4. Market Analysis, Insights and Forecast - by Sharing Type
- 6.4.1. Docked
- 6.4.2. Dockless
- 6.1. Market Analysis, Insights and Forecast - by Vehicle Type
- 7. Europe Micro Mobility Market Analysis, Insights and Forecast, 2019-2031
- 7.1. Market Analysis, Insights and Forecast - by Vehicle Type
- 7.1.1. Electric Kick Scooters
- 7.1.2. Electric Mopeds
- 7.1.3. Electric Bicycles
- 7.2. Market Analysis, Insights and Forecast - by Battery
- 7.2.1. Sealed Lead Acid
- 7.2.2. NiMH
- 7.2.3. Li-ion
- 7.3. Market Analysis, Insights and Forecast - by Voltage
- 7.3.1. Below 24V
- 7.3.2. 36V
- 7.3.3. 48V
- 7.3.4. Greater than 48V
- 7.4. Market Analysis, Insights and Forecast - by Sharing Type
- 7.4.1. Docked
- 7.4.2. Dockless
- 7.1. Market Analysis, Insights and Forecast - by Vehicle Type
- 8. Asia Pacific Micro Mobility Market Analysis, Insights and Forecast, 2019-2031
- 8.1. Market Analysis, Insights and Forecast - by Vehicle Type
- 8.1.1. Electric Kick Scooters
- 8.1.2. Electric Mopeds
- 8.1.3. Electric Bicycles
- 8.2. Market Analysis, Insights and Forecast - by Battery
- 8.2.1. Sealed Lead Acid
- 8.2.2. NiMH
- 8.2.3. Li-ion
- 8.3. Market Analysis, Insights and Forecast - by Voltage
- 8.3.1. Below 24V
- 8.3.2. 36V
- 8.3.3. 48V
- 8.3.4. Greater than 48V
- 8.4. Market Analysis, Insights and Forecast - by Sharing Type
- 8.4.1. Docked
- 8.4.2. Dockless
- 8.1. Market Analysis, Insights and Forecast - by Vehicle Type
- 9. Rest of the World Micro Mobility Market Analysis, Insights and Forecast, 2019-2031
- 9.1. Market Analysis, Insights and Forecast - by Vehicle Type
- 9.1.1. Electric Kick Scooters
- 9.1.2. Electric Mopeds
- 9.1.3. Electric Bicycles
- 9.2. Market Analysis, Insights and Forecast - by Battery
- 9.2.1. Sealed Lead Acid
- 9.2.2. NiMH
- 9.2.3. Li-ion
- 9.3. Market Analysis, Insights and Forecast - by Voltage
- 9.3.1. Below 24V
- 9.3.2. 36V
- 9.3.3. 48V
- 9.3.4. Greater than 48V
- 9.4. Market Analysis, Insights and Forecast - by Sharing Type
- 9.4.1. Docked
- 9.4.2. Dockless
- 9.1. Market Analysis, Insights and Forecast - by Vehicle Type
- 10. Competitive Analysis
- 10.1. Global Market Share Analysis 2024
- 10.2. Company Profiles
- 10.2.1 Beam Mobility Holdings Pte Ltd
- 10.2.1.1. Overview
- 10.2.1.2. Products
- 10.2.1.3. SWOT Analysis
- 10.2.1.4. Recent Developments
- 10.2.1.5. Financials (Based on Availability)
- 10.2.2 Bird Rides
- 10.2.2.1. Overview
- 10.2.2.2. Products
- 10.2.2.3. SWOT Analysis
- 10.2.2.4. Recent Developments
- 10.2.2.5. Financials (Based on Availability)
- 10.2.3 Dott
- 10.2.3.1. Overview
- 10.2.3.2. Products
- 10.2.3.3. SWOT Analysis
- 10.2.3.4. Recent Developments
- 10.2.3.5. Financials (Based on Availability)
- 10.2.4 ElectricFeel
- 10.2.4.1. Overview
- 10.2.4.2. Products
- 10.2.4.3. SWOT Analysis
- 10.2.4.4. Recent Developments
- 10.2.4.5. Financials (Based on Availability)
- 10.2.5 Floatility GmbH
- 10.2.5.1. Overview
- 10.2.5.2. Products
- 10.2.5.3. SWOT Analysis
- 10.2.5.4. Recent Developments
- 10.2.5.5. Financials (Based on Availability)
- 10.2.6 Lime
- 10.2.6.1. Overview
- 10.2.6.2. Products
- 10.2.6.3. SWOT Analysis
- 10.2.6.4. Recent Developments
- 10.2.6.5. Financials (Based on Availability)
- 10.2.7 Yulu Bikes Pvt Ltd
- 10.2.7.1. Overview
- 10.2.7.2. Products
- 10.2.7.3. SWOT Analysis
- 10.2.7.4. Recent Developments
- 10.2.7.5. Financials (Based on Availability)
- 10.2.8 Voi
- 10.2.8.1. Overview
- 10.2.8.2. Products
- 10.2.8.3. SWOT Analysis
- 10.2.8.4. Recent Developments
- 10.2.8.5. Financials (Based on Availability)
- 10.2.9 Superpedestrian Inc
- 10.2.9.1. Overview
- 10.2.9.2. Products
- 10.2.9.3. SWOT Analysis
- 10.2.9.4. Recent Developments
- 10.2.9.5. Financials (Based on Availability)
- 10.2.1 Beam Mobility Holdings Pte Ltd
List of Figures
- Figure 1: Global Micro Mobility Market Revenue Breakdown (Million, %) by Region 2024 & 2032
- Figure 2: Global Micro Mobility Market Volume Breakdown (Billion, %) by Region 2024 & 2032
- Figure 3: North America Micro Mobility Market Revenue (Million), by Vehicle Type 2024 & 2032
- Figure 4: North America Micro Mobility Market Volume (Billion), by Vehicle Type 2024 & 2032
- Figure 5: North America Micro Mobility Market Revenue Share (%), by Vehicle Type 2024 & 2032
- Figure 6: North America Micro Mobility Market Volume Share (%), by Vehicle Type 2024 & 2032
- Figure 7: North America Micro Mobility Market Revenue (Million), by Battery 2024 & 2032
- Figure 8: North America Micro Mobility Market Volume (Billion), by Battery 2024 & 2032
- Figure 9: North America Micro Mobility Market Revenue Share (%), by Battery 2024 & 2032
- Figure 10: North America Micro Mobility Market Volume Share (%), by Battery 2024 & 2032
- Figure 11: North America Micro Mobility Market Revenue (Million), by Voltage 2024 & 2032
- Figure 12: North America Micro Mobility Market Volume (Billion), by Voltage 2024 & 2032
- Figure 13: North America Micro Mobility Market Revenue Share (%), by Voltage 2024 & 2032
- Figure 14: North America Micro Mobility Market Volume Share (%), by Voltage 2024 & 2032
- Figure 15: North America Micro Mobility Market Revenue (Million), by Sharing Type 2024 & 2032
- Figure 16: North America Micro Mobility Market Volume (Billion), by Sharing Type 2024 & 2032
- Figure 17: North America Micro Mobility Market Revenue Share (%), by Sharing Type 2024 & 2032
- Figure 18: North America Micro Mobility Market Volume Share (%), by Sharing Type 2024 & 2032
- Figure 19: North America Micro Mobility Market Revenue (Million), by Country 2024 & 2032
- Figure 20: North America Micro Mobility Market Volume (Billion), by Country 2024 & 2032
- Figure 21: North America Micro Mobility Market Revenue Share (%), by Country 2024 & 2032
- Figure 22: North America Micro Mobility Market Volume Share (%), by Country 2024 & 2032
- Figure 23: Europe Micro Mobility Market Revenue (Million), by Vehicle Type 2024 & 2032
- Figure 24: Europe Micro Mobility Market Volume (Billion), by Vehicle Type 2024 & 2032
- Figure 25: Europe Micro Mobility Market Revenue Share (%), by Vehicle Type 2024 & 2032
- Figure 26: Europe Micro Mobility Market Volume Share (%), by Vehicle Type 2024 & 2032
- Figure 27: Europe Micro Mobility Market Revenue (Million), by Battery 2024 & 2032
- Figure 28: Europe Micro Mobility Market Volume (Billion), by Battery 2024 & 2032
- Figure 29: Europe Micro Mobility Market Revenue Share (%), by Battery 2024 & 2032
- Figure 30: Europe Micro Mobility Market Volume Share (%), by Battery 2024 & 2032
- Figure 31: Europe Micro Mobility Market Revenue (Million), by Voltage 2024 & 2032
- Figure 32: Europe Micro Mobility Market Volume (Billion), by Voltage 2024 & 2032
- Figure 33: Europe Micro Mobility Market Revenue Share (%), by Voltage 2024 & 2032
- Figure 34: Europe Micro Mobility Market Volume Share (%), by Voltage 2024 & 2032
- Figure 35: Europe Micro Mobility Market Revenue (Million), by Sharing Type 2024 & 2032
- Figure 36: Europe Micro Mobility Market Volume (Billion), by Sharing Type 2024 & 2032
- Figure 37: Europe Micro Mobility Market Revenue Share (%), by Sharing Type 2024 & 2032
- Figure 38: Europe Micro Mobility Market Volume Share (%), by Sharing Type 2024 & 2032
- Figure 39: Europe Micro Mobility Market Revenue (Million), by Country 2024 & 2032
- Figure 40: Europe Micro Mobility Market Volume (Billion), by Country 2024 & 2032
- Figure 41: Europe Micro Mobility Market Revenue Share (%), by Country 2024 & 2032
- Figure 42: Europe Micro Mobility Market Volume Share (%), by Country 2024 & 2032
- Figure 43: Asia Pacific Micro Mobility Market Revenue (Million), by Vehicle Type 2024 & 2032
- Figure 44: Asia Pacific Micro Mobility Market Volume (Billion), by Vehicle Type 2024 & 2032
- Figure 45: Asia Pacific Micro Mobility Market Revenue Share (%), by Vehicle Type 2024 & 2032
- Figure 46: Asia Pacific Micro Mobility Market Volume Share (%), by Vehicle Type 2024 & 2032
- Figure 47: Asia Pacific Micro Mobility Market Revenue (Million), by Battery 2024 & 2032
- Figure 48: Asia Pacific Micro Mobility Market Volume (Billion), by Battery 2024 & 2032
- Figure 49: Asia Pacific Micro Mobility Market Revenue Share (%), by Battery 2024 & 2032
- Figure 50: Asia Pacific Micro Mobility Market Volume Share (%), by Battery 2024 & 2032
- Figure 51: Asia Pacific Micro Mobility Market Revenue (Million), by Voltage 2024 & 2032
- Figure 52: Asia Pacific Micro Mobility Market Volume (Billion), by Voltage 2024 & 2032
- Figure 53: Asia Pacific Micro Mobility Market Revenue Share (%), by Voltage 2024 & 2032
- Figure 54: Asia Pacific Micro Mobility Market Volume Share (%), by Voltage 2024 & 2032
- Figure 55: Asia Pacific Micro Mobility Market Revenue (Million), by Sharing Type 2024 & 2032
- Figure 56: Asia Pacific Micro Mobility Market Volume (Billion), by Sharing Type 2024 & 2032
- Figure 57: Asia Pacific Micro Mobility Market Revenue Share (%), by Sharing Type 2024 & 2032
- Figure 58: Asia Pacific Micro Mobility Market Volume Share (%), by Sharing Type 2024 & 2032
- Figure 59: Asia Pacific Micro Mobility Market Revenue (Million), by Country 2024 & 2032
- Figure 60: Asia Pacific Micro Mobility Market Volume (Billion), by Country 2024 & 2032
- Figure 61: Asia Pacific Micro Mobility Market Revenue Share (%), by Country 2024 & 2032
- Figure 62: Asia Pacific Micro Mobility Market Volume Share (%), by Country 2024 & 2032
- Figure 63: Rest of the World Micro Mobility Market Revenue (Million), by Vehicle Type 2024 & 2032
- Figure 64: Rest of the World Micro Mobility Market Volume (Billion), by Vehicle Type 2024 & 2032
- Figure 65: Rest of the World Micro Mobility Market Revenue Share (%), by Vehicle Type 2024 & 2032
- Figure 66: Rest of the World Micro Mobility Market Volume Share (%), by Vehicle Type 2024 & 2032
- Figure 67: Rest of the World Micro Mobility Market Revenue (Million), by Battery 2024 & 2032
- Figure 68: Rest of the World Micro Mobility Market Volume (Billion), by Battery 2024 & 2032
- Figure 69: Rest of the World Micro Mobility Market Revenue Share (%), by Battery 2024 & 2032
- Figure 70: Rest of the World Micro Mobility Market Volume Share (%), by Battery 2024 & 2032
- Figure 71: Rest of the World Micro Mobility Market Revenue (Million), by Voltage 2024 & 2032
- Figure 72: Rest of the World Micro Mobility Market Volume (Billion), by Voltage 2024 & 2032
- Figure 73: Rest of the World Micro Mobility Market Revenue Share (%), by Voltage 2024 & 2032
- Figure 74: Rest of the World Micro Mobility Market Volume Share (%), by Voltage 2024 & 2032
- Figure 75: Rest of the World Micro Mobility Market Revenue (Million), by Sharing Type 2024 & 2032
- Figure 76: Rest of the World Micro Mobility Market Volume (Billion), by Sharing Type 2024 & 2032
- Figure 77: Rest of the World Micro Mobility Market Revenue Share (%), by Sharing Type 2024 & 2032
- Figure 78: Rest of the World Micro Mobility Market Volume Share (%), by Sharing Type 2024 & 2032
- Figure 79: Rest of the World Micro Mobility Market Revenue (Million), by Country 2024 & 2032
- Figure 80: Rest of the World Micro Mobility Market Volume (Billion), by Country 2024 & 2032
- Figure 81: Rest of the World Micro Mobility Market Revenue Share (%), by Country 2024 & 2032
- Figure 82: Rest of the World Micro Mobility Market Volume Share (%), by Country 2024 & 2032
List of Tables
- Table 1: Global Micro Mobility Market Revenue Million Forecast, by Region 2019 & 2032
- Table 2: Global Micro Mobility Market Volume Billion Forecast, by Region 2019 & 2032
- Table 3: Global Micro Mobility Market Revenue Million Forecast, by Vehicle Type 2019 & 2032
- Table 4: Global Micro Mobility Market Volume Billion Forecast, by Vehicle Type 2019 & 2032
- Table 5: Global Micro Mobility Market Revenue Million Forecast, by Battery 2019 & 2032
- Table 6: Global Micro Mobility Market Volume Billion Forecast, by Battery 2019 & 2032
- Table 7: Global Micro Mobility Market Revenue Million Forecast, by Voltage 2019 & 2032
- Table 8: Global Micro Mobility Market Volume Billion Forecast, by Voltage 2019 & 2032
- Table 9: Global Micro Mobility Market Revenue Million Forecast, by Sharing Type 2019 & 2032
- Table 10: Global Micro Mobility Market Volume Billion Forecast, by Sharing Type 2019 & 2032
- Table 11: Global Micro Mobility Market Revenue Million Forecast, by Region 2019 & 2032
- Table 12: Global Micro Mobility Market Volume Billion Forecast, by Region 2019 & 2032
- Table 13: Global Micro Mobility Market Revenue Million Forecast, by Vehicle Type 2019 & 2032
- Table 14: Global Micro Mobility Market Volume Billion Forecast, by Vehicle Type 2019 & 2032
- Table 15: Global Micro Mobility Market Revenue Million Forecast, by Battery 2019 & 2032
- Table 16: Global Micro Mobility Market Volume Billion Forecast, by Battery 2019 & 2032
- Table 17: Global Micro Mobility Market Revenue Million Forecast, by Voltage 2019 & 2032
- Table 18: Global Micro Mobility Market Volume Billion Forecast, by Voltage 2019 & 2032
- Table 19: Global Micro Mobility Market Revenue Million Forecast, by Sharing Type 2019 & 2032
- Table 20: Global Micro Mobility Market Volume Billion Forecast, by Sharing Type 2019 & 2032
- Table 21: Global Micro Mobility Market Revenue Million Forecast, by Country 2019 & 2032
- Table 22: Global Micro Mobility Market Volume Billion Forecast, by Country 2019 & 2032
- Table 23: United States Micro Mobility Market Revenue (Million) Forecast, by Application 2019 & 2032
- Table 24: United States Micro Mobility Market Volume (Billion) Forecast, by Application 2019 & 2032
- Table 25: Canada Micro Mobility Market Revenue (Million) Forecast, by Application 2019 & 2032
- Table 26: Canada Micro Mobility Market Volume (Billion) Forecast, by Application 2019 & 2032
- Table 27: Rest of North America Micro Mobility Market Revenue (Million) Forecast, by Application 2019 & 2032
- Table 28: Rest of North America Micro Mobility Market Volume (Billion) Forecast, by Application 2019 & 2032
- Table 29: Global Micro Mobility Market Revenue Million Forecast, by Vehicle Type 2019 & 2032
- Table 30: Global Micro Mobility Market Volume Billion Forecast, by Vehicle Type 2019 & 2032
- Table 31: Global Micro Mobility Market Revenue Million Forecast, by Battery 2019 & 2032
- Table 32: Global Micro Mobility Market Volume Billion Forecast, by Battery 2019 & 2032
- Table 33: Global Micro Mobility Market Revenue Million Forecast, by Voltage 2019 & 2032
- Table 34: Global Micro Mobility Market Volume Billion Forecast, by Voltage 2019 & 2032
- Table 35: Global Micro Mobility Market Revenue Million Forecast, by Sharing Type 2019 & 2032
- Table 36: Global Micro Mobility Market Volume Billion Forecast, by Sharing Type 2019 & 2032
- Table 37: Global Micro Mobility Market Revenue Million Forecast, by Country 2019 & 2032
- Table 38: Global Micro Mobility Market Volume Billion Forecast, by Country 2019 & 2032
- Table 39: Germany Micro Mobility Market Revenue (Million) Forecast, by Application 2019 & 2032
- Table 40: Germany Micro Mobility Market Volume (Billion) Forecast, by Application 2019 & 2032
- Table 41: United Kingdom Micro Mobility Market Revenue (Million) Forecast, by Application 2019 & 2032
- Table 42: United Kingdom Micro Mobility Market Volume (Billion) Forecast, by Application 2019 & 2032
- Table 43: France Micro Mobility Market Revenue (Million) Forecast, by Application 2019 & 2032
- Table 44: France Micro Mobility Market Volume (Billion) Forecast, by Application 2019 & 2032
- Table 45: Italy Micro Mobility Market Revenue (Million) Forecast, by Application 2019 & 2032
- Table 46: Italy Micro Mobility Market Volume (Billion) Forecast, by Application 2019 & 2032
- Table 47: Spain Micro Mobility Market Revenue (Million) Forecast, by Application 2019 & 2032
- Table 48: Spain Micro Mobility Market Volume (Billion) Forecast, by Application 2019 & 2032
- Table 49: Rest of Europe Micro Mobility Market Revenue (Million) Forecast, by Application 2019 & 2032
- Table 50: Rest of Europe Micro Mobility Market Volume (Billion) Forecast, by Application 2019 & 2032
- Table 51: Global Micro Mobility Market Revenue Million Forecast, by Vehicle Type 2019 & 2032
- Table 52: Global Micro Mobility Market Volume Billion Forecast, by Vehicle Type 2019 & 2032
- Table 53: Global Micro Mobility Market Revenue Million Forecast, by Battery 2019 & 2032
- Table 54: Global Micro Mobility Market Volume Billion Forecast, by Battery 2019 & 2032
- Table 55: Global Micro Mobility Market Revenue Million Forecast, by Voltage 2019 & 2032
- Table 56: Global Micro Mobility Market Volume Billion Forecast, by Voltage 2019 & 2032
- Table 57: Global Micro Mobility Market Revenue Million Forecast, by Sharing Type 2019 & 2032
- Table 58: Global Micro Mobility Market Volume Billion Forecast, by Sharing Type 2019 & 2032
- Table 59: Global Micro Mobility Market Revenue Million Forecast, by Country 2019 & 2032
- Table 60: Global Micro Mobility Market Volume Billion Forecast, by Country 2019 & 2032
- Table 61: China Micro Mobility Market Revenue (Million) Forecast, by Application 2019 & 2032
- Table 62: China Micro Mobility Market Volume (Billion) Forecast, by Application 2019 & 2032
- Table 63: Japan Micro Mobility Market Revenue (Million) Forecast, by Application 2019 & 2032
- Table 64: Japan Micro Mobility Market Volume (Billion) Forecast, by Application 2019 & 2032
- Table 65: India Micro Mobility Market Revenue (Million) Forecast, by Application 2019 & 2032
- Table 66: India Micro Mobility Market Volume (Billion) Forecast, by Application 2019 & 2032
- Table 67: South Korea Micro Mobility Market Revenue (Million) Forecast, by Application 2019 & 2032
- Table 68: South Korea Micro Mobility Market Volume (Billion) Forecast, by Application 2019 & 2032
- Table 69: Rest of Asia Pacific Micro Mobility Market Revenue (Million) Forecast, by Application 2019 & 2032
- Table 70: Rest of Asia Pacific Micro Mobility Market Volume (Billion) Forecast, by Application 2019 & 2032
- Table 71: Global Micro Mobility Market Revenue Million Forecast, by Vehicle Type 2019 & 2032
- Table 72: Global Micro Mobility Market Volume Billion Forecast, by Vehicle Type 2019 & 2032
- Table 73: Global Micro Mobility Market Revenue Million Forecast, by Battery 2019 & 2032
- Table 74: Global Micro Mobility Market Volume Billion Forecast, by Battery 2019 & 2032
- Table 75: Global Micro Mobility Market Revenue Million Forecast, by Voltage 2019 & 2032
- Table 76: Global Micro Mobility Market Volume Billion Forecast, by Voltage 2019 & 2032
- Table 77: Global Micro Mobility Market Revenue Million Forecast, by Sharing Type 2019 & 2032
- Table 78: Global Micro Mobility Market Volume Billion Forecast, by Sharing Type 2019 & 2032
- Table 79: Global Micro Mobility Market Revenue Million Forecast, by Country 2019 & 2032
- Table 80: Global Micro Mobility Market Volume Billion Forecast, by Country 2019 & 2032
- Table 81: South America Micro Mobility Market Revenue (Million) Forecast, by Application 2019 & 2032
- Table 82: South America Micro Mobility Market Volume (Billion) Forecast, by Application 2019 & 2032
- Table 83: Middle East and Africa Micro Mobility Market Revenue (Million) Forecast, by Application 2019 & 2032
- Table 84: Middle East and Africa Micro Mobility Market Volume (Billion) Forecast, by Application 2019 & 2032
Frequently Asked Questions
1. What is the projected Compound Annual Growth Rate (CAGR) of the Micro Mobility Market?
The projected CAGR is approximately > 12.00%.
2. Which companies are prominent players in the Micro Mobility Market?
Key companies in the market include Beam Mobility Holdings Pte Ltd, Bird Rides, Dott, ElectricFeel, Floatility GmbH, Lime, Yulu Bikes Pvt Ltd, Voi, Superpedestrian Inc.
3. What are the main segments of the Micro Mobility Market?
The market segments include Vehicle Type, Battery, Voltage, Sharing Type.
4. Can you provide details about the market size?
The market size is estimated to be USD 5.43 Million as of 2022.
5. What are some drivers contributing to market growth?
Increasing Urban Congestion and a Shift Toward Sustainable Transportation Solutions to Drive Market Growth.
6. What are the notable trends driving market growth?
Docked Micromobility Paving the Way for Sustainable Urban Transportation.
7. Are there any restraints impacting market growth?
Increasing Urban Congestion and a Shift Toward Sustainable Transportation Solutions to Drive Market Growth.
8. Can you provide examples of recent developments in the market?
March 2023: Voi Technology secured an additional USD 22.8 million in funding to extend its e-scooter services across Europe. This investment will support Voi's plan to increase its fleet and enhance its offerings in urban mobility solutions.
9. What pricing options are available for accessing the report?
Pricing options include single-user, multi-user, and enterprise licenses priced at USD 4750, USD 5250, and USD 8750 respectively.
10. Is the market size provided in terms of value or volume?
The market size is provided in terms of value, measured in Million and volume, measured in Billion.
11. Are there any specific market keywords associated with the report?
Yes, the market keyword associated with the report is "Micro Mobility Market," which aids in identifying and referencing the specific market segment covered.
12. How do I determine which pricing option suits my needs best?
The pricing options vary based on user requirements and access needs. Individual users may opt for single-user licenses, while businesses requiring broader access may choose multi-user or enterprise licenses for cost-effective access to the report.
13. Are there any additional resources or data provided in the Micro Mobility Market report?
While the report offers comprehensive insights, it's advisable to review the specific contents or supplementary materials provided to ascertain if additional resources or data are available.
14. How can I stay updated on further developments or reports in the Micro Mobility Market?
To stay informed about further developments, trends, and reports in the Micro Mobility Market, consider subscribing to industry newsletters, following relevant companies and organizations, or regularly checking reputable industry news sources and publications.
Methodology
Step 1 - Identification of Relevant Samples Size from Population Database


Step 2 - Approaches for Defining Global Market Size (Value, Volume* & Price*)

Note*: In applicable scenarios
Step 3 - Data Sources
Primary Research
- Web Analytics
- Survey Reports
- Research Institute
- Latest Research Reports
- Opinion Leaders
Secondary Research
- Annual Reports
- White Paper
- Latest Press Release
- Industry Association
- Paid Database
- Investor Presentations

Step 4 - Data Triangulation
Involves using different sources of information in order to increase the validity of a study
These sources are likely to be stakeholders in a program - participants, other researchers, program staff, other community members, and so on.
Then we put all data in single framework & apply various statistical tools to find out the dynamic on the market.
During the analysis stage, feedback from the stakeholder groups would be compared to determine areas of agreement as well as areas of divergence


