
Key Insights
The MEA Epoxy Resin market, while smaller than its North American or Asian counterparts, presents a compelling growth opportunity. Driven by increasing infrastructure development, particularly in the construction and renewable energy sectors (wind turbines), the region is witnessing a steady rise in demand for epoxy resins. The construction boom across the UAE and Saudi Arabia, fueled by ambitious national development plans, significantly contributes to this growth. Furthermore, the burgeoning automotive industry in South Africa and the expanding electronics manufacturing in the region also create substantial demand for high-performance epoxy resins used in adhesives, coatings, and components. The market is segmented by raw material type, with bisphenol-A based resins dominating due to their cost-effectiveness and established applications. However, the increasing focus on sustainability is driving interest in bio-based and less-toxic alternatives, including Novolac and aliphatic epoxy resins. This shift towards environmentally friendly options is likely to impact the market share distribution in the coming years. Competitive pressures are moderate with a mix of international and regional players. However, the market presents opportunities for specialized resin manufacturers catering to niche applications and sustainable solutions.
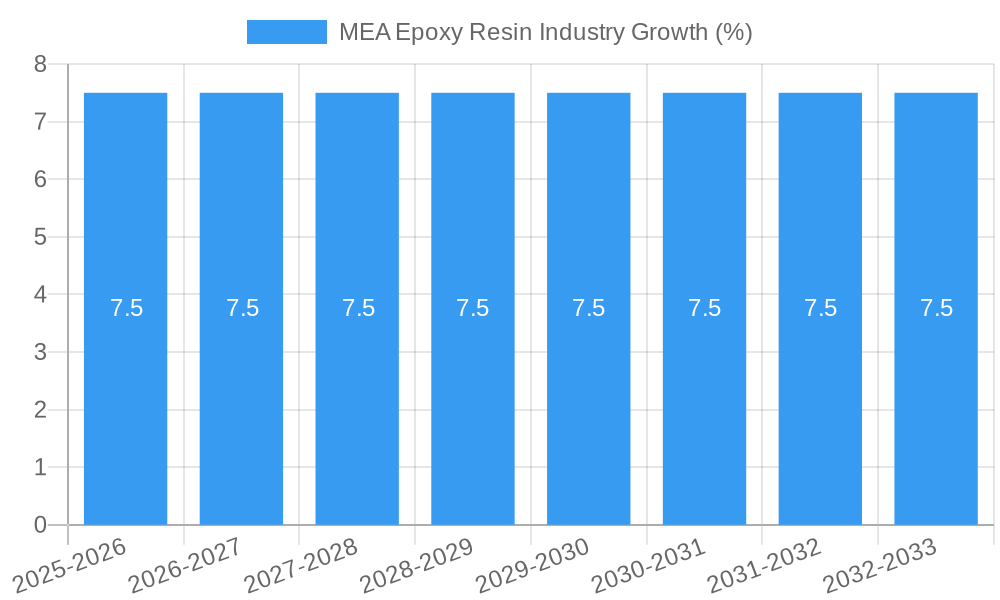
The forecast for the MEA Epoxy Resin market between 2025 and 2033 is optimistic, projecting a Compound Annual Growth Rate (CAGR) exceeding 5%. This growth will be underpinned by continued infrastructure development, industrialization, and the growing adoption of renewable energy technologies. Challenges include fluctuating raw material prices, potential supply chain disruptions, and the need to meet stringent environmental regulations. However, these challenges also present opportunities for innovation and the development of advanced, sustainable epoxy resin solutions. The market's success hinges on strategic partnerships, technological advancements, and a focus on meeting the specific needs of the region's diverse industries. The focus on expanding into new applications, especially those relating to sustainable construction and renewable energy, will be crucial for maximizing growth potential.
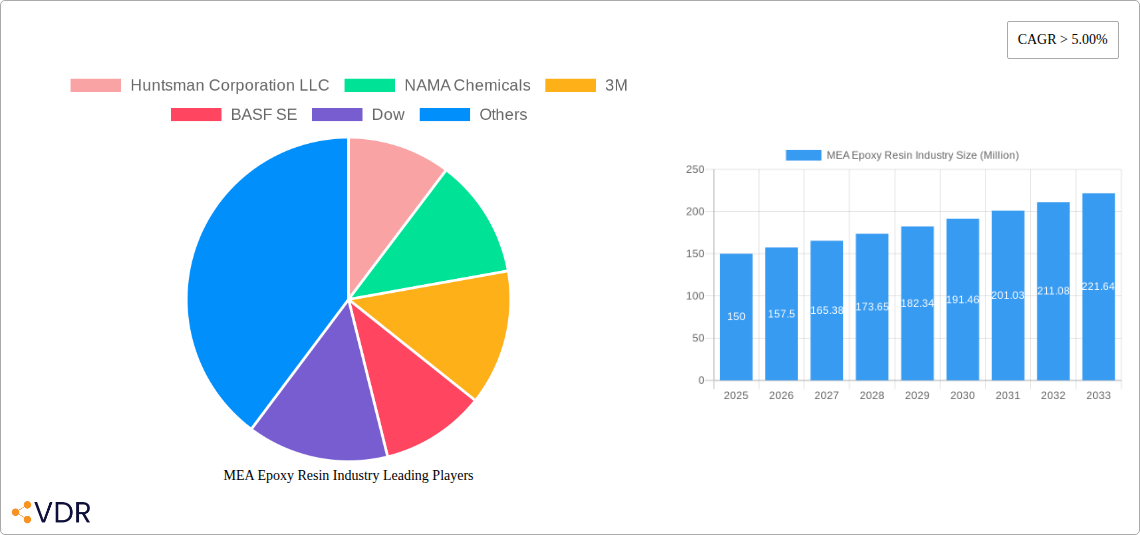
This comprehensive report provides an in-depth analysis of the Middle East and Africa (MEA) epoxy resin industry, offering invaluable insights for industry professionals, investors, and strategic decision-makers. The report covers the period from 2019 to 2033, with a focus on the forecast period of 2025-2033 and a base year of 2025. Key segments analyzed include raw material types (DGBEA, DGBEF, Novolac Epoxy, Aliphatic Epoxy Resins, Glycidylamine Epoxy Resins, and Others) and applications (Paints and Coatings, Adhesives, Composites, Electrical & Electronics, Wind Turbines, and Others). Leading players like Huntsman Corporation LLC, NAMA Chemicals, 3M, BASF SE, Dow, Aditya Birla Chemicals, Daicel Corporation, Hexion, Olin Corporation, NAN YA PLASTICS CORPORATION, and others are profiled. The report projects a market size of xx Million units by 2033.
MEA Epoxy Resin Industry Market Dynamics & Structure
This section analyzes the MEA epoxy resin market's structure, highlighting market concentration, technological innovation, regulatory landscapes, competitive substitutes, end-user demographics, and M&A activity. The market is moderately concentrated, with a few major players holding significant market share. Technological innovation, particularly in bio-based epoxy resins, is a key driver. Stringent environmental regulations are shaping the industry, pushing companies towards sustainable practices. Competition from alternative materials like polyurethane is a challenge. The end-user base is diverse, spanning construction, automotive, and electronics sectors. M&A activity has been moderate, with several strategic acquisitions aimed at expanding market reach and product portfolios.
- Market Concentration: Moderately concentrated, with top 5 players holding approximately xx% market share in 2025.
- Technological Innovation: Focus on bio-based epoxy resins and improved performance characteristics.
- Regulatory Landscape: Stringent environmental regulations driving adoption of sustainable solutions.
- Competitive Substitutes: Polyurethane and other polymers pose competitive challenges.
- End-User Demographics: Diverse across construction, automotive, electronics, and wind energy sectors.
- M&A Activity: Moderate activity, primarily driven by strategic expansion and product diversification.
MEA Epoxy Resin Industry Growth Trends & Insights
The MEA epoxy resin market experienced significant growth during the historical period (2019-2024), driven by increasing infrastructure development, rising demand from the construction and automotive industries, and growth of renewable energy sector. The market is expected to maintain a healthy CAGR of xx% during the forecast period (2025-2033). Technological advancements, such as the development of high-performance epoxy resins with improved durability and thermal resistance, are further fueling market expansion. Shifting consumer preferences towards eco-friendly products are influencing demand for bio-based epoxy resins. Adoption rates are increasing across various applications, driven by superior performance characteristics and cost-effectiveness of epoxy resins compared to alternatives.
Dominant Regions, Countries, or Segments in MEA Epoxy Resin Industry
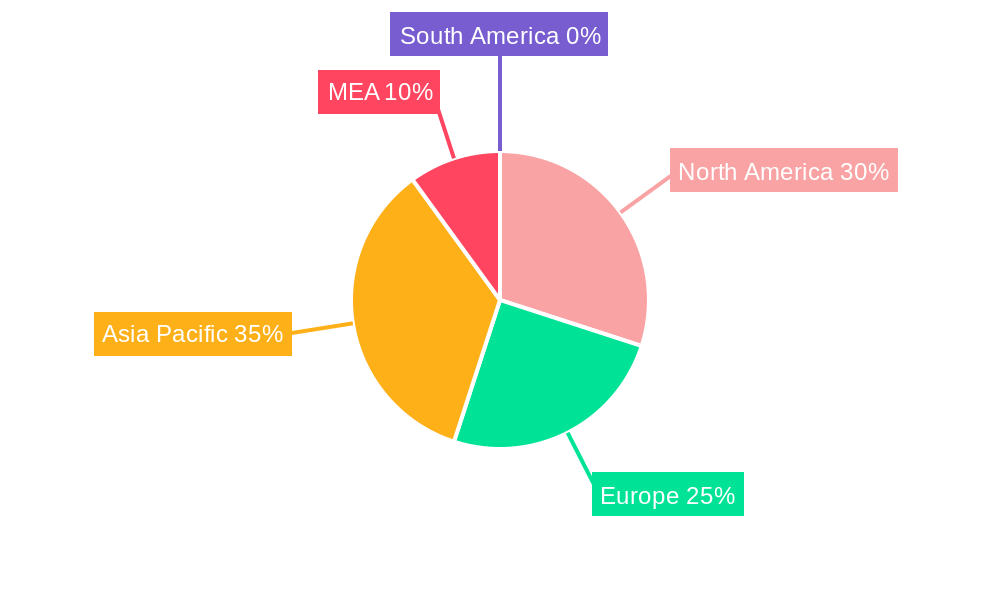
The MEA epoxy resin market is geographically diverse, with significant growth anticipated across several regions and application segments. The Paints and Coatings segment is projected to maintain its dominance throughout the forecast period due to the burgeoning construction and infrastructure sectors in the region. DGBEA (Bisphenol A and ECH) remains the leading raw material type due to its established use and cost-effectiveness. Countries like Saudi Arabia, the UAE, and Egypt are key markets, driven by robust infrastructure development and industrialization. The growth of the wind energy sector in several MEA countries is stimulating demand for epoxy resins in wind turbine applications.
- Leading Region: The Middle East (especially GCC countries) exhibiting the highest growth rate.
- Leading Raw Material Type: DGBEA (Bisphenol A and ECH) due to its widespread use.
- Leading Application: Paints and Coatings due to strong growth in the construction sector.
- Key Growth Drivers: Government investment in infrastructure, industrialization, and growing renewable energy sector.
MEA Epoxy Resin Industry Product Landscape
The MEA epoxy resin market offers a diverse range of products with varying properties and applications. Innovations focus on developing high-performance resins with enhanced durability, thermal resistance, and chemical resistance. Product differentiation often revolves around specialized properties tailored for specific applications. Advanced formulations meet stringent industry standards in construction, electronics, and automotive sectors. Technological advancements include the introduction of bio-based epoxy resins aiming to reduce environmental impact.
Key Drivers, Barriers & Challenges in MEA Epoxy Resin Industry
Key Drivers:
- Rapid infrastructure development and industrialization in the MEA region.
- Growing demand from the construction, automotive, and renewable energy sectors.
- Technological advancements leading to improved resin performance and applications.
Challenges & Restraints:
- Fluctuations in raw material prices and supply chain disruptions.
- Stringent environmental regulations impacting production processes and product development.
- Competition from alternative materials and the need for continuous innovation.
- Economic volatility in some parts of the MEA region impacting investment decisions.
Emerging Opportunities in MEA Epoxy Resin Industry
- Growth of renewable energy and sustainable infrastructure projects presents significant opportunities.
- Increasing demand for high-performance epoxy resins in advanced applications (e.g., aerospace and electronics).
- Focus on developing bio-based and sustainable epoxy resins to meet environmental concerns.
- Expansion into untapped markets within the MEA region.
Growth Accelerators in the MEA Epoxy Resin Industry Industry
The MEA epoxy resin market is poised for sustained growth driven by continuous technological innovation leading to improved resin performance, expanding applications in diverse industries, and strategic partnerships that foster market expansion. Government initiatives promoting sustainable infrastructure and renewable energy further accelerate market growth. Increasing investments in research and development are creating high-performance resins tailored to specific application needs.
Key Players Shaping the MEA Epoxy Resin Industry Market
- Huntsman Corporation LLC
- NAMA Chemicals
- 3M
- BASF SE
- Dow
- Aditya Birla Chemicals
- Daicel Corporation
- Hexion
- Olin Corporation
- NAN YA PLASTICS CORPORATION
Notable Milestones in MEA Epoxy Resin Industry Sector
- 2021: Launch of a new bio-based epoxy resin by Company X.
- 2022: Acquisition of Company Y by Company Z, expanding market share in the UAE.
- 2023: Introduction of a high-performance epoxy resin with enhanced thermal resistance.
- xx/xx/xxxx: Government policy to encourage use of eco-friendly materials in construction projects.
In-Depth MEA Epoxy Resin Industry Market Outlook
The MEA epoxy resin market is poised for significant growth, driven by infrastructure development, technological advancements, and the expansion of various downstream industries. Strategic investments in R&D, focusing on sustainable and high-performance resins, will shape the market landscape. Collaboration among key players will be crucial in navigating regulatory hurdles and fostering market expansion. The market presents significant opportunities for both established players and new entrants who can offer innovative products and solutions that address the growing demands of the MEA region.
MEA Epoxy Resin Industry Segmentation
-
1. Raw Material Type
- 1.1. DGBEA (Bisphenol A and ECH)
- 1.2. DGBEF (Bisphenol F and ECH)
- 1.3. Novolac Epoxy (Formaldehyde and Phenols)
- 1.4. Aliphatic Epoxy Resins (Aliphatic Alcohols)
- 1.5. Glycidyl
- 1.6. Other Raw Material Types
-
2. Application
- 2.1. Paints and Coatings
- 2.2. Adhesives
- 2.3. Composites
- 2.4. Electrical and Electronics
- 2.5. Wind Turbines
- 2.6. Other Applications
-
3. Geography
- 3.1. Saudi Arabia
- 3.2. South Africa
- 3.3. Nigeria
- 3.4. Kuwait
- 3.5. United Arab Emirates
- 3.6. Rest of Middle-East and Africa
MEA Epoxy Resin Industry Segmentation By Geography
- 1. Saudi Arabia
- 2. South Africa
- 3. Nigeria
- 4. Kuwait
- 5. United Arab Emirates
- 6. Rest of Middle East and Africa
MEA Epoxy Resin Industry REPORT HIGHLIGHTS
| Aspects | Details |
|---|---|
| Study Period | 2019-2033 |
| Base Year | 2024 |
| Estimated Year | 2025 |
| Forecast Period | 2025-2033 |
| Historical Period | 2019-2024 |
| Growth Rate | CAGR of > 5.00% from 2019-2033 |
| Segmentation |
|
Table of Contents
- 1. Introduction
- 1.1. Research Scope
- 1.2. Market Segmentation
- 1.3. Research Methodology
- 1.4. Definitions and Assumptions
- 2. Executive Summary
- 2.1. Introduction
- 3. Market Dynamics
- 3.1. Introduction
- 3.2. Market Drivers
- 3.2.1. ; Strong Growth of Construction Industry in Middle East & Africa; Rising Demand for Electrical and Electronic Devices
- 3.3. Market Restrains
- 3.3.1. ; Hazardous Impact of Epoxy on Health
- 3.4. Market Trends
- 3.4.1. Increasing Demand from Composites
- 4. Market Factor Analysis
- 4.1. Porters Five Forces
- 4.2. Supply/Value Chain
- 4.3. PESTEL analysis
- 4.4. Market Entropy
- 4.5. Patent/Trademark Analysis
- 5. Global MEA Epoxy Resin Industry Analysis, Insights and Forecast, 2019-2031
- 5.1. Market Analysis, Insights and Forecast - by Raw Material Type
- 5.1.1. DGBEA (Bisphenol A and ECH)
- 5.1.2. DGBEF (Bisphenol F and ECH)
- 5.1.3. Novolac Epoxy (Formaldehyde and Phenols)
- 5.1.4. Aliphatic Epoxy Resins (Aliphatic Alcohols)
- 5.1.5. Glycidyl
- 5.1.6. Other Raw Material Types
- 5.2. Market Analysis, Insights and Forecast - by Application
- 5.2.1. Paints and Coatings
- 5.2.2. Adhesives
- 5.2.3. Composites
- 5.2.4. Electrical and Electronics
- 5.2.5. Wind Turbines
- 5.2.6. Other Applications
- 5.3. Market Analysis, Insights and Forecast - by Geography
- 5.3.1. Saudi Arabia
- 5.3.2. South Africa
- 5.3.3. Nigeria
- 5.3.4. Kuwait
- 5.3.5. United Arab Emirates
- 5.3.6. Rest of Middle-East and Africa
- 5.4. Market Analysis, Insights and Forecast - by Region
- 5.4.1. Saudi Arabia
- 5.4.2. South Africa
- 5.4.3. Nigeria
- 5.4.4. Kuwait
- 5.4.5. United Arab Emirates
- 5.4.6. Rest of Middle East and Africa
- 5.1. Market Analysis, Insights and Forecast - by Raw Material Type
- 6. Saudi Arabia MEA Epoxy Resin Industry Analysis, Insights and Forecast, 2019-2031
- 6.1. Market Analysis, Insights and Forecast - by Raw Material Type
- 6.1.1. DGBEA (Bisphenol A and ECH)
- 6.1.2. DGBEF (Bisphenol F and ECH)
- 6.1.3. Novolac Epoxy (Formaldehyde and Phenols)
- 6.1.4. Aliphatic Epoxy Resins (Aliphatic Alcohols)
- 6.1.5. Glycidyl
- 6.1.6. Other Raw Material Types
- 6.2. Market Analysis, Insights and Forecast - by Application
- 6.2.1. Paints and Coatings
- 6.2.2. Adhesives
- 6.2.3. Composites
- 6.2.4. Electrical and Electronics
- 6.2.5. Wind Turbines
- 6.2.6. Other Applications
- 6.3. Market Analysis, Insights and Forecast - by Geography
- 6.3.1. Saudi Arabia
- 6.3.2. South Africa
- 6.3.3. Nigeria
- 6.3.4. Kuwait
- 6.3.5. United Arab Emirates
- 6.3.6. Rest of Middle-East and Africa
- 6.1. Market Analysis, Insights and Forecast - by Raw Material Type
- 7. South Africa MEA Epoxy Resin Industry Analysis, Insights and Forecast, 2019-2031
- 7.1. Market Analysis, Insights and Forecast - by Raw Material Type
- 7.1.1. DGBEA (Bisphenol A and ECH)
- 7.1.2. DGBEF (Bisphenol F and ECH)
- 7.1.3. Novolac Epoxy (Formaldehyde and Phenols)
- 7.1.4. Aliphatic Epoxy Resins (Aliphatic Alcohols)
- 7.1.5. Glycidyl
- 7.1.6. Other Raw Material Types
- 7.2. Market Analysis, Insights and Forecast - by Application
- 7.2.1. Paints and Coatings
- 7.2.2. Adhesives
- 7.2.3. Composites
- 7.2.4. Electrical and Electronics
- 7.2.5. Wind Turbines
- 7.2.6. Other Applications
- 7.3. Market Analysis, Insights and Forecast - by Geography
- 7.3.1. Saudi Arabia
- 7.3.2. South Africa
- 7.3.3. Nigeria
- 7.3.4. Kuwait
- 7.3.5. United Arab Emirates
- 7.3.6. Rest of Middle-East and Africa
- 7.1. Market Analysis, Insights and Forecast - by Raw Material Type
- 8. Nigeria MEA Epoxy Resin Industry Analysis, Insights and Forecast, 2019-2031
- 8.1. Market Analysis, Insights and Forecast - by Raw Material Type
- 8.1.1. DGBEA (Bisphenol A and ECH)
- 8.1.2. DGBEF (Bisphenol F and ECH)
- 8.1.3. Novolac Epoxy (Formaldehyde and Phenols)
- 8.1.4. Aliphatic Epoxy Resins (Aliphatic Alcohols)
- 8.1.5. Glycidyl
- 8.1.6. Other Raw Material Types
- 8.2. Market Analysis, Insights and Forecast - by Application
- 8.2.1. Paints and Coatings
- 8.2.2. Adhesives
- 8.2.3. Composites
- 8.2.4. Electrical and Electronics
- 8.2.5. Wind Turbines
- 8.2.6. Other Applications
- 8.3. Market Analysis, Insights and Forecast - by Geography
- 8.3.1. Saudi Arabia
- 8.3.2. South Africa
- 8.3.3. Nigeria
- 8.3.4. Kuwait
- 8.3.5. United Arab Emirates
- 8.3.6. Rest of Middle-East and Africa
- 8.1. Market Analysis, Insights and Forecast - by Raw Material Type
- 9. Kuwait MEA Epoxy Resin Industry Analysis, Insights and Forecast, 2019-2031
- 9.1. Market Analysis, Insights and Forecast - by Raw Material Type
- 9.1.1. DGBEA (Bisphenol A and ECH)
- 9.1.2. DGBEF (Bisphenol F and ECH)
- 9.1.3. Novolac Epoxy (Formaldehyde and Phenols)
- 9.1.4. Aliphatic Epoxy Resins (Aliphatic Alcohols)
- 9.1.5. Glycidyl
- 9.1.6. Other Raw Material Types
- 9.2. Market Analysis, Insights and Forecast - by Application
- 9.2.1. Paints and Coatings
- 9.2.2. Adhesives
- 9.2.3. Composites
- 9.2.4. Electrical and Electronics
- 9.2.5. Wind Turbines
- 9.2.6. Other Applications
- 9.3. Market Analysis, Insights and Forecast - by Geography
- 9.3.1. Saudi Arabia
- 9.3.2. South Africa
- 9.3.3. Nigeria
- 9.3.4. Kuwait
- 9.3.5. United Arab Emirates
- 9.3.6. Rest of Middle-East and Africa
- 9.1. Market Analysis, Insights and Forecast - by Raw Material Type
- 10. United Arab Emirates MEA Epoxy Resin Industry Analysis, Insights and Forecast, 2019-2031
- 10.1. Market Analysis, Insights and Forecast - by Raw Material Type
- 10.1.1. DGBEA (Bisphenol A and ECH)
- 10.1.2. DGBEF (Bisphenol F and ECH)
- 10.1.3. Novolac Epoxy (Formaldehyde and Phenols)
- 10.1.4. Aliphatic Epoxy Resins (Aliphatic Alcohols)
- 10.1.5. Glycidyl
- 10.1.6. Other Raw Material Types
- 10.2. Market Analysis, Insights and Forecast - by Application
- 10.2.1. Paints and Coatings
- 10.2.2. Adhesives
- 10.2.3. Composites
- 10.2.4. Electrical and Electronics
- 10.2.5. Wind Turbines
- 10.2.6. Other Applications
- 10.3. Market Analysis, Insights and Forecast - by Geography
- 10.3.1. Saudi Arabia
- 10.3.2. South Africa
- 10.3.3. Nigeria
- 10.3.4. Kuwait
- 10.3.5. United Arab Emirates
- 10.3.6. Rest of Middle-East and Africa
- 10.1. Market Analysis, Insights and Forecast - by Raw Material Type
- 11. Rest of Middle East and Africa MEA Epoxy Resin Industry Analysis, Insights and Forecast, 2019-2031
- 11.1. Market Analysis, Insights and Forecast - by Raw Material Type
- 11.1.1. DGBEA (Bisphenol A and ECH)
- 11.1.2. DGBEF (Bisphenol F and ECH)
- 11.1.3. Novolac Epoxy (Formaldehyde and Phenols)
- 11.1.4. Aliphatic Epoxy Resins (Aliphatic Alcohols)
- 11.1.5. Glycidyl
- 11.1.6. Other Raw Material Types
- 11.2. Market Analysis, Insights and Forecast - by Application
- 11.2.1. Paints and Coatings
- 11.2.2. Adhesives
- 11.2.3. Composites
- 11.2.4. Electrical and Electronics
- 11.2.5. Wind Turbines
- 11.2.6. Other Applications
- 11.3. Market Analysis, Insights and Forecast - by Geography
- 11.3.1. Saudi Arabia
- 11.3.2. South Africa
- 11.3.3. Nigeria
- 11.3.4. Kuwait
- 11.3.5. United Arab Emirates
- 11.3.6. Rest of Middle-East and Africa
- 11.1. Market Analysis, Insights and Forecast - by Raw Material Type
- 12. North America MEA Epoxy Resin Industry Analysis, Insights and Forecast, 2019-2031
- 12.1. Market Analysis, Insights and Forecast - By Country/Sub-region
- 12.1.1 United States
- 12.1.2 Canada
- 12.1.3 Mexico
- 13. Europe MEA Epoxy Resin Industry Analysis, Insights and Forecast, 2019-2031
- 13.1. Market Analysis, Insights and Forecast - By Country/Sub-region
- 13.1.1 Germany
- 13.1.2 United Kingdom
- 13.1.3 France
- 13.1.4 Spain
- 13.1.5 Italy
- 13.1.6 Spain
- 13.1.7 Belgium
- 13.1.8 Netherland
- 13.1.9 Nordics
- 13.1.10 Rest of Europe
- 14. Asia Pacific MEA Epoxy Resin Industry Analysis, Insights and Forecast, 2019-2031
- 14.1. Market Analysis, Insights and Forecast - By Country/Sub-region
- 14.1.1 China
- 14.1.2 Japan
- 14.1.3 India
- 14.1.4 South Korea
- 14.1.5 Southeast Asia
- 14.1.6 Australia
- 14.1.7 Indonesia
- 14.1.8 Phillipes
- 14.1.9 Singapore
- 14.1.10 Thailandc
- 14.1.11 Rest of Asia Pacific
- 15. South America MEA Epoxy Resin Industry Analysis, Insights and Forecast, 2019-2031
- 15.1. Market Analysis, Insights and Forecast - By Country/Sub-region
- 15.1.1 Brazil
- 15.1.2 Argentina
- 15.1.3 Peru
- 15.1.4 Chile
- 15.1.5 Colombia
- 15.1.6 Ecuador
- 15.1.7 Venezuela
- 15.1.8 Rest of South America
- 16. North America MEA Epoxy Resin Industry Analysis, Insights and Forecast, 2019-2031
- 16.1. Market Analysis, Insights and Forecast - By Country/Sub-region
- 16.1.1 United States
- 16.1.2 Canada
- 16.1.3 Mexico
- 17. MEA MEA Epoxy Resin Industry Analysis, Insights and Forecast, 2019-2031
- 17.1. Market Analysis, Insights and Forecast - By Country/Sub-region
- 17.1.1 United Arab Emirates
- 17.1.2 Saudi Arabia
- 17.1.3 South Africa
- 17.1.4 Rest of Middle East and Africa
- 18. Competitive Analysis
- 18.1. Global Market Share Analysis 2024
- 18.2. Company Profiles
- 18.2.1 Huntsman Corporation LLC
- 18.2.1.1. Overview
- 18.2.1.2. Products
- 18.2.1.3. SWOT Analysis
- 18.2.1.4. Recent Developments
- 18.2.1.5. Financials (Based on Availability)
- 18.2.2 NAMA Chemicals
- 18.2.2.1. Overview
- 18.2.2.2. Products
- 18.2.2.3. SWOT Analysis
- 18.2.2.4. Recent Developments
- 18.2.2.5. Financials (Based on Availability)
- 18.2.3 3M
- 18.2.3.1. Overview
- 18.2.3.2. Products
- 18.2.3.3. SWOT Analysis
- 18.2.3.4. Recent Developments
- 18.2.3.5. Financials (Based on Availability)
- 18.2.4 BASF SE
- 18.2.4.1. Overview
- 18.2.4.2. Products
- 18.2.4.3. SWOT Analysis
- 18.2.4.4. Recent Developments
- 18.2.4.5. Financials (Based on Availability)
- 18.2.5 Dow
- 18.2.5.1. Overview
- 18.2.5.2. Products
- 18.2.5.3. SWOT Analysis
- 18.2.5.4. Recent Developments
- 18.2.5.5. Financials (Based on Availability)
- 18.2.6 Aditya Birla Chemicals
- 18.2.6.1. Overview
- 18.2.6.2. Products
- 18.2.6.3. SWOT Analysis
- 18.2.6.4. Recent Developments
- 18.2.6.5. Financials (Based on Availability)
- 18.2.7 Daicel Corporation
- 18.2.7.1. Overview
- 18.2.7.2. Products
- 18.2.7.3. SWOT Analysis
- 18.2.7.4. Recent Developments
- 18.2.7.5. Financials (Based on Availability)
- 18.2.8 Hexion
- 18.2.8.1. Overview
- 18.2.8.2. Products
- 18.2.8.3. SWOT Analysis
- 18.2.8.4. Recent Developments
- 18.2.8.5. Financials (Based on Availability)
- 18.2.9 Olin Corporation*List Not Exhaustive
- 18.2.9.1. Overview
- 18.2.9.2. Products
- 18.2.9.3. SWOT Analysis
- 18.2.9.4. Recent Developments
- 18.2.9.5. Financials (Based on Availability)
- 18.2.10 NAN YA PLASTICS CORPORATION
- 18.2.10.1. Overview
- 18.2.10.2. Products
- 18.2.10.3. SWOT Analysis
- 18.2.10.4. Recent Developments
- 18.2.10.5. Financials (Based on Availability)
- 18.2.1 Huntsman Corporation LLC
List of Figures
- Figure 1: Global MEA Epoxy Resin Industry Revenue Breakdown (Million, %) by Region 2024 & 2032
- Figure 2: North America MEA Epoxy Resin Industry Revenue (Million), by Country 2024 & 2032
- Figure 3: North America MEA Epoxy Resin Industry Revenue Share (%), by Country 2024 & 2032
- Figure 4: Europe MEA Epoxy Resin Industry Revenue (Million), by Country 2024 & 2032
- Figure 5: Europe MEA Epoxy Resin Industry Revenue Share (%), by Country 2024 & 2032
- Figure 6: Asia Pacific MEA Epoxy Resin Industry Revenue (Million), by Country 2024 & 2032
- Figure 7: Asia Pacific MEA Epoxy Resin Industry Revenue Share (%), by Country 2024 & 2032
- Figure 8: South America MEA Epoxy Resin Industry Revenue (Million), by Country 2024 & 2032
- Figure 9: South America MEA Epoxy Resin Industry Revenue Share (%), by Country 2024 & 2032
- Figure 10: North America MEA Epoxy Resin Industry Revenue (Million), by Country 2024 & 2032
- Figure 11: North America MEA Epoxy Resin Industry Revenue Share (%), by Country 2024 & 2032
- Figure 12: MEA MEA Epoxy Resin Industry Revenue (Million), by Country 2024 & 2032
- Figure 13: MEA MEA Epoxy Resin Industry Revenue Share (%), by Country 2024 & 2032
- Figure 14: Saudi Arabia MEA Epoxy Resin Industry Revenue (Million), by Raw Material Type 2024 & 2032
- Figure 15: Saudi Arabia MEA Epoxy Resin Industry Revenue Share (%), by Raw Material Type 2024 & 2032
- Figure 16: Saudi Arabia MEA Epoxy Resin Industry Revenue (Million), by Application 2024 & 2032
- Figure 17: Saudi Arabia MEA Epoxy Resin Industry Revenue Share (%), by Application 2024 & 2032
- Figure 18: Saudi Arabia MEA Epoxy Resin Industry Revenue (Million), by Geography 2024 & 2032
- Figure 19: Saudi Arabia MEA Epoxy Resin Industry Revenue Share (%), by Geography 2024 & 2032
- Figure 20: Saudi Arabia MEA Epoxy Resin Industry Revenue (Million), by Country 2024 & 2032
- Figure 21: Saudi Arabia MEA Epoxy Resin Industry Revenue Share (%), by Country 2024 & 2032
- Figure 22: South Africa MEA Epoxy Resin Industry Revenue (Million), by Raw Material Type 2024 & 2032
- Figure 23: South Africa MEA Epoxy Resin Industry Revenue Share (%), by Raw Material Type 2024 & 2032
- Figure 24: South Africa MEA Epoxy Resin Industry Revenue (Million), by Application 2024 & 2032
- Figure 25: South Africa MEA Epoxy Resin Industry Revenue Share (%), by Application 2024 & 2032
- Figure 26: South Africa MEA Epoxy Resin Industry Revenue (Million), by Geography 2024 & 2032
- Figure 27: South Africa MEA Epoxy Resin Industry Revenue Share (%), by Geography 2024 & 2032
- Figure 28: South Africa MEA Epoxy Resin Industry Revenue (Million), by Country 2024 & 2032
- Figure 29: South Africa MEA Epoxy Resin Industry Revenue Share (%), by Country 2024 & 2032
- Figure 30: Nigeria MEA Epoxy Resin Industry Revenue (Million), by Raw Material Type 2024 & 2032
- Figure 31: Nigeria MEA Epoxy Resin Industry Revenue Share (%), by Raw Material Type 2024 & 2032
- Figure 32: Nigeria MEA Epoxy Resin Industry Revenue (Million), by Application 2024 & 2032
- Figure 33: Nigeria MEA Epoxy Resin Industry Revenue Share (%), by Application 2024 & 2032
- Figure 34: Nigeria MEA Epoxy Resin Industry Revenue (Million), by Geography 2024 & 2032
- Figure 35: Nigeria MEA Epoxy Resin Industry Revenue Share (%), by Geography 2024 & 2032
- Figure 36: Nigeria MEA Epoxy Resin Industry Revenue (Million), by Country 2024 & 2032
- Figure 37: Nigeria MEA Epoxy Resin Industry Revenue Share (%), by Country 2024 & 2032
- Figure 38: Kuwait MEA Epoxy Resin Industry Revenue (Million), by Raw Material Type 2024 & 2032
- Figure 39: Kuwait MEA Epoxy Resin Industry Revenue Share (%), by Raw Material Type 2024 & 2032
- Figure 40: Kuwait MEA Epoxy Resin Industry Revenue (Million), by Application 2024 & 2032
- Figure 41: Kuwait MEA Epoxy Resin Industry Revenue Share (%), by Application 2024 & 2032
- Figure 42: Kuwait MEA Epoxy Resin Industry Revenue (Million), by Geography 2024 & 2032
- Figure 43: Kuwait MEA Epoxy Resin Industry Revenue Share (%), by Geography 2024 & 2032
- Figure 44: Kuwait MEA Epoxy Resin Industry Revenue (Million), by Country 2024 & 2032
- Figure 45: Kuwait MEA Epoxy Resin Industry Revenue Share (%), by Country 2024 & 2032
- Figure 46: United Arab Emirates MEA Epoxy Resin Industry Revenue (Million), by Raw Material Type 2024 & 2032
- Figure 47: United Arab Emirates MEA Epoxy Resin Industry Revenue Share (%), by Raw Material Type 2024 & 2032
- Figure 48: United Arab Emirates MEA Epoxy Resin Industry Revenue (Million), by Application 2024 & 2032
- Figure 49: United Arab Emirates MEA Epoxy Resin Industry Revenue Share (%), by Application 2024 & 2032
- Figure 50: United Arab Emirates MEA Epoxy Resin Industry Revenue (Million), by Geography 2024 & 2032
- Figure 51: United Arab Emirates MEA Epoxy Resin Industry Revenue Share (%), by Geography 2024 & 2032
- Figure 52: United Arab Emirates MEA Epoxy Resin Industry Revenue (Million), by Country 2024 & 2032
- Figure 53: United Arab Emirates MEA Epoxy Resin Industry Revenue Share (%), by Country 2024 & 2032
- Figure 54: Rest of Middle East and Africa MEA Epoxy Resin Industry Revenue (Million), by Raw Material Type 2024 & 2032
- Figure 55: Rest of Middle East and Africa MEA Epoxy Resin Industry Revenue Share (%), by Raw Material Type 2024 & 2032
- Figure 56: Rest of Middle East and Africa MEA Epoxy Resin Industry Revenue (Million), by Application 2024 & 2032
- Figure 57: Rest of Middle East and Africa MEA Epoxy Resin Industry Revenue Share (%), by Application 2024 & 2032
- Figure 58: Rest of Middle East and Africa MEA Epoxy Resin Industry Revenue (Million), by Geography 2024 & 2032
- Figure 59: Rest of Middle East and Africa MEA Epoxy Resin Industry Revenue Share (%), by Geography 2024 & 2032
- Figure 60: Rest of Middle East and Africa MEA Epoxy Resin Industry Revenue (Million), by Country 2024 & 2032
- Figure 61: Rest of Middle East and Africa MEA Epoxy Resin Industry Revenue Share (%), by Country 2024 & 2032
List of Tables
- Table 1: Global MEA Epoxy Resin Industry Revenue Million Forecast, by Region 2019 & 2032
- Table 2: Global MEA Epoxy Resin Industry Revenue Million Forecast, by Raw Material Type 2019 & 2032
- Table 3: Global MEA Epoxy Resin Industry Revenue Million Forecast, by Application 2019 & 2032
- Table 4: Global MEA Epoxy Resin Industry Revenue Million Forecast, by Geography 2019 & 2032
- Table 5: Global MEA Epoxy Resin Industry Revenue Million Forecast, by Region 2019 & 2032
- Table 6: Global MEA Epoxy Resin Industry Revenue Million Forecast, by Country 2019 & 2032
- Table 7: United States MEA Epoxy Resin Industry Revenue (Million) Forecast, by Application 2019 & 2032
- Table 8: Canada MEA Epoxy Resin Industry Revenue (Million) Forecast, by Application 2019 & 2032
- Table 9: Mexico MEA Epoxy Resin Industry Revenue (Million) Forecast, by Application 2019 & 2032
- Table 10: Global MEA Epoxy Resin Industry Revenue Million Forecast, by Country 2019 & 2032
- Table 11: Germany MEA Epoxy Resin Industry Revenue (Million) Forecast, by Application 2019 & 2032
- Table 12: United Kingdom MEA Epoxy Resin Industry Revenue (Million) Forecast, by Application 2019 & 2032
- Table 13: France MEA Epoxy Resin Industry Revenue (Million) Forecast, by Application 2019 & 2032
- Table 14: Spain MEA Epoxy Resin Industry Revenue (Million) Forecast, by Application 2019 & 2032
- Table 15: Italy MEA Epoxy Resin Industry Revenue (Million) Forecast, by Application 2019 & 2032
- Table 16: Spain MEA Epoxy Resin Industry Revenue (Million) Forecast, by Application 2019 & 2032
- Table 17: Belgium MEA Epoxy Resin Industry Revenue (Million) Forecast, by Application 2019 & 2032
- Table 18: Netherland MEA Epoxy Resin Industry Revenue (Million) Forecast, by Application 2019 & 2032
- Table 19: Nordics MEA Epoxy Resin Industry Revenue (Million) Forecast, by Application 2019 & 2032
- Table 20: Rest of Europe MEA Epoxy Resin Industry Revenue (Million) Forecast, by Application 2019 & 2032
- Table 21: Global MEA Epoxy Resin Industry Revenue Million Forecast, by Country 2019 & 2032
- Table 22: China MEA Epoxy Resin Industry Revenue (Million) Forecast, by Application 2019 & 2032
- Table 23: Japan MEA Epoxy Resin Industry Revenue (Million) Forecast, by Application 2019 & 2032
- Table 24: India MEA Epoxy Resin Industry Revenue (Million) Forecast, by Application 2019 & 2032
- Table 25: South Korea MEA Epoxy Resin Industry Revenue (Million) Forecast, by Application 2019 & 2032
- Table 26: Southeast Asia MEA Epoxy Resin Industry Revenue (Million) Forecast, by Application 2019 & 2032
- Table 27: Australia MEA Epoxy Resin Industry Revenue (Million) Forecast, by Application 2019 & 2032
- Table 28: Indonesia MEA Epoxy Resin Industry Revenue (Million) Forecast, by Application 2019 & 2032
- Table 29: Phillipes MEA Epoxy Resin Industry Revenue (Million) Forecast, by Application 2019 & 2032
- Table 30: Singapore MEA Epoxy Resin Industry Revenue (Million) Forecast, by Application 2019 & 2032
- Table 31: Thailandc MEA Epoxy Resin Industry Revenue (Million) Forecast, by Application 2019 & 2032
- Table 32: Rest of Asia Pacific MEA Epoxy Resin Industry Revenue (Million) Forecast, by Application 2019 & 2032
- Table 33: Global MEA Epoxy Resin Industry Revenue Million Forecast, by Country 2019 & 2032
- Table 34: Brazil MEA Epoxy Resin Industry Revenue (Million) Forecast, by Application 2019 & 2032
- Table 35: Argentina MEA Epoxy Resin Industry Revenue (Million) Forecast, by Application 2019 & 2032
- Table 36: Peru MEA Epoxy Resin Industry Revenue (Million) Forecast, by Application 2019 & 2032
- Table 37: Chile MEA Epoxy Resin Industry Revenue (Million) Forecast, by Application 2019 & 2032
- Table 38: Colombia MEA Epoxy Resin Industry Revenue (Million) Forecast, by Application 2019 & 2032
- Table 39: Ecuador MEA Epoxy Resin Industry Revenue (Million) Forecast, by Application 2019 & 2032
- Table 40: Venezuela MEA Epoxy Resin Industry Revenue (Million) Forecast, by Application 2019 & 2032
- Table 41: Rest of South America MEA Epoxy Resin Industry Revenue (Million) Forecast, by Application 2019 & 2032
- Table 42: Global MEA Epoxy Resin Industry Revenue Million Forecast, by Country 2019 & 2032
- Table 43: United States MEA Epoxy Resin Industry Revenue (Million) Forecast, by Application 2019 & 2032
- Table 44: Canada MEA Epoxy Resin Industry Revenue (Million) Forecast, by Application 2019 & 2032
- Table 45: Mexico MEA Epoxy Resin Industry Revenue (Million) Forecast, by Application 2019 & 2032
- Table 46: Global MEA Epoxy Resin Industry Revenue Million Forecast, by Country 2019 & 2032
- Table 47: United Arab Emirates MEA Epoxy Resin Industry Revenue (Million) Forecast, by Application 2019 & 2032
- Table 48: Saudi Arabia MEA Epoxy Resin Industry Revenue (Million) Forecast, by Application 2019 & 2032
- Table 49: South Africa MEA Epoxy Resin Industry Revenue (Million) Forecast, by Application 2019 & 2032
- Table 50: Rest of Middle East and Africa MEA Epoxy Resin Industry Revenue (Million) Forecast, by Application 2019 & 2032
- Table 51: Global MEA Epoxy Resin Industry Revenue Million Forecast, by Raw Material Type 2019 & 2032
- Table 52: Global MEA Epoxy Resin Industry Revenue Million Forecast, by Application 2019 & 2032
- Table 53: Global MEA Epoxy Resin Industry Revenue Million Forecast, by Geography 2019 & 2032
- Table 54: Global MEA Epoxy Resin Industry Revenue Million Forecast, by Country 2019 & 2032
- Table 55: Global MEA Epoxy Resin Industry Revenue Million Forecast, by Raw Material Type 2019 & 2032
- Table 56: Global MEA Epoxy Resin Industry Revenue Million Forecast, by Application 2019 & 2032
- Table 57: Global MEA Epoxy Resin Industry Revenue Million Forecast, by Geography 2019 & 2032
- Table 58: Global MEA Epoxy Resin Industry Revenue Million Forecast, by Country 2019 & 2032
- Table 59: Global MEA Epoxy Resin Industry Revenue Million Forecast, by Raw Material Type 2019 & 2032
- Table 60: Global MEA Epoxy Resin Industry Revenue Million Forecast, by Application 2019 & 2032
- Table 61: Global MEA Epoxy Resin Industry Revenue Million Forecast, by Geography 2019 & 2032
- Table 62: Global MEA Epoxy Resin Industry Revenue Million Forecast, by Country 2019 & 2032
- Table 63: Global MEA Epoxy Resin Industry Revenue Million Forecast, by Raw Material Type 2019 & 2032
- Table 64: Global MEA Epoxy Resin Industry Revenue Million Forecast, by Application 2019 & 2032
- Table 65: Global MEA Epoxy Resin Industry Revenue Million Forecast, by Geography 2019 & 2032
- Table 66: Global MEA Epoxy Resin Industry Revenue Million Forecast, by Country 2019 & 2032
- Table 67: Global MEA Epoxy Resin Industry Revenue Million Forecast, by Raw Material Type 2019 & 2032
- Table 68: Global MEA Epoxy Resin Industry Revenue Million Forecast, by Application 2019 & 2032
- Table 69: Global MEA Epoxy Resin Industry Revenue Million Forecast, by Geography 2019 & 2032
- Table 70: Global MEA Epoxy Resin Industry Revenue Million Forecast, by Country 2019 & 2032
- Table 71: Global MEA Epoxy Resin Industry Revenue Million Forecast, by Raw Material Type 2019 & 2032
- Table 72: Global MEA Epoxy Resin Industry Revenue Million Forecast, by Application 2019 & 2032
- Table 73: Global MEA Epoxy Resin Industry Revenue Million Forecast, by Geography 2019 & 2032
- Table 74: Global MEA Epoxy Resin Industry Revenue Million Forecast, by Country 2019 & 2032
Frequently Asked Questions
1. What is the projected Compound Annual Growth Rate (CAGR) of the MEA Epoxy Resin Industry?
The projected CAGR is approximately > 5.00%.
2. Which companies are prominent players in the MEA Epoxy Resin Industry?
Key companies in the market include Huntsman Corporation LLC, NAMA Chemicals, 3M, BASF SE, Dow, Aditya Birla Chemicals, Daicel Corporation, Hexion, Olin Corporation*List Not Exhaustive, NAN YA PLASTICS CORPORATION.
3. What are the main segments of the MEA Epoxy Resin Industry?
The market segments include Raw Material Type, Application, Geography.
4. Can you provide details about the market size?
The market size is estimated to be USD XX Million as of 2022.
5. What are some drivers contributing to market growth?
; Strong Growth of Construction Industry in Middle East & Africa; Rising Demand for Electrical and Electronic Devices.
6. What are the notable trends driving market growth?
Increasing Demand from Composites.
7. Are there any restraints impacting market growth?
; Hazardous Impact of Epoxy on Health.
8. Can you provide examples of recent developments in the market?
N/A
9. What pricing options are available for accessing the report?
Pricing options include single-user, multi-user, and enterprise licenses priced at USD 4750, USD 5250, and USD 8750 respectively.
10. Is the market size provided in terms of value or volume?
The market size is provided in terms of value, measured in Million.
11. Are there any specific market keywords associated with the report?
Yes, the market keyword associated with the report is "MEA Epoxy Resin Industry," which aids in identifying and referencing the specific market segment covered.
12. How do I determine which pricing option suits my needs best?
The pricing options vary based on user requirements and access needs. Individual users may opt for single-user licenses, while businesses requiring broader access may choose multi-user or enterprise licenses for cost-effective access to the report.
13. Are there any additional resources or data provided in the MEA Epoxy Resin Industry report?
While the report offers comprehensive insights, it's advisable to review the specific contents or supplementary materials provided to ascertain if additional resources or data are available.
14. How can I stay updated on further developments or reports in the MEA Epoxy Resin Industry?
To stay informed about further developments, trends, and reports in the MEA Epoxy Resin Industry, consider subscribing to industry newsletters, following relevant companies and organizations, or regularly checking reputable industry news sources and publications.
Methodology
Step 1 - Identification of Relevant Samples Size from Population Database


Step 2 - Approaches for Defining Global Market Size (Value, Volume* & Price*)

Note*: In applicable scenarios
Step 3 - Data Sources
Primary Research
- Web Analytics
- Survey Reports
- Research Institute
- Latest Research Reports
- Opinion Leaders
Secondary Research
- Annual Reports
- White Paper
- Latest Press Release
- Industry Association
- Paid Database
- Investor Presentations

Step 4 - Data Triangulation
Involves using different sources of information in order to increase the validity of a study
These sources are likely to be stakeholders in a program - participants, other researchers, program staff, other community members, and so on.
Then we put all data in single framework & apply various statistical tools to find out the dynamic on the market.
During the analysis stage, feedback from the stakeholder groups would be compared to determine areas of agreement as well as areas of divergence


