

Key Insights
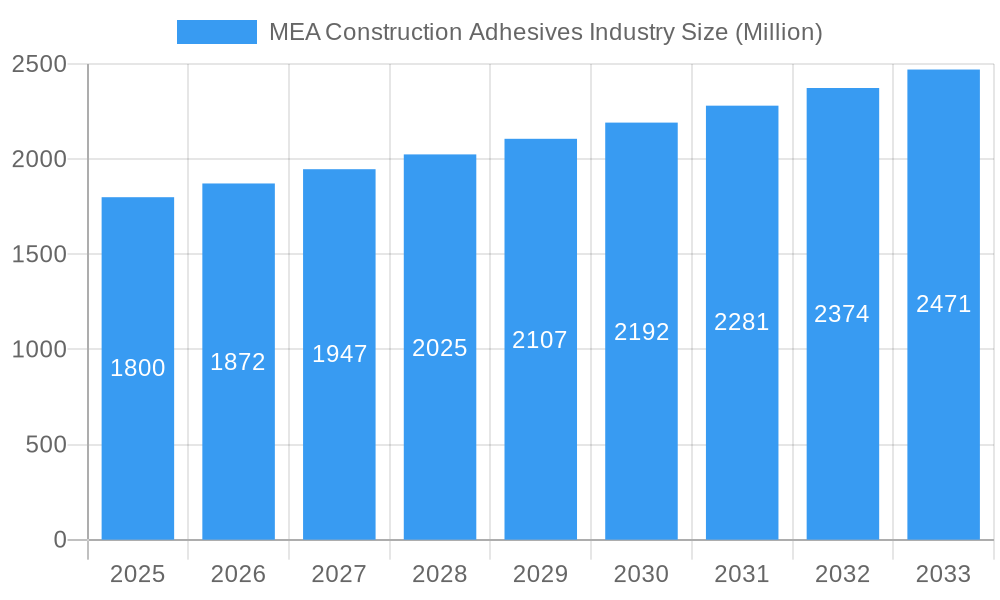
The Middle East and Africa (MEA) Construction Adhesives market is poised for substantial growth, driven by robust construction activity, rapid urbanization, and significant government investments in infrastructure, housing, and commercial developments across key economies like Saudi Arabia and the UAE. The market is projected to reach a size of 10.9 billion by 2024, with an estimated Compound Annual Growth Rate (CAGR) of 5.1. This expansion is supported by the increasing adoption of advanced adhesive technologies, including water-borne and reactive systems, which offer enhanced performance and reduced environmental impact. While the residential construction segment currently dominates, the infrastructure sector presents significant future growth opportunities. However, potential restraints include economic volatility, fluctuating commodity prices, and supply chain disruptions. Success in this dynamic market will hinge on a diversified product portfolio, strategic partnerships, and robust distribution networks.
MEA Construction Adhesives Industry Market Size (In Billion)
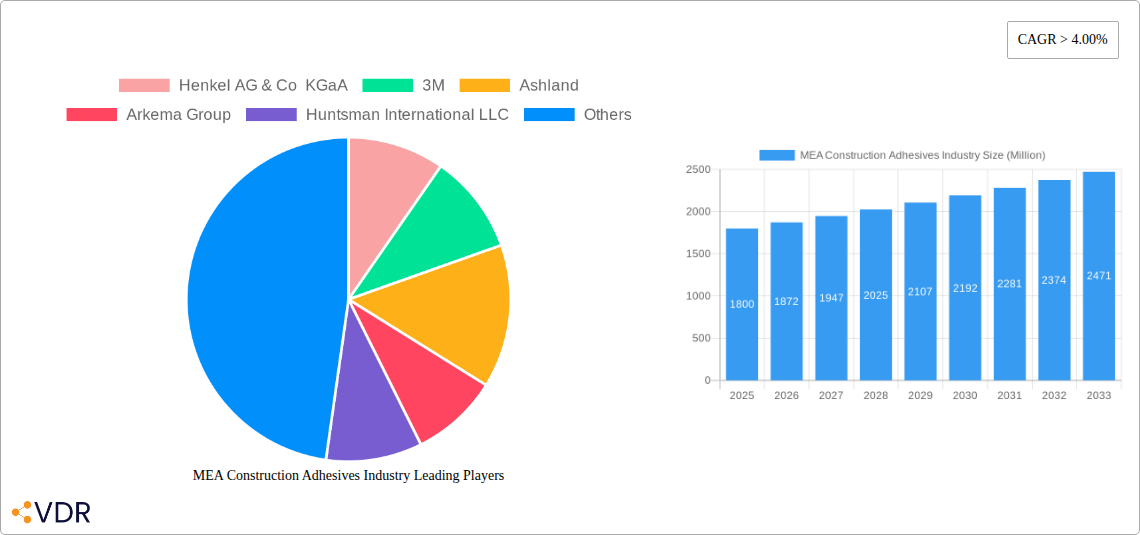
The MEA Construction Adhesives competitive landscape features a mix of global leaders such as Henkel, 3M, and Sika, alongside agile regional players. Market intensity is moderate, presenting opportunities for both established and emerging companies. The penetration of advanced adhesive technologies, emphasizing superior performance and eco-friendly formulations, is expected to rise, propelled by the growing demand for sustainable construction practices. Future market expansion will be contingent upon sustained construction sector stability, supportive government policies for sustainable development, and continuous innovation in adhesive technology. Strategic differentiation through product diversification, resilient supply chain management, and strategic alliances will be paramount for achieving market leadership.
MEA Construction Adhesives Industry Company Market Share
MEA Construction Adhesives Industry: A Comprehensive Market Report (2019-2033)
This comprehensive report provides an in-depth analysis of the Middle East and Africa (MEA) construction adhesives market, offering crucial insights for industry professionals, investors, and strategic decision-makers. The report covers the period from 2019 to 2033, with a focus on the estimated year 2025 and a forecast period spanning 2025-2033. Market values are presented in million units. Key players analyzed include Henkel AG & Co KGaA, 3M, Ashland, Arkema Group, Huntsman International LLC, Dow, H B Fuller Company, Sika AG, AVERY DENNISON CORPORATION, and Wacker Chemie AG (list not exhaustive). The report segments the market by resin type (Acrylics, Epoxy, Polyurethanes, Polyvinyl Acetate (PVA), Silicones, Other Resin Types), technology (Water-borne, Reactive, Hot-melt, Other Technologies), and end-use sector (Residential, Commercial, Infrastructure, Industrial).
MEA Construction Adhesives Industry Market Dynamics & Structure
This section analyzes the MEA construction adhesives market's competitive landscape, technological advancements, and regulatory influences. We examine market concentration, identifying leading players and their respective market share percentages (estimated xx% for Henkel, xx% for 3M, etc. in 2025). The report also explores the impact of technological innovations (e.g., the rise of eco-friendly adhesives), regulatory frameworks (building codes and environmental regulations), and the presence of competitive substitutes (e.g., mechanical fasteners). Furthermore, we delve into the end-user demographics influencing demand and analyze M&A trends within the industry, quantifying deal volumes (estimated xx deals in the past 5 years). Qualitative factors, such as barriers to innovation (e.g., high R&D costs), are also considered.
- Market Concentration: Highly fragmented with a few dominant players.
- Technological Innovation: Driven by sustainability concerns and performance enhancement.
- Regulatory Landscape: Varying regulations across MEA countries influence product development.
- Competitive Substitutes: Mechanical fasteners pose a challenge, particularly in specific applications.
- M&A Activity: Moderate level of consolidation, driven by expansion and technological access.
MEA Construction Adhesives Industry Growth Trends & Insights
This section provides a detailed analysis of the MEA construction adhesives market's growth trajectory, using a combination of quantitative and qualitative data. The market size evolution (from xx million units in 2019 to an estimated xx million units in 2025 and projected xx million units in 2033) is examined, along with adoption rates across different segments. Technological disruptions (e.g., the introduction of advanced polymer chemistries) and shifts in consumer behavior (demand for sustainable and high-performance products) are carefully analyzed. The Compound Annual Growth Rate (CAGR) during the forecast period (2025-2033) is estimated at xx%, with specific market penetration rates detailed for each segment.
Dominant Regions, Countries, or Segments in MEA Construction Adhesives Industry
This section pinpoints the leading regions, countries, and segments within the MEA construction adhesives market driving overall growth. We identify the dominant resin type (e.g., Acrylics holding xx% market share in 2025), dominant technology (e.g., Water-borne adhesives) and the leading end-use sector (e.g., Infrastructure with xx% market share due to large-scale projects). Key drivers for growth in these dominant segments are highlighted, including:
- Economic policies: Government investments in infrastructure projects significantly impact growth.
- Infrastructure development: Rapid urbanization and industrialization fuel demand.
- Construction activity: The volume and type of construction (residential, commercial etc.) directly impact adhesive consumption.
Factors contributing to the dominance of specific regions (e.g., the strong growth in the GCC region due to construction booms) and countries are analyzed, along with their growth potential.
MEA Construction Adhesives Industry Product Landscape
This section describes the range of construction adhesives available in the MEA market. It highlights product innovations, specific applications (e.g., tile adhesives, wood adhesives), and key performance metrics (e.g., bond strength, durability). Unique selling propositions and technological advancements (e.g., improved adhesion properties, faster curing times, and increased sustainability) of leading products are detailed.
Key Drivers, Barriers & Challenges in MEA Construction Adhesives Industry
This section identifies the key factors driving growth and hindering market expansion. Drivers include:
- Infrastructure development: Government investments in large-scale infrastructure projects.
- Technological advancements: The development of high-performance, sustainable adhesives.
- Rising construction activity: A growing population and expanding urban areas increase demand.
Challenges include:
- Supply chain disruptions: Impacts from global events causing material shortages and price fluctuations (quantified by xx% price increase in 2022).
- Regulatory hurdles: Compliance with various building codes and environmental regulations.
- Intense competition: Existing players and new entrants compete on price and quality.
Emerging Opportunities in MEA Construction Adhesives Industry
This section explores promising opportunities for growth, such as:
- Untapped markets: Expanding into less-developed regions within the MEA.
- Innovative applications: Developing new adhesive solutions for specialized construction needs.
- Evolving consumer preferences: Catering to demand for eco-friendly and high-performance products.
Growth Accelerators in the MEA Construction Adhesives Industry
Long-term growth will be fueled by continued infrastructure development, technological advancements (e.g., bio-based adhesives), strategic partnerships (between adhesive manufacturers and construction companies), and market expansion strategies (entry into new regions and sectors).
Key Players Shaping the MEA Construction Adhesives Industry Market
Notable Milestones in MEA Construction Adhesives Industry Sector
- 2021-Q3: Launch of a new eco-friendly adhesive by Sika AG.
- 2022-Q1: Acquisition of a regional adhesive manufacturer by Henkel AG & Co KGaA.
- 2023-Q2: Introduction of a high-performance epoxy adhesive by 3M. (Further milestones will be detailed in the full report)
In-Depth MEA Construction Adhesives Industry Market Outlook
The MEA construction adhesives market is poised for significant growth driven by sustained infrastructure investment, technological innovations focusing on sustainability and high-performance, and the expansion of key players. Strategic opportunities exist in developing specialized adhesives for emerging construction technologies and expanding into less-penetrated markets. The market presents a lucrative environment for both established players and new entrants seeking to capitalize on the region’s dynamic construction sector.
MEA Construction Adhesives Industry Segmentation
-
1. Resin Type
- 1.1. Acrylics
- 1.2. Epoxy
- 1.3. Polyurethanes
- 1.4. Polyvinyl Acetate (PVA)
- 1.5. Silicones
- 1.6. Other Resin Types
-
2. Technology
- 2.1. Water-borne
- 2.2. Reactive
- 2.3. Hot-melt
- 2.4. Other Technologies
-
3. End-use Sector
- 3.1. Residential
- 3.2. Commercial
- 3.3. Infrastructure
- 3.4. Industrial
-
4. Geography
- 4.1. Saudi Arabia
- 4.2. South Africa
- 4.3. Rest of Middle-East and Africa
MEA Construction Adhesives Industry Segmentation By Geography
- 1. Saudi Arabia
- 2. South Africa
- 3. Rest of Middle East and Africa
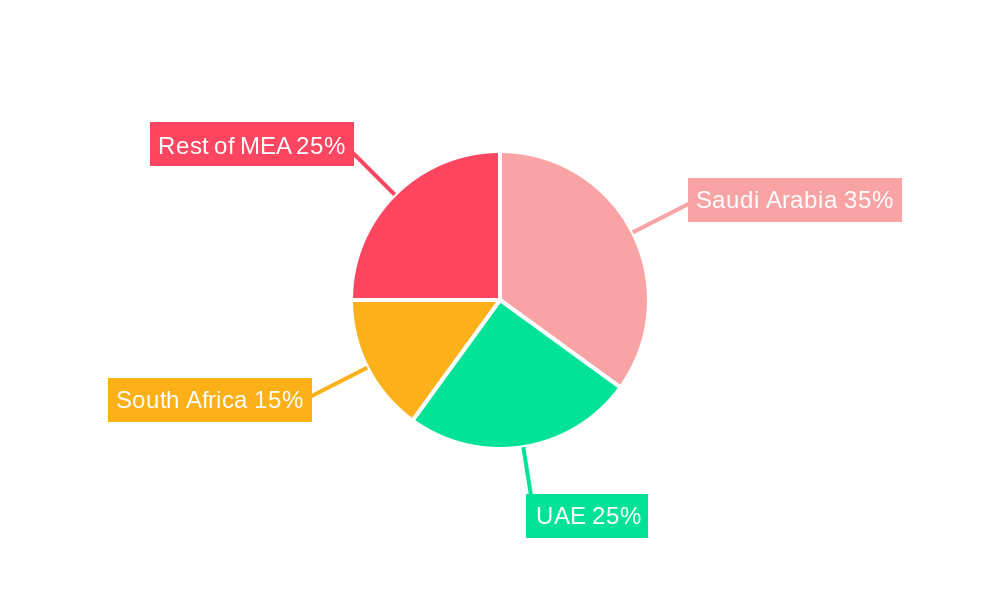
MEA Construction Adhesives Industry Regional Market Share
Geographic Coverage of MEA Construction Adhesives Industry
MEA Construction Adhesives Industry REPORT HIGHLIGHTS
| Aspects | Details |
|---|---|
| Study Period | 2020-2034 |
| Base Year | 2025 |
| Estimated Year | 2026 |
| Forecast Period | 2026-2034 |
| Historical Period | 2020-2025 |
| Growth Rate | CAGR of 5.1% from 2020-2034 |
| Segmentation |
|
Table of Contents
- 1. Introduction
- 1.1. Research Scope
- 1.2. Market Segmentation
- 1.3. Research Objective
- 1.4. Definitions and Assumptions
- 2. Executive Summary
- 2.1. Market Snapshot
- 3. Market Dynamics
- 3.1. Market Drivers
- 3.2. Market Restrains
- 3.3. Market Trends
- 3.4. Market Opportunities
- 4. Market Factor Analysis
- 4.1. Porters Five Forces
- 4.1.1. Bargaining Power of Suppliers
- 4.1.2. Bargaining Power of Buyers
- 4.1.3. Threat of New Entrants
- 4.1.4. Threat of Substitutes
- 4.1.5. Competitive Rivalry
- 4.2. PESTEL analysis
- 4.3. BCG Analysis
- 4.3.1. Stars (High Growth, High Market Share)
- 4.3.2. Cash Cows (Low Growth, High Market Share)
- 4.3.3. Question Mark (High Growth, Low Market Share)
- 4.3.4. Dogs (Low Growth, Low Market Share)
- 4.4. Ansoff Matrix Analysis
- 4.5. Supply Chain Analysis
- 4.6. Regulatory Landscape
- 4.7. Current Market Potential and Opportunity Assessment (TAM–SAM–SOM Framework)
- 4.8. VDR Analyst Note
- 4.1. Porters Five Forces
- 5. Market Analysis, Insights and Forecast 2021-2033
- 5.1. Market Analysis, Insights and Forecast - by Resin Type
- 5.1.1. Acrylics
- 5.1.2. Epoxy
- 5.1.3. Polyurethanes
- 5.1.4. Polyvinyl Acetate (PVA)
- 5.1.5. Silicones
- 5.1.6. Other Resin Types
- 5.2. Market Analysis, Insights and Forecast - by Technology
- 5.2.1. Water-borne
- 5.2.2. Reactive
- 5.2.3. Hot-melt
- 5.2.4. Other Technologies
- 5.3. Market Analysis, Insights and Forecast - by End-use Sector
- 5.3.1. Residential
- 5.3.2. Commercial
- 5.3.3. Infrastructure
- 5.3.4. Industrial
- 5.4. Market Analysis, Insights and Forecast - by Geography
- 5.4.1. Saudi Arabia
- 5.4.2. South Africa
- 5.4.3. Rest of Middle-East and Africa
- 5.5. Market Analysis, Insights and Forecast - by Region
- 5.5.1. Saudi Arabia
- 5.5.2. South Africa
- 5.5.3. Rest of Middle East and Africa
- 5.1. Market Analysis, Insights and Forecast - by Resin Type
- 6. Global MEA Construction Adhesives Industry Analysis, Insights and Forecast, 2021-2033
- 6.1. Market Analysis, Insights and Forecast - by Resin Type
- 6.1.1. Acrylics
- 6.1.2. Epoxy
- 6.1.3. Polyurethanes
- 6.1.4. Polyvinyl Acetate (PVA)
- 6.1.5. Silicones
- 6.1.6. Other Resin Types
- 6.2. Market Analysis, Insights and Forecast - by Technology
- 6.2.1. Water-borne
- 6.2.2. Reactive
- 6.2.3. Hot-melt
- 6.2.4. Other Technologies
- 6.3. Market Analysis, Insights and Forecast - by End-use Sector
- 6.3.1. Residential
- 6.3.2. Commercial
- 6.3.3. Infrastructure
- 6.3.4. Industrial
- 6.4. Market Analysis, Insights and Forecast - by Geography
- 6.4.1. Saudi Arabia
- 6.4.2. South Africa
- 6.4.3. Rest of Middle-East and Africa
- 6.1. Market Analysis, Insights and Forecast - by Resin Type
- 7. Saudi Arabia MEA Construction Adhesives Industry Analysis, Insights and Forecast, 2021-2033
- 7.1. Market Analysis, Insights and Forecast - by Resin Type
- 7.1.1. Acrylics
- 7.1.2. Epoxy
- 7.1.3. Polyurethanes
- 7.1.4. Polyvinyl Acetate (PVA)
- 7.1.5. Silicones
- 7.1.6. Other Resin Types
- 7.2. Market Analysis, Insights and Forecast - by Technology
- 7.2.1. Water-borne
- 7.2.2. Reactive
- 7.2.3. Hot-melt
- 7.2.4. Other Technologies
- 7.3. Market Analysis, Insights and Forecast - by End-use Sector
- 7.3.1. Residential
- 7.3.2. Commercial
- 7.3.3. Infrastructure
- 7.3.4. Industrial
- 7.4. Market Analysis, Insights and Forecast - by Geography
- 7.4.1. Saudi Arabia
- 7.4.2. South Africa
- 7.4.3. Rest of Middle-East and Africa
- 7.1. Market Analysis, Insights and Forecast - by Resin Type
- 8. South Africa MEA Construction Adhesives Industry Analysis, Insights and Forecast, 2021-2033
- 8.1. Market Analysis, Insights and Forecast - by Resin Type
- 8.1.1. Acrylics
- 8.1.2. Epoxy
- 8.1.3. Polyurethanes
- 8.1.4. Polyvinyl Acetate (PVA)
- 8.1.5. Silicones
- 8.1.6. Other Resin Types
- 8.2. Market Analysis, Insights and Forecast - by Technology
- 8.2.1. Water-borne
- 8.2.2. Reactive
- 8.2.3. Hot-melt
- 8.2.4. Other Technologies
- 8.3. Market Analysis, Insights and Forecast - by End-use Sector
- 8.3.1. Residential
- 8.3.2. Commercial
- 8.3.3. Infrastructure
- 8.3.4. Industrial
- 8.4. Market Analysis, Insights and Forecast - by Geography
- 8.4.1. Saudi Arabia
- 8.4.2. South Africa
- 8.4.3. Rest of Middle-East and Africa
- 8.1. Market Analysis, Insights and Forecast - by Resin Type
- 9. Rest of Middle East and Africa MEA Construction Adhesives Industry Analysis, Insights and Forecast, 2021-2033
- 9.1. Market Analysis, Insights and Forecast - by Resin Type
- 9.1.1. Acrylics
- 9.1.2. Epoxy
- 9.1.3. Polyurethanes
- 9.1.4. Polyvinyl Acetate (PVA)
- 9.1.5. Silicones
- 9.1.6. Other Resin Types
- 9.2. Market Analysis, Insights and Forecast - by Technology
- 9.2.1. Water-borne
- 9.2.2. Reactive
- 9.2.3. Hot-melt
- 9.2.4. Other Technologies
- 9.3. Market Analysis, Insights and Forecast - by End-use Sector
- 9.3.1. Residential
- 9.3.2. Commercial
- 9.3.3. Infrastructure
- 9.3.4. Industrial
- 9.4. Market Analysis, Insights and Forecast - by Geography
- 9.4.1. Saudi Arabia
- 9.4.2. South Africa
- 9.4.3. Rest of Middle-East and Africa
- 9.1. Market Analysis, Insights and Forecast - by Resin Type
- 10. Competitive Analysis
- 10.1. Company Profiles
- 10.1.1 Henkel AG & Co KGaA
- 10.1.1.1. Company Overview
- 10.1.1.2. Products
- 10.1.1.3. Company Financials
- 10.1.1.4. SWOT Analysis
- 10.1.2 3M
- 10.1.2.1. Company Overview
- 10.1.2.2. Products
- 10.1.2.3. Company Financials
- 10.1.2.4. SWOT Analysis
- 10.1.3 Ashland
- 10.1.3.1. Company Overview
- 10.1.3.2. Products
- 10.1.3.3. Company Financials
- 10.1.3.4. SWOT Analysis
- 10.1.4 Arkema Group
- 10.1.4.1. Company Overview
- 10.1.4.2. Products
- 10.1.4.3. Company Financials
- 10.1.4.4. SWOT Analysis
- 10.1.5 Huntsman International LLC
- 10.1.5.1. Company Overview
- 10.1.5.2. Products
- 10.1.5.3. Company Financials
- 10.1.5.4. SWOT Analysis
- 10.1.6 Dow
- 10.1.6.1. Company Overview
- 10.1.6.2. Products
- 10.1.6.3. Company Financials
- 10.1.6.4. SWOT Analysis
- 10.1.7 H B Fuller Company
- 10.1.7.1. Company Overview
- 10.1.7.2. Products
- 10.1.7.3. Company Financials
- 10.1.7.4. SWOT Analysis
- 10.1.8 Sika AG
- 10.1.8.1. Company Overview
- 10.1.8.2. Products
- 10.1.8.3. Company Financials
- 10.1.8.4. SWOT Analysis
- 10.1.9 AVERY DENNISON CORPORATION
- 10.1.9.1. Company Overview
- 10.1.9.2. Products
- 10.1.9.3. Company Financials
- 10.1.9.4. SWOT Analysis
- 10.1.10 Wacker Chemie AG*List Not Exhaustive
- 10.1.10.1. Company Overview
- 10.1.10.2. Products
- 10.1.10.3. Company Financials
- 10.1.10.4. SWOT Analysis
- 10.1.1 Henkel AG & Co KGaA
- 10.2. Market Entropy
- 10.2.1 Company's Key Areas Served
- 10.2.2 Recent Developments
- 10.3. Company Market Share Analysis 2025
- 10.3.1 Top 5 Companies Market Share Analysis
- 10.3.2 Top 3 Companies Market Share Analysis
- 10.4. List of Potential Customers
- 11. Research Methodology
List of Figures
- Figure 1: Global MEA Construction Adhesives Industry Revenue Breakdown (billion, %) by Region 2025 & 2033
- Figure 2: Saudi Arabia MEA Construction Adhesives Industry Revenue (billion), by Resin Type 2025 & 2033
- Figure 3: Saudi Arabia MEA Construction Adhesives Industry Revenue Share (%), by Resin Type 2025 & 2033
- Figure 4: Saudi Arabia MEA Construction Adhesives Industry Revenue (billion), by Technology 2025 & 2033
- Figure 5: Saudi Arabia MEA Construction Adhesives Industry Revenue Share (%), by Technology 2025 & 2033
- Figure 6: Saudi Arabia MEA Construction Adhesives Industry Revenue (billion), by End-use Sector 2025 & 2033
- Figure 7: Saudi Arabia MEA Construction Adhesives Industry Revenue Share (%), by End-use Sector 2025 & 2033
- Figure 8: Saudi Arabia MEA Construction Adhesives Industry Revenue (billion), by Geography 2025 & 2033
- Figure 9: Saudi Arabia MEA Construction Adhesives Industry Revenue Share (%), by Geography 2025 & 2033
- Figure 10: Saudi Arabia MEA Construction Adhesives Industry Revenue (billion), by Country 2025 & 2033
- Figure 11: Saudi Arabia MEA Construction Adhesives Industry Revenue Share (%), by Country 2025 & 2033
- Figure 12: South Africa MEA Construction Adhesives Industry Revenue (billion), by Resin Type 2025 & 2033
- Figure 13: South Africa MEA Construction Adhesives Industry Revenue Share (%), by Resin Type 2025 & 2033
- Figure 14: South Africa MEA Construction Adhesives Industry Revenue (billion), by Technology 2025 & 2033
- Figure 15: South Africa MEA Construction Adhesives Industry Revenue Share (%), by Technology 2025 & 2033
- Figure 16: South Africa MEA Construction Adhesives Industry Revenue (billion), by End-use Sector 2025 & 2033
- Figure 17: South Africa MEA Construction Adhesives Industry Revenue Share (%), by End-use Sector 2025 & 2033
- Figure 18: South Africa MEA Construction Adhesives Industry Revenue (billion), by Geography 2025 & 2033
- Figure 19: South Africa MEA Construction Adhesives Industry Revenue Share (%), by Geography 2025 & 2033
- Figure 20: South Africa MEA Construction Adhesives Industry Revenue (billion), by Country 2025 & 2033
- Figure 21: South Africa MEA Construction Adhesives Industry Revenue Share (%), by Country 2025 & 2033
- Figure 22: Rest of Middle East and Africa MEA Construction Adhesives Industry Revenue (billion), by Resin Type 2025 & 2033
- Figure 23: Rest of Middle East and Africa MEA Construction Adhesives Industry Revenue Share (%), by Resin Type 2025 & 2033
- Figure 24: Rest of Middle East and Africa MEA Construction Adhesives Industry Revenue (billion), by Technology 2025 & 2033
- Figure 25: Rest of Middle East and Africa MEA Construction Adhesives Industry Revenue Share (%), by Technology 2025 & 2033
- Figure 26: Rest of Middle East and Africa MEA Construction Adhesives Industry Revenue (billion), by End-use Sector 2025 & 2033
- Figure 27: Rest of Middle East and Africa MEA Construction Adhesives Industry Revenue Share (%), by End-use Sector 2025 & 2033
- Figure 28: Rest of Middle East and Africa MEA Construction Adhesives Industry Revenue (billion), by Geography 2025 & 2033
- Figure 29: Rest of Middle East and Africa MEA Construction Adhesives Industry Revenue Share (%), by Geography 2025 & 2033
- Figure 30: Rest of Middle East and Africa MEA Construction Adhesives Industry Revenue (billion), by Country 2025 & 2033
- Figure 31: Rest of Middle East and Africa MEA Construction Adhesives Industry Revenue Share (%), by Country 2025 & 2033
List of Tables
- Table 1: Global MEA Construction Adhesives Industry Revenue billion Forecast, by Resin Type 2020 & 2033
- Table 2: Global MEA Construction Adhesives Industry Revenue billion Forecast, by Technology 2020 & 2033
- Table 3: Global MEA Construction Adhesives Industry Revenue billion Forecast, by End-use Sector 2020 & 2033
- Table 4: Global MEA Construction Adhesives Industry Revenue billion Forecast, by Geography 2020 & 2033
- Table 5: Global MEA Construction Adhesives Industry Revenue billion Forecast, by Region 2020 & 2033
- Table 6: Global MEA Construction Adhesives Industry Revenue billion Forecast, by Resin Type 2020 & 2033
- Table 7: Global MEA Construction Adhesives Industry Revenue billion Forecast, by Technology 2020 & 2033
- Table 8: Global MEA Construction Adhesives Industry Revenue billion Forecast, by End-use Sector 2020 & 2033
- Table 9: Global MEA Construction Adhesives Industry Revenue billion Forecast, by Geography 2020 & 2033
- Table 10: Global MEA Construction Adhesives Industry Revenue billion Forecast, by Country 2020 & 2033
- Table 11: Global MEA Construction Adhesives Industry Revenue billion Forecast, by Resin Type 2020 & 2033
- Table 12: Global MEA Construction Adhesives Industry Revenue billion Forecast, by Technology 2020 & 2033
- Table 13: Global MEA Construction Adhesives Industry Revenue billion Forecast, by End-use Sector 2020 & 2033
- Table 14: Global MEA Construction Adhesives Industry Revenue billion Forecast, by Geography 2020 & 2033
- Table 15: Global MEA Construction Adhesives Industry Revenue billion Forecast, by Country 2020 & 2033
- Table 16: Global MEA Construction Adhesives Industry Revenue billion Forecast, by Resin Type 2020 & 2033
- Table 17: Global MEA Construction Adhesives Industry Revenue billion Forecast, by Technology 2020 & 2033
- Table 18: Global MEA Construction Adhesives Industry Revenue billion Forecast, by End-use Sector 2020 & 2033
- Table 19: Global MEA Construction Adhesives Industry Revenue billion Forecast, by Geography 2020 & 2033
- Table 20: Global MEA Construction Adhesives Industry Revenue billion Forecast, by Country 2020 & 2033
Frequently Asked Questions
1. What is the projected Compound Annual Growth Rate (CAGR) of the MEA Construction Adhesives Industry?
The projected CAGR is approximately 5.1%.
2. Which companies are prominent players in the MEA Construction Adhesives Industry?
Key companies in the market include Henkel AG & Co KGaA, 3M, Ashland, Arkema Group, Huntsman International LLC, Dow, H B Fuller Company, Sika AG, AVERY DENNISON CORPORATION, Wacker Chemie AG*List Not Exhaustive.
3. What are the main segments of the MEA Construction Adhesives Industry?
The market segments include Resin Type, Technology, End-use Sector, Geography.
4. Can you provide details about the market size?
The market size is estimated to be USD 10.9 billion as of 2022.
5. What are some drivers contributing to market growth?
; Rapidly Growing Construction Industry.
6. What are the notable trends driving market growth?
Waterborne Technology to Dominate the Market.
7. Are there any restraints impacting market growth?
; Limited Usage in High End Applications; Other Restraints.
8. Can you provide examples of recent developments in the market?
N/A
9. What pricing options are available for accessing the report?
Pricing options include single-user, multi-user, and enterprise licenses priced at USD 4750, USD 5250, and USD 8750 respectively.
10. Is the market size provided in terms of value or volume?
The market size is provided in terms of value, measured in billion.
11. Are there any specific market keywords associated with the report?
Yes, the market keyword associated with the report is "MEA Construction Adhesives Industry," which aids in identifying and referencing the specific market segment covered.
12. How do I determine which pricing option suits my needs best?
The pricing options vary based on user requirements and access needs. Individual users may opt for single-user licenses, while businesses requiring broader access may choose multi-user or enterprise licenses for cost-effective access to the report.
13. Are there any additional resources or data provided in the MEA Construction Adhesives Industry report?
While the report offers comprehensive insights, it's advisable to review the specific contents or supplementary materials provided to ascertain if additional resources or data are available.
14. How can I stay updated on further developments or reports in the MEA Construction Adhesives Industry?
To stay informed about further developments, trends, and reports in the MEA Construction Adhesives Industry, consider subscribing to industry newsletters, following relevant companies and organizations, or regularly checking reputable industry news sources and publications.
Methodology
Step 1 - Identification of Relevant Samples Size from Population Database


Step 2 - Approaches for Defining Global Market Size (Value, Volume* & Price*)

Note*: In applicable scenarios
Step 3 - Data Sources
Primary Research
- Web Analytics
- Survey Reports
- Research Institute
- Latest Research Reports
- Opinion Leaders
Secondary Research
- Annual Reports
- White Paper
- Latest Press Release
- Industry Association
- Paid Database
- Investor Presentations

Step 4 - Data Triangulation
Involves using different sources of information in order to increase the validity of a study
These sources are likely to be stakeholders in a program - participants, other researchers, program staff, other community members, and so on.
Then we put all data in single framework & apply various statistical tools to find out the dynamic on the market.
During the analysis stage, feedback from the stakeholder groups would be compared to determine areas of agreement as well as areas of divergence