
Key Insights
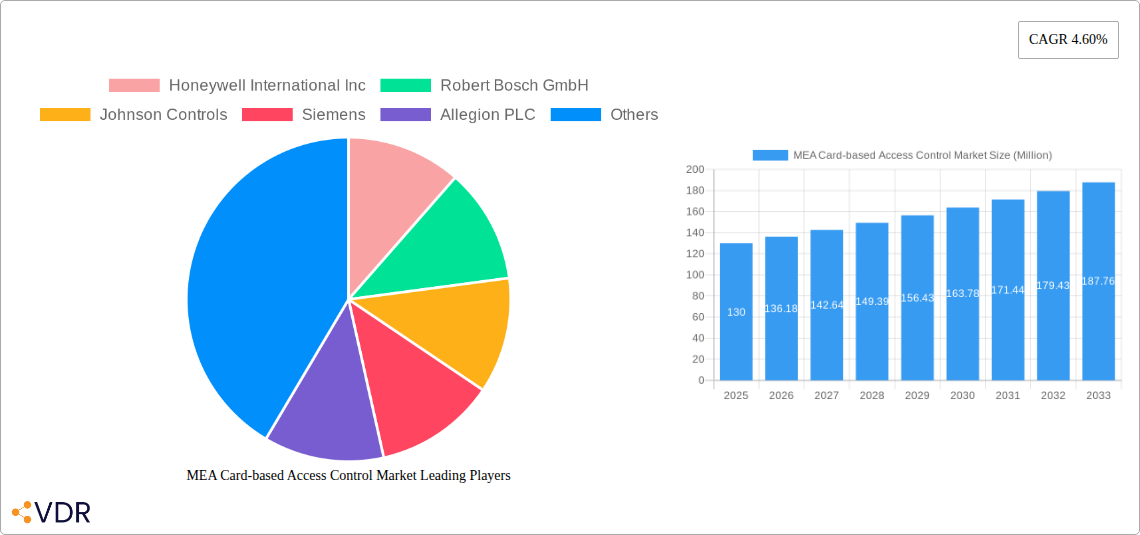
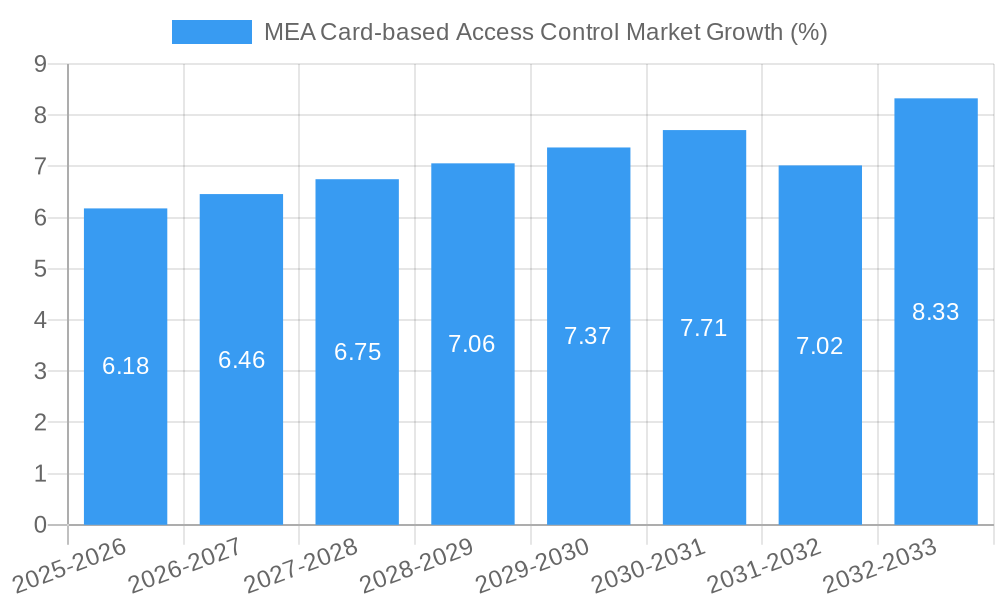
The MEA (Middle East and Africa) card-based access control market, valued at $130 million in 2025, is projected to experience robust growth, driven by increasing security concerns across various sectors, including commercial, residential, and governmental institutions. The market's Compound Annual Growth Rate (CAGR) of 4.60% from 2025 to 2033 indicates a steady expansion, fueled by the rising adoption of smart technologies and the increasing demand for advanced security solutions. Key drivers include the growing urbanization across the region, a surge in construction activities leading to increased security needs in new buildings, and the implementation of stricter government regulations for enhanced security protocols. Furthermore, the rising adoption of cloud-based access control systems and the integration of biometric technologies with card-based systems are contributing to market expansion. While challenges such as high initial investment costs and the potential for cyber security threats exist, the overall market outlook remains positive. The competitive landscape is shaped by key players like Honeywell, Bosch, Johnson Controls, and Siemens, constantly innovating to offer improved security solutions and cater to evolving customer needs. The market is segmented by technology (e.g., proximity cards, smart cards), application (e.g., residential, commercial, government), and region (e.g., specific countries within MEA).
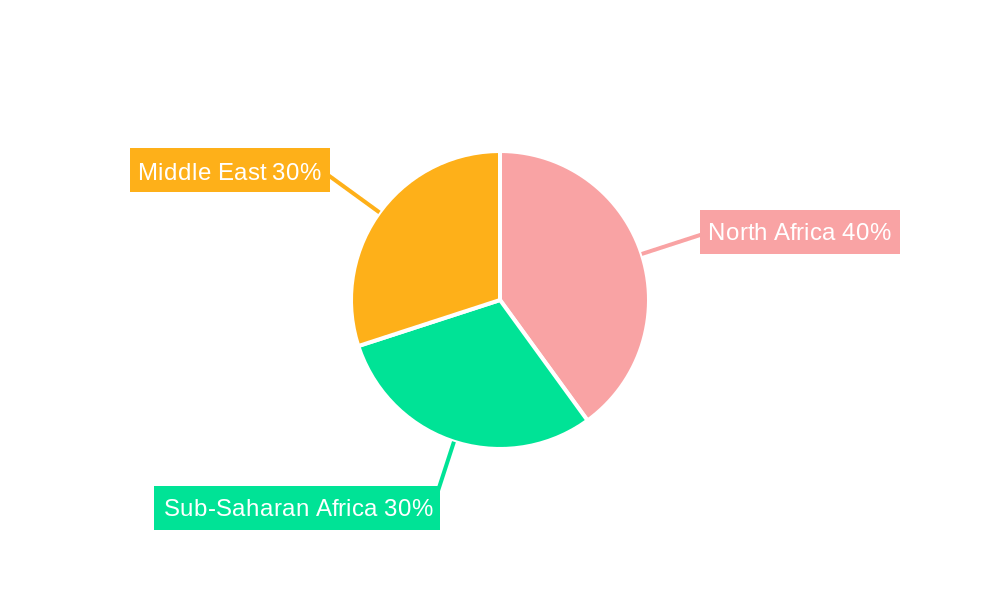
The forecast period (2025-2033) suggests significant potential for market growth, with the expansion likely to be uneven across different MEA nations. Countries experiencing rapid economic development and infrastructure growth are expected to exhibit higher growth rates compared to those with slower economic progress. The market's success is intrinsically linked to continued technological advancements, robust cybersecurity measures, and effective marketing strategies by key players to address existing concerns and highlight the long-term benefits of increased security. Further segmentation of data by specific countries in the MEA region, and a deeper breakdown of technology and application trends, would offer a more granular and insightful analysis.
MEA Card-based Access Control Market: A Comprehensive Report (2019-2033)
This in-depth report provides a comprehensive analysis of the Middle East and Africa (MEA) card-based access control market, encompassing market dynamics, growth trends, regional dominance, product landscape, key players, and future outlook. The study period covers 2019-2033, with 2025 as the base and estimated year. The report segments the market by technology, application, end-user, and country, offering granular insights for strategic decision-making. The market size is valued in Million units.
MEA Card-based Access Control Market Dynamics & Structure
The MEA card-based access control market is characterized by a moderately concentrated landscape with several key players vying for market share. Technological advancements, particularly in biometrics and contactless technologies, are driving market growth. Stringent regulatory frameworks emphasizing security are further shaping market dynamics, while competitive pressures from alternative access solutions exist. The market is experiencing significant M&A activity, as larger players consolidate their positions and acquire specialized technologies. The parent market is the broader MEA security market, while the child market encompasses specific access control solutions.
- Market Concentration: Moderate, with top 5 players holding approximately xx% market share in 2025.
- Technological Innovation: Biometric authentication (fingerprint, facial recognition), contactless smart cards, cloud-based access control systems are key drivers.
- Regulatory Landscape: Government regulations on security and data privacy are influencing market adoption.
- Competitive Substitutes: Traditional key systems, biometric locks, and password-based access are alternatives.
- M&A Activity: xx major M&A deals recorded between 2019 and 2024, indicating consolidation trends. The average deal size was approximately xx Million units.
- Innovation Barriers: High initial investment costs for advanced technologies, lack of skilled workforce, and integration challenges.
MEA Card-based Access Control Market Growth Trends & Insights
The MEA card-based access control market experienced significant growth during the historical period (2019-2024), driven by increasing security concerns across various sectors. The market size reached xx Million units in 2024 and is projected to reach xx Million units by 2033, exhibiting a Compound Annual Growth Rate (CAGR) of xx% during the forecast period (2025-2033). This growth is fueled by rising adoption rates in commercial buildings, residential complexes, and government facilities. The increasing penetration of smart technologies and the shift towards contactless access solutions are further accelerating market expansion. Consumer behavior is increasingly favoring convenience and enhanced security, driving demand for advanced card-based systems. Market penetration is expected to increase from xx% in 2025 to xx% by 2033.
Dominant Regions, Countries, or Segments in MEA Card-based Access Control Market
The UAE and Saudi Arabia are leading the MEA card-based access control market, driven by robust infrastructure development, government initiatives promoting security enhancement, and significant investments in smart city projects. These countries exhibit high adoption rates across various sectors, including commercial real estate, healthcare, and transportation.
Key Drivers in UAE & Saudi Arabia:
- Significant investments in infrastructure development.
- Government initiatives promoting security and smart city projects.
- Growing adoption in commercial and residential sectors.
- High disposable income and increasing awareness of security solutions.
Dominance Factors:
- High market share compared to other MEA countries.
- Strong economic growth and increasing urbanization.
- Favorable regulatory environment.
MEA Card-based Access Control Market Product Landscape
The market offers a diverse range of card-based access control products, including proximity cards, smart cards, and biometric cards. These products incorporate various technologies, such as RFID, NFC, and fingerprint recognition, to provide enhanced security and convenience. Recent innovations focus on multi-factor authentication, seamless integration with existing security systems, and cloud-based management platforms. Unique selling propositions often involve ease of use, advanced security features, and cost-effectiveness.
Key Drivers, Barriers & Challenges in MEA Card-based Access Control Market
Key Drivers: Rising security concerns across various sectors (commercial, residential, government), increasing adoption of smart technologies, and government initiatives promoting smart cities and improved infrastructure. The growing need for robust access control systems in high-security environments is also a major driver.
Challenges: High initial investment costs associated with implementing card-based access control systems, especially in smaller organizations, can hinder adoption. Integration with existing security infrastructure can pose challenges, while the lack of skilled personnel to install and maintain these systems presents another obstacle. Competition from alternative access control solutions, such as biometric locks, adds pressure on the market. Supply chain disruptions can impact availability and pricing of components. Cybersecurity threats to connected access control systems are a growing concern.
Emerging Opportunities in MEA Card-based Access Control Market
Emerging opportunities lie in the expansion into untapped markets within the MEA region, such as smaller cities and rural areas. The growing adoption of cloud-based access control systems presents a significant opportunity for innovation and scalability. The integration of advanced analytics with card-based systems to provide insights into user behavior and security trends is an emerging area of focus. Opportunities exist in integrating access control with other security systems, such as video surveillance and intrusion detection, to create comprehensive security solutions.
Growth Accelerators in the MEA Card-based Access Control Market Industry
Technological advancements, specifically in biometrics and contactless technologies, are driving significant growth. Strategic partnerships between access control providers and system integrators are streamlining implementation and enhancing customer service. Market expansion into new geographic areas and vertical sectors, coupled with government initiatives supporting smart city development and infrastructure upgrades, provide additional growth impetus.
Key Players Shaping the MEA Card-based Access Control Market Market
- Honeywell International Inc
- Robert Bosch GmbH
- Johnson Controls
- Siemens
- Allegion PLC
- IDEMIA
- Identiv Inc
- Axis Communications AB
- SALTO Systems
- ASSA ABLOY AB
- HID Global Corporation *List Not Exhaustive
Notable Milestones in MEA Card-based Access Control Market Sector
- October 2023: Thales launched the SafeNet IDPrime FIDO Bio Smart Card, enhancing multi-factor authentication (MFA).
- October 2023: IDEMIA partnered with HYPR and Wavelynx to introduce a smart credential combining physical and network access, improving security and compliance.
In-Depth MEA Card-based Access Control Market Market Outlook
The MEA card-based access control market is poised for sustained growth driven by continued technological innovation, expansion into new markets, and increased security concerns. Strategic opportunities exist for companies focusing on advanced security features, seamless integration capabilities, and cost-effective solutions. The market's future growth will be shaped by the adoption of next-generation technologies like AI-powered access control and the increasing integration of these systems into broader smart city initiatives.
MEA Card-based Access Control Market Segmentation
-
1. Card Type
- 1.1. Swipe Cards
- 1.2. RFID Proximity Cards
- 1.3. Smart Card (Contact and contactless)
-
2. Component
- 2.1. Card Readers
- 2.2. Access Control Keypads
- 2.3. Access Control Panels
- 2.4. Electronic Lock Hardware
- 2.5. Other Components
-
3. End-user Vertical
- 3.1. Commercial
- 3.2. Residential
- 3.3. Government
- 3.4. Industrial
- 3.5. Transport and Logistics
- 3.6. Healthcare
- 3.7. Military and Defense
- 3.8. Other End-user Verticals
MEA Card-based Access Control Market Segmentation By Geography
-
1. North America
- 1.1. United States
- 1.2. Canada
- 1.3. Mexico
-
2. South America
- 2.1. Brazil
- 2.2. Argentina
- 2.3. Rest of South America
-
3. Europe
- 3.1. United Kingdom
- 3.2. Germany
- 3.3. France
- 3.4. Italy
- 3.5. Spain
- 3.6. Russia
- 3.7. Benelux
- 3.8. Nordics
- 3.9. Rest of Europe
-
4. Middle East & Africa
- 4.1. Turkey
- 4.2. Israel
- 4.3. GCC
- 4.4. North Africa
- 4.5. South Africa
- 4.6. Rest of Middle East & Africa
-
5. Asia Pacific
- 5.1. China
- 5.2. India
- 5.3. Japan
- 5.4. South Korea
- 5.5. ASEAN
- 5.6. Oceania
- 5.7. Rest of Asia Pacific
MEA Card-based Access Control Market REPORT HIGHLIGHTS
| Aspects | Details |
|---|---|
| Study Period | 2019-2033 |
| Base Year | 2024 |
| Estimated Year | 2025 |
| Forecast Period | 2025-2033 |
| Historical Period | 2019-2024 |
| Growth Rate | CAGR of 4.60% from 2019-2033 |
| Segmentation |
|
Table of Contents
- 1. Introduction
- 1.1. Research Scope
- 1.2. Market Segmentation
- 1.3. Research Methodology
- 1.4. Definitions and Assumptions
- 2. Executive Summary
- 2.1. Introduction
- 3. Market Dynamics
- 3.1. Introduction
- 3.2. Market Drivers
- 3.2.1. The Evolution of Smart Card Technology in Access Control; Increasing Need for Enhanced Security and Government Policies for Security Concerns
- 3.3. Market Restrains
- 3.3.1. The Evolution of Smart Card Technology in Access Control; Increasing Need for Enhanced Security and Government Policies for Security Concerns
- 3.4. Market Trends
- 3.4.1. Smart Card (Contact and Contactless) Segment Witness Significant Growth
- 4. Market Factor Analysis
- 4.1. Porters Five Forces
- 4.2. Supply/Value Chain
- 4.3. PESTEL analysis
- 4.4. Market Entropy
- 4.5. Patent/Trademark Analysis
- 5. Global MEA Card-based Access Control Market Analysis, Insights and Forecast, 2019-2031
- 5.1. Market Analysis, Insights and Forecast - by Card Type
- 5.1.1. Swipe Cards
- 5.1.2. RFID Proximity Cards
- 5.1.3. Smart Card (Contact and contactless)
- 5.2. Market Analysis, Insights and Forecast - by Component
- 5.2.1. Card Readers
- 5.2.2. Access Control Keypads
- 5.2.3. Access Control Panels
- 5.2.4. Electronic Lock Hardware
- 5.2.5. Other Components
- 5.3. Market Analysis, Insights and Forecast - by End-user Vertical
- 5.3.1. Commercial
- 5.3.2. Residential
- 5.3.3. Government
- 5.3.4. Industrial
- 5.3.5. Transport and Logistics
- 5.3.6. Healthcare
- 5.3.7. Military and Defense
- 5.3.8. Other End-user Verticals
- 5.4. Market Analysis, Insights and Forecast - by Region
- 5.4.1. North America
- 5.4.2. South America
- 5.4.3. Europe
- 5.4.4. Middle East & Africa
- 5.4.5. Asia Pacific
- 5.1. Market Analysis, Insights and Forecast - by Card Type
- 6. North America MEA Card-based Access Control Market Analysis, Insights and Forecast, 2019-2031
- 6.1. Market Analysis, Insights and Forecast - by Card Type
- 6.1.1. Swipe Cards
- 6.1.2. RFID Proximity Cards
- 6.1.3. Smart Card (Contact and contactless)
- 6.2. Market Analysis, Insights and Forecast - by Component
- 6.2.1. Card Readers
- 6.2.2. Access Control Keypads
- 6.2.3. Access Control Panels
- 6.2.4. Electronic Lock Hardware
- 6.2.5. Other Components
- 6.3. Market Analysis, Insights and Forecast - by End-user Vertical
- 6.3.1. Commercial
- 6.3.2. Residential
- 6.3.3. Government
- 6.3.4. Industrial
- 6.3.5. Transport and Logistics
- 6.3.6. Healthcare
- 6.3.7. Military and Defense
- 6.3.8. Other End-user Verticals
- 6.1. Market Analysis, Insights and Forecast - by Card Type
- 7. South America MEA Card-based Access Control Market Analysis, Insights and Forecast, 2019-2031
- 7.1. Market Analysis, Insights and Forecast - by Card Type
- 7.1.1. Swipe Cards
- 7.1.2. RFID Proximity Cards
- 7.1.3. Smart Card (Contact and contactless)
- 7.2. Market Analysis, Insights and Forecast - by Component
- 7.2.1. Card Readers
- 7.2.2. Access Control Keypads
- 7.2.3. Access Control Panels
- 7.2.4. Electronic Lock Hardware
- 7.2.5. Other Components
- 7.3. Market Analysis, Insights and Forecast - by End-user Vertical
- 7.3.1. Commercial
- 7.3.2. Residential
- 7.3.3. Government
- 7.3.4. Industrial
- 7.3.5. Transport and Logistics
- 7.3.6. Healthcare
- 7.3.7. Military and Defense
- 7.3.8. Other End-user Verticals
- 7.1. Market Analysis, Insights and Forecast - by Card Type
- 8. Europe MEA Card-based Access Control Market Analysis, Insights and Forecast, 2019-2031
- 8.1. Market Analysis, Insights and Forecast - by Card Type
- 8.1.1. Swipe Cards
- 8.1.2. RFID Proximity Cards
- 8.1.3. Smart Card (Contact and contactless)
- 8.2. Market Analysis, Insights and Forecast - by Component
- 8.2.1. Card Readers
- 8.2.2. Access Control Keypads
- 8.2.3. Access Control Panels
- 8.2.4. Electronic Lock Hardware
- 8.2.5. Other Components
- 8.3. Market Analysis, Insights and Forecast - by End-user Vertical
- 8.3.1. Commercial
- 8.3.2. Residential
- 8.3.3. Government
- 8.3.4. Industrial
- 8.3.5. Transport and Logistics
- 8.3.6. Healthcare
- 8.3.7. Military and Defense
- 8.3.8. Other End-user Verticals
- 8.1. Market Analysis, Insights and Forecast - by Card Type
- 9. Middle East & Africa MEA Card-based Access Control Market Analysis, Insights and Forecast, 2019-2031
- 9.1. Market Analysis, Insights and Forecast - by Card Type
- 9.1.1. Swipe Cards
- 9.1.2. RFID Proximity Cards
- 9.1.3. Smart Card (Contact and contactless)
- 9.2. Market Analysis, Insights and Forecast - by Component
- 9.2.1. Card Readers
- 9.2.2. Access Control Keypads
- 9.2.3. Access Control Panels
- 9.2.4. Electronic Lock Hardware
- 9.2.5. Other Components
- 9.3. Market Analysis, Insights and Forecast - by End-user Vertical
- 9.3.1. Commercial
- 9.3.2. Residential
- 9.3.3. Government
- 9.3.4. Industrial
- 9.3.5. Transport and Logistics
- 9.3.6. Healthcare
- 9.3.7. Military and Defense
- 9.3.8. Other End-user Verticals
- 9.1. Market Analysis, Insights and Forecast - by Card Type
- 10. Asia Pacific MEA Card-based Access Control Market Analysis, Insights and Forecast, 2019-2031
- 10.1. Market Analysis, Insights and Forecast - by Card Type
- 10.1.1. Swipe Cards
- 10.1.2. RFID Proximity Cards
- 10.1.3. Smart Card (Contact and contactless)
- 10.2. Market Analysis, Insights and Forecast - by Component
- 10.2.1. Card Readers
- 10.2.2. Access Control Keypads
- 10.2.3. Access Control Panels
- 10.2.4. Electronic Lock Hardware
- 10.2.5. Other Components
- 10.3. Market Analysis, Insights and Forecast - by End-user Vertical
- 10.3.1. Commercial
- 10.3.2. Residential
- 10.3.3. Government
- 10.3.4. Industrial
- 10.3.5. Transport and Logistics
- 10.3.6. Healthcare
- 10.3.7. Military and Defense
- 10.3.8. Other End-user Verticals
- 10.1. Market Analysis, Insights and Forecast - by Card Type
- 11. Competitive Analysis
- 11.1. Global Market Share Analysis 2024
- 11.2. Company Profiles
- 11.2.1 Honeywell International Inc
- 11.2.1.1. Overview
- 11.2.1.2. Products
- 11.2.1.3. SWOT Analysis
- 11.2.1.4. Recent Developments
- 11.2.1.5. Financials (Based on Availability)
- 11.2.2 Robert Bosch GmbH
- 11.2.2.1. Overview
- 11.2.2.2. Products
- 11.2.2.3. SWOT Analysis
- 11.2.2.4. Recent Developments
- 11.2.2.5. Financials (Based on Availability)
- 11.2.3 Johnson Controls
- 11.2.3.1. Overview
- 11.2.3.2. Products
- 11.2.3.3. SWOT Analysis
- 11.2.3.4. Recent Developments
- 11.2.3.5. Financials (Based on Availability)
- 11.2.4 Siemens
- 11.2.4.1. Overview
- 11.2.4.2. Products
- 11.2.4.3. SWOT Analysis
- 11.2.4.4. Recent Developments
- 11.2.4.5. Financials (Based on Availability)
- 11.2.5 Allegion PLC
- 11.2.5.1. Overview
- 11.2.5.2. Products
- 11.2.5.3. SWOT Analysis
- 11.2.5.4. Recent Developments
- 11.2.5.5. Financials (Based on Availability)
- 11.2.6 IDEMIA
- 11.2.6.1. Overview
- 11.2.6.2. Products
- 11.2.6.3. SWOT Analysis
- 11.2.6.4. Recent Developments
- 11.2.6.5. Financials (Based on Availability)
- 11.2.7 Identiv Inc
- 11.2.7.1. Overview
- 11.2.7.2. Products
- 11.2.7.3. SWOT Analysis
- 11.2.7.4. Recent Developments
- 11.2.7.5. Financials (Based on Availability)
- 11.2.8 Axis Communications AB
- 11.2.8.1. Overview
- 11.2.8.2. Products
- 11.2.8.3. SWOT Analysis
- 11.2.8.4. Recent Developments
- 11.2.8.5. Financials (Based on Availability)
- 11.2.9 SALTO Systems
- 11.2.9.1. Overview
- 11.2.9.2. Products
- 11.2.9.3. SWOT Analysis
- 11.2.9.4. Recent Developments
- 11.2.9.5. Financials (Based on Availability)
- 11.2.10 ASSA ABLOY AB
- 11.2.10.1. Overview
- 11.2.10.2. Products
- 11.2.10.3. SWOT Analysis
- 11.2.10.4. Recent Developments
- 11.2.10.5. Financials (Based on Availability)
- 11.2.11 HID Global Corporation*List Not Exhaustive
- 11.2.11.1. Overview
- 11.2.11.2. Products
- 11.2.11.3. SWOT Analysis
- 11.2.11.4. Recent Developments
- 11.2.11.5. Financials (Based on Availability)
- 11.2.1 Honeywell International Inc
List of Figures
- Figure 1: Global MEA Card-based Access Control Market Revenue Breakdown (Million, %) by Region 2024 & 2032
- Figure 2: Global MEA Card-based Access Control Market Volume Breakdown (Million, %) by Region 2024 & 2032
- Figure 3: North America MEA Card-based Access Control Market Revenue (Million), by Card Type 2024 & 2032
- Figure 4: North America MEA Card-based Access Control Market Volume (Million), by Card Type 2024 & 2032
- Figure 5: North America MEA Card-based Access Control Market Revenue Share (%), by Card Type 2024 & 2032
- Figure 6: North America MEA Card-based Access Control Market Volume Share (%), by Card Type 2024 & 2032
- Figure 7: North America MEA Card-based Access Control Market Revenue (Million), by Component 2024 & 2032
- Figure 8: North America MEA Card-based Access Control Market Volume (Million), by Component 2024 & 2032
- Figure 9: North America MEA Card-based Access Control Market Revenue Share (%), by Component 2024 & 2032
- Figure 10: North America MEA Card-based Access Control Market Volume Share (%), by Component 2024 & 2032
- Figure 11: North America MEA Card-based Access Control Market Revenue (Million), by End-user Vertical 2024 & 2032
- Figure 12: North America MEA Card-based Access Control Market Volume (Million), by End-user Vertical 2024 & 2032
- Figure 13: North America MEA Card-based Access Control Market Revenue Share (%), by End-user Vertical 2024 & 2032
- Figure 14: North America MEA Card-based Access Control Market Volume Share (%), by End-user Vertical 2024 & 2032
- Figure 15: North America MEA Card-based Access Control Market Revenue (Million), by Country 2024 & 2032
- Figure 16: North America MEA Card-based Access Control Market Volume (Million), by Country 2024 & 2032
- Figure 17: North America MEA Card-based Access Control Market Revenue Share (%), by Country 2024 & 2032
- Figure 18: North America MEA Card-based Access Control Market Volume Share (%), by Country 2024 & 2032
- Figure 19: South America MEA Card-based Access Control Market Revenue (Million), by Card Type 2024 & 2032
- Figure 20: South America MEA Card-based Access Control Market Volume (Million), by Card Type 2024 & 2032
- Figure 21: South America MEA Card-based Access Control Market Revenue Share (%), by Card Type 2024 & 2032
- Figure 22: South America MEA Card-based Access Control Market Volume Share (%), by Card Type 2024 & 2032
- Figure 23: South America MEA Card-based Access Control Market Revenue (Million), by Component 2024 & 2032
- Figure 24: South America MEA Card-based Access Control Market Volume (Million), by Component 2024 & 2032
- Figure 25: South America MEA Card-based Access Control Market Revenue Share (%), by Component 2024 & 2032
- Figure 26: South America MEA Card-based Access Control Market Volume Share (%), by Component 2024 & 2032
- Figure 27: South America MEA Card-based Access Control Market Revenue (Million), by End-user Vertical 2024 & 2032
- Figure 28: South America MEA Card-based Access Control Market Volume (Million), by End-user Vertical 2024 & 2032
- Figure 29: South America MEA Card-based Access Control Market Revenue Share (%), by End-user Vertical 2024 & 2032
- Figure 30: South America MEA Card-based Access Control Market Volume Share (%), by End-user Vertical 2024 & 2032
- Figure 31: South America MEA Card-based Access Control Market Revenue (Million), by Country 2024 & 2032
- Figure 32: South America MEA Card-based Access Control Market Volume (Million), by Country 2024 & 2032
- Figure 33: South America MEA Card-based Access Control Market Revenue Share (%), by Country 2024 & 2032
- Figure 34: South America MEA Card-based Access Control Market Volume Share (%), by Country 2024 & 2032
- Figure 35: Europe MEA Card-based Access Control Market Revenue (Million), by Card Type 2024 & 2032
- Figure 36: Europe MEA Card-based Access Control Market Volume (Million), by Card Type 2024 & 2032
- Figure 37: Europe MEA Card-based Access Control Market Revenue Share (%), by Card Type 2024 & 2032
- Figure 38: Europe MEA Card-based Access Control Market Volume Share (%), by Card Type 2024 & 2032
- Figure 39: Europe MEA Card-based Access Control Market Revenue (Million), by Component 2024 & 2032
- Figure 40: Europe MEA Card-based Access Control Market Volume (Million), by Component 2024 & 2032
- Figure 41: Europe MEA Card-based Access Control Market Revenue Share (%), by Component 2024 & 2032
- Figure 42: Europe MEA Card-based Access Control Market Volume Share (%), by Component 2024 & 2032
- Figure 43: Europe MEA Card-based Access Control Market Revenue (Million), by End-user Vertical 2024 & 2032
- Figure 44: Europe MEA Card-based Access Control Market Volume (Million), by End-user Vertical 2024 & 2032
- Figure 45: Europe MEA Card-based Access Control Market Revenue Share (%), by End-user Vertical 2024 & 2032
- Figure 46: Europe MEA Card-based Access Control Market Volume Share (%), by End-user Vertical 2024 & 2032
- Figure 47: Europe MEA Card-based Access Control Market Revenue (Million), by Country 2024 & 2032
- Figure 48: Europe MEA Card-based Access Control Market Volume (Million), by Country 2024 & 2032
- Figure 49: Europe MEA Card-based Access Control Market Revenue Share (%), by Country 2024 & 2032
- Figure 50: Europe MEA Card-based Access Control Market Volume Share (%), by Country 2024 & 2032
- Figure 51: Middle East & Africa MEA Card-based Access Control Market Revenue (Million), by Card Type 2024 & 2032
- Figure 52: Middle East & Africa MEA Card-based Access Control Market Volume (Million), by Card Type 2024 & 2032
- Figure 53: Middle East & Africa MEA Card-based Access Control Market Revenue Share (%), by Card Type 2024 & 2032
- Figure 54: Middle East & Africa MEA Card-based Access Control Market Volume Share (%), by Card Type 2024 & 2032
- Figure 55: Middle East & Africa MEA Card-based Access Control Market Revenue (Million), by Component 2024 & 2032
- Figure 56: Middle East & Africa MEA Card-based Access Control Market Volume (Million), by Component 2024 & 2032
- Figure 57: Middle East & Africa MEA Card-based Access Control Market Revenue Share (%), by Component 2024 & 2032
- Figure 58: Middle East & Africa MEA Card-based Access Control Market Volume Share (%), by Component 2024 & 2032
- Figure 59: Middle East & Africa MEA Card-based Access Control Market Revenue (Million), by End-user Vertical 2024 & 2032
- Figure 60: Middle East & Africa MEA Card-based Access Control Market Volume (Million), by End-user Vertical 2024 & 2032
- Figure 61: Middle East & Africa MEA Card-based Access Control Market Revenue Share (%), by End-user Vertical 2024 & 2032
- Figure 62: Middle East & Africa MEA Card-based Access Control Market Volume Share (%), by End-user Vertical 2024 & 2032
- Figure 63: Middle East & Africa MEA Card-based Access Control Market Revenue (Million), by Country 2024 & 2032
- Figure 64: Middle East & Africa MEA Card-based Access Control Market Volume (Million), by Country 2024 & 2032
- Figure 65: Middle East & Africa MEA Card-based Access Control Market Revenue Share (%), by Country 2024 & 2032
- Figure 66: Middle East & Africa MEA Card-based Access Control Market Volume Share (%), by Country 2024 & 2032
- Figure 67: Asia Pacific MEA Card-based Access Control Market Revenue (Million), by Card Type 2024 & 2032
- Figure 68: Asia Pacific MEA Card-based Access Control Market Volume (Million), by Card Type 2024 & 2032
- Figure 69: Asia Pacific MEA Card-based Access Control Market Revenue Share (%), by Card Type 2024 & 2032
- Figure 70: Asia Pacific MEA Card-based Access Control Market Volume Share (%), by Card Type 2024 & 2032
- Figure 71: Asia Pacific MEA Card-based Access Control Market Revenue (Million), by Component 2024 & 2032
- Figure 72: Asia Pacific MEA Card-based Access Control Market Volume (Million), by Component 2024 & 2032
- Figure 73: Asia Pacific MEA Card-based Access Control Market Revenue Share (%), by Component 2024 & 2032
- Figure 74: Asia Pacific MEA Card-based Access Control Market Volume Share (%), by Component 2024 & 2032
- Figure 75: Asia Pacific MEA Card-based Access Control Market Revenue (Million), by End-user Vertical 2024 & 2032
- Figure 76: Asia Pacific MEA Card-based Access Control Market Volume (Million), by End-user Vertical 2024 & 2032
- Figure 77: Asia Pacific MEA Card-based Access Control Market Revenue Share (%), by End-user Vertical 2024 & 2032
- Figure 78: Asia Pacific MEA Card-based Access Control Market Volume Share (%), by End-user Vertical 2024 & 2032
- Figure 79: Asia Pacific MEA Card-based Access Control Market Revenue (Million), by Country 2024 & 2032
- Figure 80: Asia Pacific MEA Card-based Access Control Market Volume (Million), by Country 2024 & 2032
- Figure 81: Asia Pacific MEA Card-based Access Control Market Revenue Share (%), by Country 2024 & 2032
- Figure 82: Asia Pacific MEA Card-based Access Control Market Volume Share (%), by Country 2024 & 2032
List of Tables
- Table 1: Global MEA Card-based Access Control Market Revenue Million Forecast, by Region 2019 & 2032
- Table 2: Global MEA Card-based Access Control Market Volume Million Forecast, by Region 2019 & 2032
- Table 3: Global MEA Card-based Access Control Market Revenue Million Forecast, by Card Type 2019 & 2032
- Table 4: Global MEA Card-based Access Control Market Volume Million Forecast, by Card Type 2019 & 2032
- Table 5: Global MEA Card-based Access Control Market Revenue Million Forecast, by Component 2019 & 2032
- Table 6: Global MEA Card-based Access Control Market Volume Million Forecast, by Component 2019 & 2032
- Table 7: Global MEA Card-based Access Control Market Revenue Million Forecast, by End-user Vertical 2019 & 2032
- Table 8: Global MEA Card-based Access Control Market Volume Million Forecast, by End-user Vertical 2019 & 2032
- Table 9: Global MEA Card-based Access Control Market Revenue Million Forecast, by Region 2019 & 2032
- Table 10: Global MEA Card-based Access Control Market Volume Million Forecast, by Region 2019 & 2032
- Table 11: Global MEA Card-based Access Control Market Revenue Million Forecast, by Card Type 2019 & 2032
- Table 12: Global MEA Card-based Access Control Market Volume Million Forecast, by Card Type 2019 & 2032
- Table 13: Global MEA Card-based Access Control Market Revenue Million Forecast, by Component 2019 & 2032
- Table 14: Global MEA Card-based Access Control Market Volume Million Forecast, by Component 2019 & 2032
- Table 15: Global MEA Card-based Access Control Market Revenue Million Forecast, by End-user Vertical 2019 & 2032
- Table 16: Global MEA Card-based Access Control Market Volume Million Forecast, by End-user Vertical 2019 & 2032
- Table 17: Global MEA Card-based Access Control Market Revenue Million Forecast, by Country 2019 & 2032
- Table 18: Global MEA Card-based Access Control Market Volume Million Forecast, by Country 2019 & 2032
- Table 19: United States MEA Card-based Access Control Market Revenue (Million) Forecast, by Application 2019 & 2032
- Table 20: United States MEA Card-based Access Control Market Volume (Million) Forecast, by Application 2019 & 2032
- Table 21: Canada MEA Card-based Access Control Market Revenue (Million) Forecast, by Application 2019 & 2032
- Table 22: Canada MEA Card-based Access Control Market Volume (Million) Forecast, by Application 2019 & 2032
- Table 23: Mexico MEA Card-based Access Control Market Revenue (Million) Forecast, by Application 2019 & 2032
- Table 24: Mexico MEA Card-based Access Control Market Volume (Million) Forecast, by Application 2019 & 2032
- Table 25: Global MEA Card-based Access Control Market Revenue Million Forecast, by Card Type 2019 & 2032
- Table 26: Global MEA Card-based Access Control Market Volume Million Forecast, by Card Type 2019 & 2032
- Table 27: Global MEA Card-based Access Control Market Revenue Million Forecast, by Component 2019 & 2032
- Table 28: Global MEA Card-based Access Control Market Volume Million Forecast, by Component 2019 & 2032
- Table 29: Global MEA Card-based Access Control Market Revenue Million Forecast, by End-user Vertical 2019 & 2032
- Table 30: Global MEA Card-based Access Control Market Volume Million Forecast, by End-user Vertical 2019 & 2032
- Table 31: Global MEA Card-based Access Control Market Revenue Million Forecast, by Country 2019 & 2032
- Table 32: Global MEA Card-based Access Control Market Volume Million Forecast, by Country 2019 & 2032
- Table 33: Brazil MEA Card-based Access Control Market Revenue (Million) Forecast, by Application 2019 & 2032
- Table 34: Brazil MEA Card-based Access Control Market Volume (Million) Forecast, by Application 2019 & 2032
- Table 35: Argentina MEA Card-based Access Control Market Revenue (Million) Forecast, by Application 2019 & 2032
- Table 36: Argentina MEA Card-based Access Control Market Volume (Million) Forecast, by Application 2019 & 2032
- Table 37: Rest of South America MEA Card-based Access Control Market Revenue (Million) Forecast, by Application 2019 & 2032
- Table 38: Rest of South America MEA Card-based Access Control Market Volume (Million) Forecast, by Application 2019 & 2032
- Table 39: Global MEA Card-based Access Control Market Revenue Million Forecast, by Card Type 2019 & 2032
- Table 40: Global MEA Card-based Access Control Market Volume Million Forecast, by Card Type 2019 & 2032
- Table 41: Global MEA Card-based Access Control Market Revenue Million Forecast, by Component 2019 & 2032
- Table 42: Global MEA Card-based Access Control Market Volume Million Forecast, by Component 2019 & 2032
- Table 43: Global MEA Card-based Access Control Market Revenue Million Forecast, by End-user Vertical 2019 & 2032
- Table 44: Global MEA Card-based Access Control Market Volume Million Forecast, by End-user Vertical 2019 & 2032
- Table 45: Global MEA Card-based Access Control Market Revenue Million Forecast, by Country 2019 & 2032
- Table 46: Global MEA Card-based Access Control Market Volume Million Forecast, by Country 2019 & 2032
- Table 47: United Kingdom MEA Card-based Access Control Market Revenue (Million) Forecast, by Application 2019 & 2032
- Table 48: United Kingdom MEA Card-based Access Control Market Volume (Million) Forecast, by Application 2019 & 2032
- Table 49: Germany MEA Card-based Access Control Market Revenue (Million) Forecast, by Application 2019 & 2032
- Table 50: Germany MEA Card-based Access Control Market Volume (Million) Forecast, by Application 2019 & 2032
- Table 51: France MEA Card-based Access Control Market Revenue (Million) Forecast, by Application 2019 & 2032
- Table 52: France MEA Card-based Access Control Market Volume (Million) Forecast, by Application 2019 & 2032
- Table 53: Italy MEA Card-based Access Control Market Revenue (Million) Forecast, by Application 2019 & 2032
- Table 54: Italy MEA Card-based Access Control Market Volume (Million) Forecast, by Application 2019 & 2032
- Table 55: Spain MEA Card-based Access Control Market Revenue (Million) Forecast, by Application 2019 & 2032
- Table 56: Spain MEA Card-based Access Control Market Volume (Million) Forecast, by Application 2019 & 2032
- Table 57: Russia MEA Card-based Access Control Market Revenue (Million) Forecast, by Application 2019 & 2032
- Table 58: Russia MEA Card-based Access Control Market Volume (Million) Forecast, by Application 2019 & 2032
- Table 59: Benelux MEA Card-based Access Control Market Revenue (Million) Forecast, by Application 2019 & 2032
- Table 60: Benelux MEA Card-based Access Control Market Volume (Million) Forecast, by Application 2019 & 2032
- Table 61: Nordics MEA Card-based Access Control Market Revenue (Million) Forecast, by Application 2019 & 2032
- Table 62: Nordics MEA Card-based Access Control Market Volume (Million) Forecast, by Application 2019 & 2032
- Table 63: Rest of Europe MEA Card-based Access Control Market Revenue (Million) Forecast, by Application 2019 & 2032
- Table 64: Rest of Europe MEA Card-based Access Control Market Volume (Million) Forecast, by Application 2019 & 2032
- Table 65: Global MEA Card-based Access Control Market Revenue Million Forecast, by Card Type 2019 & 2032
- Table 66: Global MEA Card-based Access Control Market Volume Million Forecast, by Card Type 2019 & 2032
- Table 67: Global MEA Card-based Access Control Market Revenue Million Forecast, by Component 2019 & 2032
- Table 68: Global MEA Card-based Access Control Market Volume Million Forecast, by Component 2019 & 2032
- Table 69: Global MEA Card-based Access Control Market Revenue Million Forecast, by End-user Vertical 2019 & 2032
- Table 70: Global MEA Card-based Access Control Market Volume Million Forecast, by End-user Vertical 2019 & 2032
- Table 71: Global MEA Card-based Access Control Market Revenue Million Forecast, by Country 2019 & 2032
- Table 72: Global MEA Card-based Access Control Market Volume Million Forecast, by Country 2019 & 2032
- Table 73: Turkey MEA Card-based Access Control Market Revenue (Million) Forecast, by Application 2019 & 2032
- Table 74: Turkey MEA Card-based Access Control Market Volume (Million) Forecast, by Application 2019 & 2032
- Table 75: Israel MEA Card-based Access Control Market Revenue (Million) Forecast, by Application 2019 & 2032
- Table 76: Israel MEA Card-based Access Control Market Volume (Million) Forecast, by Application 2019 & 2032
- Table 77: GCC MEA Card-based Access Control Market Revenue (Million) Forecast, by Application 2019 & 2032
- Table 78: GCC MEA Card-based Access Control Market Volume (Million) Forecast, by Application 2019 & 2032
- Table 79: North Africa MEA Card-based Access Control Market Revenue (Million) Forecast, by Application 2019 & 2032
- Table 80: North Africa MEA Card-based Access Control Market Volume (Million) Forecast, by Application 2019 & 2032
- Table 81: South Africa MEA Card-based Access Control Market Revenue (Million) Forecast, by Application 2019 & 2032
- Table 82: South Africa MEA Card-based Access Control Market Volume (Million) Forecast, by Application 2019 & 2032
- Table 83: Rest of Middle East & Africa MEA Card-based Access Control Market Revenue (Million) Forecast, by Application 2019 & 2032
- Table 84: Rest of Middle East & Africa MEA Card-based Access Control Market Volume (Million) Forecast, by Application 2019 & 2032
- Table 85: Global MEA Card-based Access Control Market Revenue Million Forecast, by Card Type 2019 & 2032
- Table 86: Global MEA Card-based Access Control Market Volume Million Forecast, by Card Type 2019 & 2032
- Table 87: Global MEA Card-based Access Control Market Revenue Million Forecast, by Component 2019 & 2032
- Table 88: Global MEA Card-based Access Control Market Volume Million Forecast, by Component 2019 & 2032
- Table 89: Global MEA Card-based Access Control Market Revenue Million Forecast, by End-user Vertical 2019 & 2032
- Table 90: Global MEA Card-based Access Control Market Volume Million Forecast, by End-user Vertical 2019 & 2032
- Table 91: Global MEA Card-based Access Control Market Revenue Million Forecast, by Country 2019 & 2032
- Table 92: Global MEA Card-based Access Control Market Volume Million Forecast, by Country 2019 & 2032
- Table 93: China MEA Card-based Access Control Market Revenue (Million) Forecast, by Application 2019 & 2032
- Table 94: China MEA Card-based Access Control Market Volume (Million) Forecast, by Application 2019 & 2032
- Table 95: India MEA Card-based Access Control Market Revenue (Million) Forecast, by Application 2019 & 2032
- Table 96: India MEA Card-based Access Control Market Volume (Million) Forecast, by Application 2019 & 2032
- Table 97: Japan MEA Card-based Access Control Market Revenue (Million) Forecast, by Application 2019 & 2032
- Table 98: Japan MEA Card-based Access Control Market Volume (Million) Forecast, by Application 2019 & 2032
- Table 99: South Korea MEA Card-based Access Control Market Revenue (Million) Forecast, by Application 2019 & 2032
- Table 100: South Korea MEA Card-based Access Control Market Volume (Million) Forecast, by Application 2019 & 2032
- Table 101: ASEAN MEA Card-based Access Control Market Revenue (Million) Forecast, by Application 2019 & 2032
- Table 102: ASEAN MEA Card-based Access Control Market Volume (Million) Forecast, by Application 2019 & 2032
- Table 103: Oceania MEA Card-based Access Control Market Revenue (Million) Forecast, by Application 2019 & 2032
- Table 104: Oceania MEA Card-based Access Control Market Volume (Million) Forecast, by Application 2019 & 2032
- Table 105: Rest of Asia Pacific MEA Card-based Access Control Market Revenue (Million) Forecast, by Application 2019 & 2032
- Table 106: Rest of Asia Pacific MEA Card-based Access Control Market Volume (Million) Forecast, by Application 2019 & 2032
Frequently Asked Questions
1. What is the projected Compound Annual Growth Rate (CAGR) of the MEA Card-based Access Control Market?
The projected CAGR is approximately 4.60%.
2. Which companies are prominent players in the MEA Card-based Access Control Market?
Key companies in the market include Honeywell International Inc, Robert Bosch GmbH, Johnson Controls, Siemens, Allegion PLC, IDEMIA, Identiv Inc, Axis Communications AB, SALTO Systems, ASSA ABLOY AB, HID Global Corporation*List Not Exhaustive.
3. What are the main segments of the MEA Card-based Access Control Market?
The market segments include Card Type, Component, End-user Vertical.
4. Can you provide details about the market size?
The market size is estimated to be USD 130 Million as of 2022.
5. What are some drivers contributing to market growth?
The Evolution of Smart Card Technology in Access Control; Increasing Need for Enhanced Security and Government Policies for Security Concerns.
6. What are the notable trends driving market growth?
Smart Card (Contact and Contactless) Segment Witness Significant Growth.
7. Are there any restraints impacting market growth?
The Evolution of Smart Card Technology in Access Control; Increasing Need for Enhanced Security and Government Policies for Security Concerns.
8. Can you provide examples of recent developments in the market?
October 2023: Thales unveiled the SafeNet IDPrime FIDO Bio Smart Card, a security key designed for robust multi-factor authentication (MFA) in enterprise settings. This innovative contactless smart card empowers users to swiftly and securely access enterprise devices, applications, and cloud services by leveraging their fingerprints, eliminating the need for traditional passwords. By championing a passwordless approach, the SafeNet IDPrime FIDO Bio Smart Card streamlines user adoption, enabling seamless enrollment and authentication through biometrics, specifically fingerprint recognition via the card's built-in sensor.October 2023: IDEMIA, in partnership with HYPR and Wavelynx, introduced a smart credential designed to assist organizations in meeting compliance and regulatory requirements, as well as security best practices. This new access card combines physical and network access into one badge, utilizing open and interoperable standards and secure phishing-resistant authentication technologies. The card features a FIPS-certified PIV applet, a FIDO Certified passkey with MIFARE DESFire support for interfacing with next-gen access control readers based on the LEAF protocol, and a Prox interface to support legacy access control readers.
9. What pricing options are available for accessing the report?
Pricing options include single-user, multi-user, and enterprise licenses priced at USD 4750, USD 4950, and USD 6800 respectively.
10. Is the market size provided in terms of value or volume?
The market size is provided in terms of value, measured in Million and volume, measured in Million.
11. Are there any specific market keywords associated with the report?
Yes, the market keyword associated with the report is "MEA Card-based Access Control Market," which aids in identifying and referencing the specific market segment covered.
12. How do I determine which pricing option suits my needs best?
The pricing options vary based on user requirements and access needs. Individual users may opt for single-user licenses, while businesses requiring broader access may choose multi-user or enterprise licenses for cost-effective access to the report.
13. Are there any additional resources or data provided in the MEA Card-based Access Control Market report?
While the report offers comprehensive insights, it's advisable to review the specific contents or supplementary materials provided to ascertain if additional resources or data are available.
14. How can I stay updated on further developments or reports in the MEA Card-based Access Control Market?
To stay informed about further developments, trends, and reports in the MEA Card-based Access Control Market, consider subscribing to industry newsletters, following relevant companies and organizations, or regularly checking reputable industry news sources and publications.
Methodology
Step 1 - Identification of Relevant Samples Size from Population Database


Step 2 - Approaches for Defining Global Market Size (Value, Volume* & Price*)

Note*: In applicable scenarios
Step 3 - Data Sources
Primary Research
- Web Analytics
- Survey Reports
- Research Institute
- Latest Research Reports
- Opinion Leaders
Secondary Research
- Annual Reports
- White Paper
- Latest Press Release
- Industry Association
- Paid Database
- Investor Presentations

Step 4 - Data Triangulation
Involves using different sources of information in order to increase the validity of a study
These sources are likely to be stakeholders in a program - participants, other researchers, program staff, other community members, and so on.
Then we put all data in single framework & apply various statistical tools to find out the dynamic on the market.
During the analysis stage, feedback from the stakeholder groups would be compared to determine areas of agreement as well as areas of divergence


