Key Insights
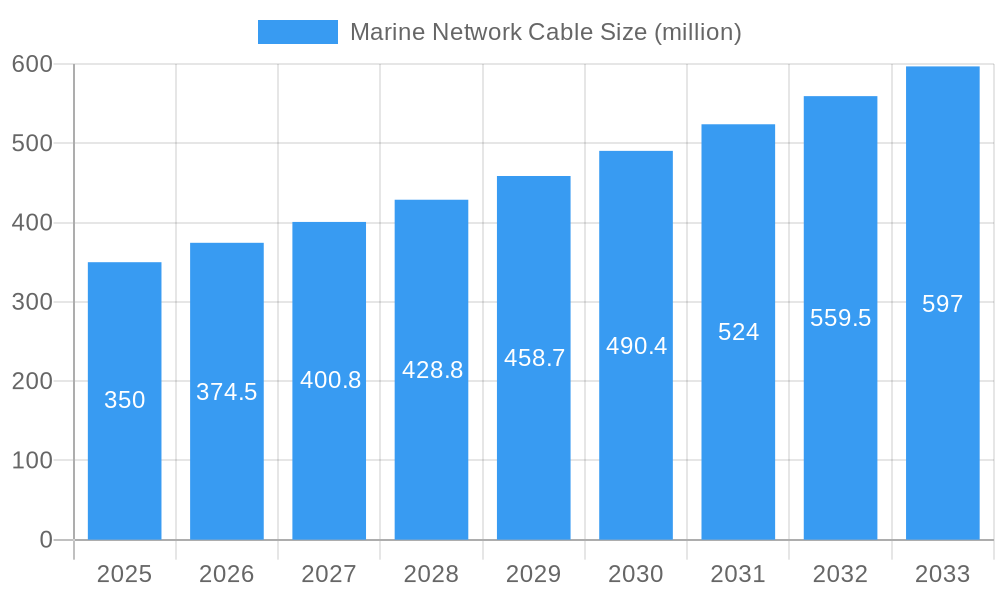
The marine network cable market is experiencing robust growth, driven by the increasing adoption of advanced navigation and communication systems on recreational and commercial vessels. The market's expansion is fueled by several key factors: a rising demand for integrated onboard electronics, the proliferation of smart vessels with interconnected systems, and a growing preference for enhanced safety and navigation features. Technological advancements, such as the development of higher-bandwidth cables capable of supporting larger data transfers and improved durability to withstand harsh marine environments, are also contributing to market expansion. Furthermore, the increasing popularity of boating and fishing activities, coupled with government investments in maritime infrastructure, are bolstering market demand. We estimate the market size in 2025 to be approximately $350 million, based on industry reports showing steady growth in related sectors. A conservative Compound Annual Growth Rate (CAGR) of 7% is projected for the forecast period 2025-2033, indicating a significant market expansion in the coming years.
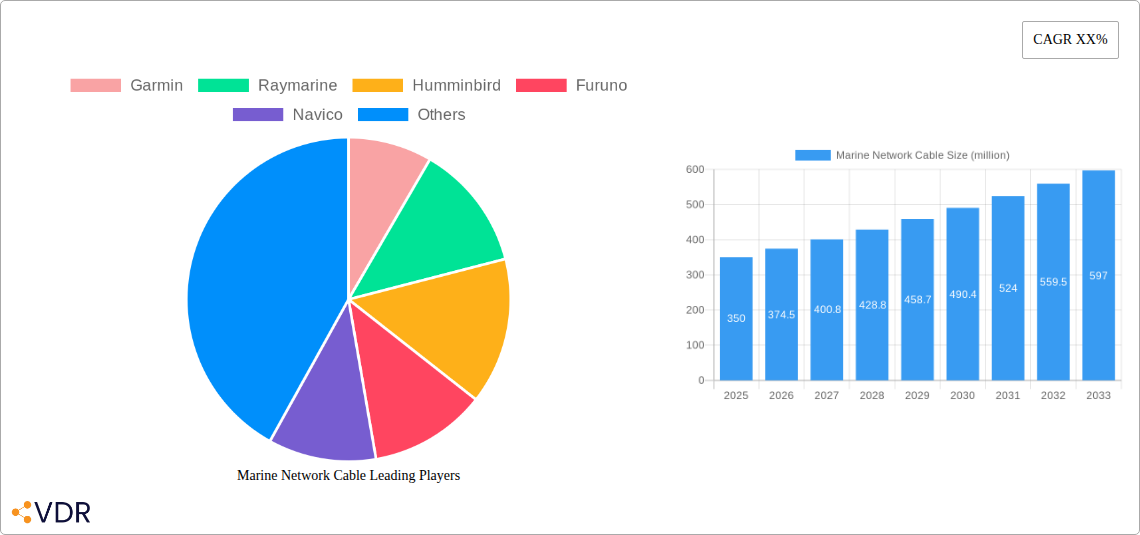
Marine Network Cable Market Size (In Million)
However, certain restraints might impede market growth. These include the relatively high cost of marine network cables compared to traditional wiring solutions and the complexity involved in their installation and maintenance. Nevertheless, the long-term benefits of enhanced connectivity and system reliability are expected to outweigh these challenges, ensuring consistent market growth. The market is segmented by cable type (e.g., fiber optic, copper), application (e.g., navigation, communication, entertainment), and vessel type (e.g., recreational, commercial). Major players like Garmin, Raymarine, Humminbird, Furuno, Navico, Simrad, JRC, and B&G are actively engaged in product innovation and market expansion strategies, intensifying competition and driving further market growth.
Marine Network Cable Company Market Share
Marine Network Cable Market Report: 2019-2033
This comprehensive report provides an in-depth analysis of the marine network cable market, encompassing market dynamics, growth trends, regional analysis, product landscape, key players, and future outlook. The report covers the period 2019-2033, with a focus on the forecast period 2025-2033, utilizing 2025 as the base and estimated year. This report is crucial for industry professionals, investors, and stakeholders seeking a granular understanding of this dynamic market segment within the broader marine electronics and parent nautical equipment markets.
Marine Network Cable Market Dynamics & Structure
The marine network cable market is characterized by moderate concentration, with key players such as Garmin, Raymarine, Humminbird, Furuno, Navico, Simrad, JRC, and B&G holding significant market share. The market is driven by technological innovation, particularly in high-speed data transmission and improved cable durability. Regulatory frameworks concerning maritime safety and communication standards significantly influence market dynamics. The market also sees competition from wireless communication technologies, although wired cables remain crucial for reliable, high-bandwidth data transfer in harsh marine environments. End-user demographics skew towards commercial and recreational boat owners, with varying needs affecting cable specifications. The historical period (2019-2024) saw a moderate level of M&A activity, with approximately xx deals totaling xx million USD. The forecast period (2025-2033) predicts xx deals, totaling xx million USD.
- Market Concentration: Moderately concentrated, with top 8 players holding approximately 65% market share in 2025.
- Technological Drivers: High-speed data transmission, improved durability (e.g., UV resistance, saltwater resistance), and smaller cable diameters for improved installation.
- Regulatory Frameworks: Compliance with international maritime safety standards (e.g., IMO) impacts cable specifications and certifications.
- Competitive Substitutes: Wireless communication systems (e.g., Wi-Fi, Bluetooth), but wired cables maintain dominance for high bandwidth and reliability.
- End-User Demographics: Primarily commercial fishing vessels, recreational boats (both power and sail), and military/government vessels.
- M&A Trends: Moderate activity, driven by market consolidation and technological acquisitions.
Marine Network Cable Growth Trends & Insights
The marine network cable market experienced steady growth during the historical period (2019-2024), with a CAGR of approximately xx%. This growth is attributed to the increasing adoption of integrated navigation systems, improved connectivity demands on vessels, and the rising popularity of recreational boating. Technological disruptions, such as the introduction of fiber optic cables for high-bandwidth applications, are driving market expansion. Consumer behavior shifts towards more sophisticated onboard electronics contribute to the demand. The forecast period (2025-2033) is projected to see continued growth, with a projected CAGR of xx%, driven by increasing demand for high-speed data transmission, enhanced connectivity for IoT applications, and expansion in emerging markets. The market size is estimated at xx million USD in 2025 and is projected to reach xx million USD by 2033. Market penetration is estimated to be xx% in 2025 and projected to reach xx% by 2033.
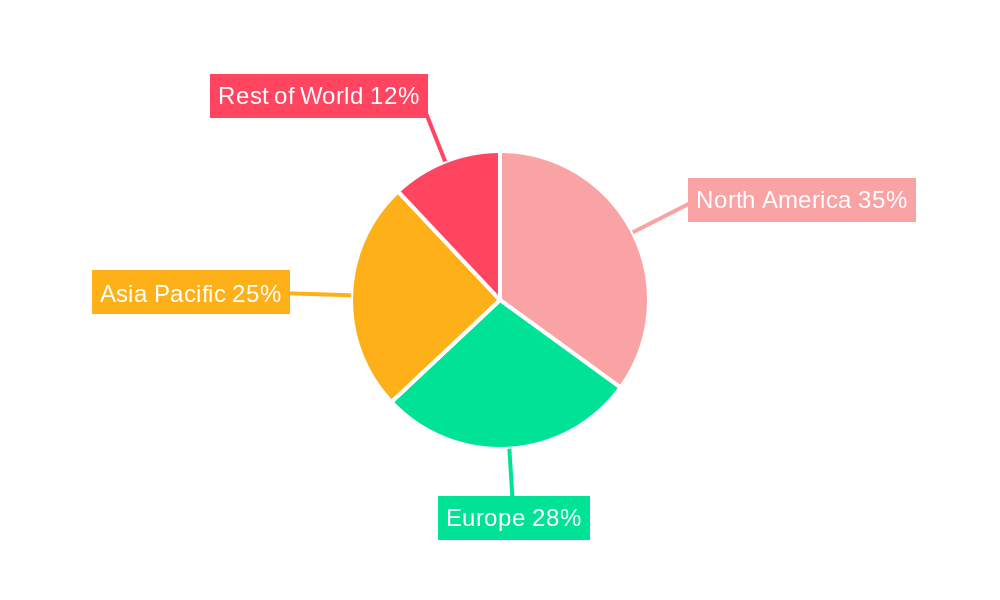
Dominant Regions, Countries, or Segments in Marine Network Cable
North America currently holds the largest market share in the marine network cable market, followed by Europe and Asia-Pacific. This dominance is driven by several factors, including a higher density of recreational boats and established marine electronics industries. Government regulations and investments in infrastructure also contribute to growth in this region. Specific countries like the United States and the United Kingdom display strong market performance due to robust recreational boating sectors. The commercial fishing sector in Asia-Pacific is also fostering growth, although infrastructure limitations pose a challenge.
- Key Drivers (North America): Strong recreational boating market, advanced marine electronics industry, and high disposable incomes.
- Key Drivers (Europe): Significant commercial shipping activity, well-established shipbuilding industry, and stringent safety regulations.
- Key Drivers (Asia-Pacific): Rapid growth in the commercial fishing industry, expanding leisure boating sector, and increasing government investments in port infrastructure.
- Market Share: North America (xx%), Europe (xx%), Asia-Pacific (xx%), Rest of World (xx%). (2025 estimates)
Marine Network Cable Product Landscape
The marine network cable market offers a range of products, including standard copper cables, fiber optic cables, and specialized cables for specific applications. Innovations focus on improving data transmission speeds, enhancing cable durability against harsh marine conditions (UV degradation, saltwater corrosion), and miniaturizing cable size for easier installation. These improvements are driving higher adoption rates across different vessel types and applications. Unique selling propositions often center on high bandwidth, superior durability, and ease of installation, particularly in challenging environments.
Key Drivers, Barriers & Challenges in Marine Network Cable
Key Drivers:
- Increasing demand for integrated navigation systems and onboard electronics.
- Growing adoption of IoT (Internet of Things) technologies in marine applications.
- Stringent safety regulations driving the need for reliable communication systems.
Challenges:
- High initial investment costs associated with upgrading existing infrastructure.
- Supply chain disruptions impacting material availability and production costs.
- Competition from emerging wireless communication technologies.
Emerging Opportunities in Marine Network Cable
The market presents opportunities in several areas. The expansion of the recreational boating market in emerging economies presents a significant growth opportunity. Further development of high-speed, low-latency fiber optic cables for demanding applications offers another avenue for expansion. Finally, the increasing integration of network cables into broader marine IoT ecosystems presents numerous opportunities for growth and innovation.
Growth Accelerators in the Marine Network Cable Industry
Technological advancements in cable materials and manufacturing processes are driving cost reductions and improving product performance. Strategic partnerships between cable manufacturers and marine electronics companies are streamlining the integration of network cables into onboard systems. Expansion into emerging markets with robust growth potential in the marine sector will further accelerate market growth.
Notable Milestones in Marine Network Cable Sector
- 2020-Q4: Navico launches a new range of high-speed Ethernet cables for improved data transfer rates.
- 2022-Q1: Garmin introduces a new fiber optic cable designed for demanding marine environments.
- 2023-Q3: Raymarine announces a partnership with a cable manufacturer to improve supply chain efficiency.
In-Depth Marine Network Cable Market Outlook
The marine network cable market is poised for continued growth over the forecast period (2025-2033), driven by technological innovation, increasing adoption of integrated systems, and expansion into new markets. Strategic investments in R&D, strategic partnerships, and focused expansion into high-growth segments will be crucial for success in this dynamic market. The long-term outlook is positive, suggesting significant opportunities for players who can adapt to technological advancements and meet the evolving needs of the marine industry.
Marine Network Cable Segmentation
-
1. Application
- 1.1. Marine Communication Systems
- 1.2. Entertainment and Multimedia Systems
- 1.3. Navigation and Control Systems
- 1.4. Others
-
2. Types
- 2.1. Cat5e
- 2.2. Cat6
Marine Network Cable Segmentation By Geography
-
1. North America
- 1.1. United States
- 1.2. Canada
- 1.3. Mexico
-
2. South America
- 2.1. Brazil
- 2.2. Argentina
- 2.3. Rest of South America
-
3. Europe
- 3.1. United Kingdom
- 3.2. Germany
- 3.3. France
- 3.4. Italy
- 3.5. Spain
- 3.6. Russia
- 3.7. Benelux
- 3.8. Nordics
- 3.9. Rest of Europe
-
4. Middle East & Africa
- 4.1. Turkey
- 4.2. Israel
- 4.3. GCC
- 4.4. North Africa
- 4.5. South Africa
- 4.6. Rest of Middle East & Africa
-
5. Asia Pacific
- 5.1. China
- 5.2. India
- 5.3. Japan
- 5.4. South Korea
- 5.5. ASEAN
- 5.6. Oceania
- 5.7. Rest of Asia Pacific
Marine Network Cable Regional Market Share
Geographic Coverage of Marine Network Cable
Marine Network Cable REPORT HIGHLIGHTS
| Aspects | Details |
|---|---|
| Study Period | 2020-2034 |
| Base Year | 2025 |
| Estimated Year | 2026 |
| Forecast Period | 2026-2034 |
| Historical Period | 2020-2025 |
| Growth Rate | CAGR of 8.7% from 2020-2034 |
| Segmentation |
|
Table of Contents
- 1. Introduction
- 1.1. Research Scope
- 1.2. Market Segmentation
- 1.3. Research Objective
- 1.4. Definitions and Assumptions
- 2. Executive Summary
- 2.1. Market Snapshot
- 3. Market Dynamics
- 3.1. Market Drivers
- 3.2. Market Restrains
- 3.3. Market Trends
- 3.4. Market Opportunities
- 4. Market Factor Analysis
- 4.1. Porters Five Forces
- 4.1.1. Bargaining Power of Suppliers
- 4.1.2. Bargaining Power of Buyers
- 4.1.3. Threat of New Entrants
- 4.1.4. Threat of Substitutes
- 4.1.5. Competitive Rivalry
- 4.2. PESTEL analysis
- 4.3. BCG Analysis
- 4.3.1. Stars (High Growth, High Market Share)
- 4.3.2. Cash Cows (Low Growth, High Market Share)
- 4.3.3. Question Mark (High Growth, Low Market Share)
- 4.3.4. Dogs (Low Growth, Low Market Share)
- 4.4. Ansoff Matrix Analysis
- 4.5. Supply Chain Analysis
- 4.6. Regulatory Landscape
- 4.7. Current Market Potential and Opportunity Assessment (TAM–SAM–SOM Framework)
- 4.8. VDR Analyst Note
- 4.1. Porters Five Forces
- 5. Market Analysis, Insights and Forecast 2021-2033
- 5.1. Market Analysis, Insights and Forecast - by Application
- 5.1.1. Marine Communication Systems
- 5.1.2. Entertainment and Multimedia Systems
- 5.1.3. Navigation and Control Systems
- 5.1.4. Others
- 5.2. Market Analysis, Insights and Forecast - by Types
- 5.2.1. Cat5e
- 5.2.2. Cat6
- 5.3. Market Analysis, Insights and Forecast - by Region
- 5.3.1. North America
- 5.3.2. South America
- 5.3.3. Europe
- 5.3.4. Middle East & Africa
- 5.3.5. Asia Pacific
- 5.1. Market Analysis, Insights and Forecast - by Application
- 6. Global Marine Network Cable Analysis, Insights and Forecast, 2021-2033
- 6.1. Market Analysis, Insights and Forecast - by Application
- 6.1.1. Marine Communication Systems
- 6.1.2. Entertainment and Multimedia Systems
- 6.1.3. Navigation and Control Systems
- 6.1.4. Others
- 6.2. Market Analysis, Insights and Forecast - by Types
- 6.2.1. Cat5e
- 6.2.2. Cat6
- 6.1. Market Analysis, Insights and Forecast - by Application
- 7. North America Marine Network Cable Analysis, Insights and Forecast, 2021-2033
- 7.1. Market Analysis, Insights and Forecast - by Application
- 7.1.1. Marine Communication Systems
- 7.1.2. Entertainment and Multimedia Systems
- 7.1.3. Navigation and Control Systems
- 7.1.4. Others
- 7.2. Market Analysis, Insights and Forecast - by Types
- 7.2.1. Cat5e
- 7.2.2. Cat6
- 7.1. Market Analysis, Insights and Forecast - by Application
- 8. South America Marine Network Cable Analysis, Insights and Forecast, 2021-2033
- 8.1. Market Analysis, Insights and Forecast - by Application
- 8.1.1. Marine Communication Systems
- 8.1.2. Entertainment and Multimedia Systems
- 8.1.3. Navigation and Control Systems
- 8.1.4. Others
- 8.2. Market Analysis, Insights and Forecast - by Types
- 8.2.1. Cat5e
- 8.2.2. Cat6
- 8.1. Market Analysis, Insights and Forecast - by Application
- 9. Europe Marine Network Cable Analysis, Insights and Forecast, 2021-2033
- 9.1. Market Analysis, Insights and Forecast - by Application
- 9.1.1. Marine Communication Systems
- 9.1.2. Entertainment and Multimedia Systems
- 9.1.3. Navigation and Control Systems
- 9.1.4. Others
- 9.2. Market Analysis, Insights and Forecast - by Types
- 9.2.1. Cat5e
- 9.2.2. Cat6
- 9.1. Market Analysis, Insights and Forecast - by Application
- 10. Middle East & Africa Marine Network Cable Analysis, Insights and Forecast, 2021-2033
- 10.1. Market Analysis, Insights and Forecast - by Application
- 10.1.1. Marine Communication Systems
- 10.1.2. Entertainment and Multimedia Systems
- 10.1.3. Navigation and Control Systems
- 10.1.4. Others
- 10.2. Market Analysis, Insights and Forecast - by Types
- 10.2.1. Cat5e
- 10.2.2. Cat6
- 10.1. Market Analysis, Insights and Forecast - by Application
- 11. Asia Pacific Marine Network Cable Analysis, Insights and Forecast, 2021-2033
- 11.1. Market Analysis, Insights and Forecast - by Application
- 11.1.1. Marine Communication Systems
- 11.1.2. Entertainment and Multimedia Systems
- 11.1.3. Navigation and Control Systems
- 11.1.4. Others
- 11.2. Market Analysis, Insights and Forecast - by Types
- 11.2.1. Cat5e
- 11.2.2. Cat6
- 11.1. Market Analysis, Insights and Forecast - by Application
- 12. Competitive Analysis
- 12.1. Company Profiles
- 12.1.1 Garmin
- 12.1.1.1. Company Overview
- 12.1.1.2. Products
- 12.1.1.3. Company Financials
- 12.1.1.4. SWOT Analysis
- 12.1.2 Raymarine
- 12.1.2.1. Company Overview
- 12.1.2.2. Products
- 12.1.2.3. Company Financials
- 12.1.2.4. SWOT Analysis
- 12.1.3 Humminbird
- 12.1.3.1. Company Overview
- 12.1.3.2. Products
- 12.1.3.3. Company Financials
- 12.1.3.4. SWOT Analysis
- 12.1.4 Furuno
- 12.1.4.1. Company Overview
- 12.1.4.2. Products
- 12.1.4.3. Company Financials
- 12.1.4.4. SWOT Analysis
- 12.1.5 Navico
- 12.1.5.1. Company Overview
- 12.1.5.2. Products
- 12.1.5.3. Company Financials
- 12.1.5.4. SWOT Analysis
- 12.1.6 Simrad
- 12.1.6.1. Company Overview
- 12.1.6.2. Products
- 12.1.6.3. Company Financials
- 12.1.6.4. SWOT Analysis
- 12.1.7 JRC
- 12.1.7.1. Company Overview
- 12.1.7.2. Products
- 12.1.7.3. Company Financials
- 12.1.7.4. SWOT Analysis
- 12.1.8 B&G
- 12.1.8.1. Company Overview
- 12.1.8.2. Products
- 12.1.8.3. Company Financials
- 12.1.8.4. SWOT Analysis
- 12.1.1 Garmin
- 12.2. Market Entropy
- 12.2.1 Company's Key Areas Served
- 12.2.2 Recent Developments
- 12.3. Company Market Share Analysis 2025
- 12.3.1 Top 5 Companies Market Share Analysis
- 12.3.2 Top 3 Companies Market Share Analysis
- 12.4. List of Potential Customers
- 13. Research Methodology
List of Figures
- Figure 1: Global Marine Network Cable Revenue Breakdown (undefined, %) by Region 2025 & 2033
- Figure 2: Global Marine Network Cable Volume Breakdown (K, %) by Region 2025 & 2033
- Figure 3: North America Marine Network Cable Revenue (undefined), by Application 2025 & 2033
- Figure 4: North America Marine Network Cable Volume (K), by Application 2025 & 2033
- Figure 5: North America Marine Network Cable Revenue Share (%), by Application 2025 & 2033
- Figure 6: North America Marine Network Cable Volume Share (%), by Application 2025 & 2033
- Figure 7: North America Marine Network Cable Revenue (undefined), by Types 2025 & 2033
- Figure 8: North America Marine Network Cable Volume (K), by Types 2025 & 2033
- Figure 9: North America Marine Network Cable Revenue Share (%), by Types 2025 & 2033
- Figure 10: North America Marine Network Cable Volume Share (%), by Types 2025 & 2033
- Figure 11: North America Marine Network Cable Revenue (undefined), by Country 2025 & 2033
- Figure 12: North America Marine Network Cable Volume (K), by Country 2025 & 2033
- Figure 13: North America Marine Network Cable Revenue Share (%), by Country 2025 & 2033
- Figure 14: North America Marine Network Cable Volume Share (%), by Country 2025 & 2033
- Figure 15: South America Marine Network Cable Revenue (undefined), by Application 2025 & 2033
- Figure 16: South America Marine Network Cable Volume (K), by Application 2025 & 2033
- Figure 17: South America Marine Network Cable Revenue Share (%), by Application 2025 & 2033
- Figure 18: South America Marine Network Cable Volume Share (%), by Application 2025 & 2033
- Figure 19: South America Marine Network Cable Revenue (undefined), by Types 2025 & 2033
- Figure 20: South America Marine Network Cable Volume (K), by Types 2025 & 2033
- Figure 21: South America Marine Network Cable Revenue Share (%), by Types 2025 & 2033
- Figure 22: South America Marine Network Cable Volume Share (%), by Types 2025 & 2033
- Figure 23: South America Marine Network Cable Revenue (undefined), by Country 2025 & 2033
- Figure 24: South America Marine Network Cable Volume (K), by Country 2025 & 2033
- Figure 25: South America Marine Network Cable Revenue Share (%), by Country 2025 & 2033
- Figure 26: South America Marine Network Cable Volume Share (%), by Country 2025 & 2033
- Figure 27: Europe Marine Network Cable Revenue (undefined), by Application 2025 & 2033
- Figure 28: Europe Marine Network Cable Volume (K), by Application 2025 & 2033
- Figure 29: Europe Marine Network Cable Revenue Share (%), by Application 2025 & 2033
- Figure 30: Europe Marine Network Cable Volume Share (%), by Application 2025 & 2033
- Figure 31: Europe Marine Network Cable Revenue (undefined), by Types 2025 & 2033
- Figure 32: Europe Marine Network Cable Volume (K), by Types 2025 & 2033
- Figure 33: Europe Marine Network Cable Revenue Share (%), by Types 2025 & 2033
- Figure 34: Europe Marine Network Cable Volume Share (%), by Types 2025 & 2033
- Figure 35: Europe Marine Network Cable Revenue (undefined), by Country 2025 & 2033
- Figure 36: Europe Marine Network Cable Volume (K), by Country 2025 & 2033
- Figure 37: Europe Marine Network Cable Revenue Share (%), by Country 2025 & 2033
- Figure 38: Europe Marine Network Cable Volume Share (%), by Country 2025 & 2033
- Figure 39: Middle East & Africa Marine Network Cable Revenue (undefined), by Application 2025 & 2033
- Figure 40: Middle East & Africa Marine Network Cable Volume (K), by Application 2025 & 2033
- Figure 41: Middle East & Africa Marine Network Cable Revenue Share (%), by Application 2025 & 2033
- Figure 42: Middle East & Africa Marine Network Cable Volume Share (%), by Application 2025 & 2033
- Figure 43: Middle East & Africa Marine Network Cable Revenue (undefined), by Types 2025 & 2033
- Figure 44: Middle East & Africa Marine Network Cable Volume (K), by Types 2025 & 2033
- Figure 45: Middle East & Africa Marine Network Cable Revenue Share (%), by Types 2025 & 2033
- Figure 46: Middle East & Africa Marine Network Cable Volume Share (%), by Types 2025 & 2033
- Figure 47: Middle East & Africa Marine Network Cable Revenue (undefined), by Country 2025 & 2033
- Figure 48: Middle East & Africa Marine Network Cable Volume (K), by Country 2025 & 2033
- Figure 49: Middle East & Africa Marine Network Cable Revenue Share (%), by Country 2025 & 2033
- Figure 50: Middle East & Africa Marine Network Cable Volume Share (%), by Country 2025 & 2033
- Figure 51: Asia Pacific Marine Network Cable Revenue (undefined), by Application 2025 & 2033
- Figure 52: Asia Pacific Marine Network Cable Volume (K), by Application 2025 & 2033
- Figure 53: Asia Pacific Marine Network Cable Revenue Share (%), by Application 2025 & 2033
- Figure 54: Asia Pacific Marine Network Cable Volume Share (%), by Application 2025 & 2033
- Figure 55: Asia Pacific Marine Network Cable Revenue (undefined), by Types 2025 & 2033
- Figure 56: Asia Pacific Marine Network Cable Volume (K), by Types 2025 & 2033
- Figure 57: Asia Pacific Marine Network Cable Revenue Share (%), by Types 2025 & 2033
- Figure 58: Asia Pacific Marine Network Cable Volume Share (%), by Types 2025 & 2033
- Figure 59: Asia Pacific Marine Network Cable Revenue (undefined), by Country 2025 & 2033
- Figure 60: Asia Pacific Marine Network Cable Volume (K), by Country 2025 & 2033
- Figure 61: Asia Pacific Marine Network Cable Revenue Share (%), by Country 2025 & 2033
- Figure 62: Asia Pacific Marine Network Cable Volume Share (%), by Country 2025 & 2033
List of Tables
- Table 1: Global Marine Network Cable Revenue undefined Forecast, by Application 2020 & 2033
- Table 2: Global Marine Network Cable Volume K Forecast, by Application 2020 & 2033
- Table 3: Global Marine Network Cable Revenue undefined Forecast, by Types 2020 & 2033
- Table 4: Global Marine Network Cable Volume K Forecast, by Types 2020 & 2033
- Table 5: Global Marine Network Cable Revenue undefined Forecast, by Region 2020 & 2033
- Table 6: Global Marine Network Cable Volume K Forecast, by Region 2020 & 2033
- Table 7: Global Marine Network Cable Revenue undefined Forecast, by Application 2020 & 2033
- Table 8: Global Marine Network Cable Volume K Forecast, by Application 2020 & 2033
- Table 9: Global Marine Network Cable Revenue undefined Forecast, by Types 2020 & 2033
- Table 10: Global Marine Network Cable Volume K Forecast, by Types 2020 & 2033
- Table 11: Global Marine Network Cable Revenue undefined Forecast, by Country 2020 & 2033
- Table 12: Global Marine Network Cable Volume K Forecast, by Country 2020 & 2033
- Table 13: United States Marine Network Cable Revenue (undefined) Forecast, by Application 2020 & 2033
- Table 14: United States Marine Network Cable Volume (K) Forecast, by Application 2020 & 2033
- Table 15: Canada Marine Network Cable Revenue (undefined) Forecast, by Application 2020 & 2033
- Table 16: Canada Marine Network Cable Volume (K) Forecast, by Application 2020 & 2033
- Table 17: Mexico Marine Network Cable Revenue (undefined) Forecast, by Application 2020 & 2033
- Table 18: Mexico Marine Network Cable Volume (K) Forecast, by Application 2020 & 2033
- Table 19: Global Marine Network Cable Revenue undefined Forecast, by Application 2020 & 2033
- Table 20: Global Marine Network Cable Volume K Forecast, by Application 2020 & 2033
- Table 21: Global Marine Network Cable Revenue undefined Forecast, by Types 2020 & 2033
- Table 22: Global Marine Network Cable Volume K Forecast, by Types 2020 & 2033
- Table 23: Global Marine Network Cable Revenue undefined Forecast, by Country 2020 & 2033
- Table 24: Global Marine Network Cable Volume K Forecast, by Country 2020 & 2033
- Table 25: Brazil Marine Network Cable Revenue (undefined) Forecast, by Application 2020 & 2033
- Table 26: Brazil Marine Network Cable Volume (K) Forecast, by Application 2020 & 2033
- Table 27: Argentina Marine Network Cable Revenue (undefined) Forecast, by Application 2020 & 2033
- Table 28: Argentina Marine Network Cable Volume (K) Forecast, by Application 2020 & 2033
- Table 29: Rest of South America Marine Network Cable Revenue (undefined) Forecast, by Application 2020 & 2033
- Table 30: Rest of South America Marine Network Cable Volume (K) Forecast, by Application 2020 & 2033
- Table 31: Global Marine Network Cable Revenue undefined Forecast, by Application 2020 & 2033
- Table 32: Global Marine Network Cable Volume K Forecast, by Application 2020 & 2033
- Table 33: Global Marine Network Cable Revenue undefined Forecast, by Types 2020 & 2033
- Table 34: Global Marine Network Cable Volume K Forecast, by Types 2020 & 2033
- Table 35: Global Marine Network Cable Revenue undefined Forecast, by Country 2020 & 2033
- Table 36: Global Marine Network Cable Volume K Forecast, by Country 2020 & 2033
- Table 37: United Kingdom Marine Network Cable Revenue (undefined) Forecast, by Application 2020 & 2033
- Table 38: United Kingdom Marine Network Cable Volume (K) Forecast, by Application 2020 & 2033
- Table 39: Germany Marine Network Cable Revenue (undefined) Forecast, by Application 2020 & 2033
- Table 40: Germany Marine Network Cable Volume (K) Forecast, by Application 2020 & 2033
- Table 41: France Marine Network Cable Revenue (undefined) Forecast, by Application 2020 & 2033
- Table 42: France Marine Network Cable Volume (K) Forecast, by Application 2020 & 2033
- Table 43: Italy Marine Network Cable Revenue (undefined) Forecast, by Application 2020 & 2033
- Table 44: Italy Marine Network Cable Volume (K) Forecast, by Application 2020 & 2033
- Table 45: Spain Marine Network Cable Revenue (undefined) Forecast, by Application 2020 & 2033
- Table 46: Spain Marine Network Cable Volume (K) Forecast, by Application 2020 & 2033
- Table 47: Russia Marine Network Cable Revenue (undefined) Forecast, by Application 2020 & 2033
- Table 48: Russia Marine Network Cable Volume (K) Forecast, by Application 2020 & 2033
- Table 49: Benelux Marine Network Cable Revenue (undefined) Forecast, by Application 2020 & 2033
- Table 50: Benelux Marine Network Cable Volume (K) Forecast, by Application 2020 & 2033
- Table 51: Nordics Marine Network Cable Revenue (undefined) Forecast, by Application 2020 & 2033
- Table 52: Nordics Marine Network Cable Volume (K) Forecast, by Application 2020 & 2033
- Table 53: Rest of Europe Marine Network Cable Revenue (undefined) Forecast, by Application 2020 & 2033
- Table 54: Rest of Europe Marine Network Cable Volume (K) Forecast, by Application 2020 & 2033
- Table 55: Global Marine Network Cable Revenue undefined Forecast, by Application 2020 & 2033
- Table 56: Global Marine Network Cable Volume K Forecast, by Application 2020 & 2033
- Table 57: Global Marine Network Cable Revenue undefined Forecast, by Types 2020 & 2033
- Table 58: Global Marine Network Cable Volume K Forecast, by Types 2020 & 2033
- Table 59: Global Marine Network Cable Revenue undefined Forecast, by Country 2020 & 2033
- Table 60: Global Marine Network Cable Volume K Forecast, by Country 2020 & 2033
- Table 61: Turkey Marine Network Cable Revenue (undefined) Forecast, by Application 2020 & 2033
- Table 62: Turkey Marine Network Cable Volume (K) Forecast, by Application 2020 & 2033
- Table 63: Israel Marine Network Cable Revenue (undefined) Forecast, by Application 2020 & 2033
- Table 64: Israel Marine Network Cable Volume (K) Forecast, by Application 2020 & 2033
- Table 65: GCC Marine Network Cable Revenue (undefined) Forecast, by Application 2020 & 2033
- Table 66: GCC Marine Network Cable Volume (K) Forecast, by Application 2020 & 2033
- Table 67: North Africa Marine Network Cable Revenue (undefined) Forecast, by Application 2020 & 2033
- Table 68: North Africa Marine Network Cable Volume (K) Forecast, by Application 2020 & 2033
- Table 69: South Africa Marine Network Cable Revenue (undefined) Forecast, by Application 2020 & 2033
- Table 70: South Africa Marine Network Cable Volume (K) Forecast, by Application 2020 & 2033
- Table 71: Rest of Middle East & Africa Marine Network Cable Revenue (undefined) Forecast, by Application 2020 & 2033
- Table 72: Rest of Middle East & Africa Marine Network Cable Volume (K) Forecast, by Application 2020 & 2033
- Table 73: Global Marine Network Cable Revenue undefined Forecast, by Application 2020 & 2033
- Table 74: Global Marine Network Cable Volume K Forecast, by Application 2020 & 2033
- Table 75: Global Marine Network Cable Revenue undefined Forecast, by Types 2020 & 2033
- Table 76: Global Marine Network Cable Volume K Forecast, by Types 2020 & 2033
- Table 77: Global Marine Network Cable Revenue undefined Forecast, by Country 2020 & 2033
- Table 78: Global Marine Network Cable Volume K Forecast, by Country 2020 & 2033
- Table 79: China Marine Network Cable Revenue (undefined) Forecast, by Application 2020 & 2033
- Table 80: China Marine Network Cable Volume (K) Forecast, by Application 2020 & 2033
- Table 81: India Marine Network Cable Revenue (undefined) Forecast, by Application 2020 & 2033
- Table 82: India Marine Network Cable Volume (K) Forecast, by Application 2020 & 2033
- Table 83: Japan Marine Network Cable Revenue (undefined) Forecast, by Application 2020 & 2033
- Table 84: Japan Marine Network Cable Volume (K) Forecast, by Application 2020 & 2033
- Table 85: South Korea Marine Network Cable Revenue (undefined) Forecast, by Application 2020 & 2033
- Table 86: South Korea Marine Network Cable Volume (K) Forecast, by Application 2020 & 2033
- Table 87: ASEAN Marine Network Cable Revenue (undefined) Forecast, by Application 2020 & 2033
- Table 88: ASEAN Marine Network Cable Volume (K) Forecast, by Application 2020 & 2033
- Table 89: Oceania Marine Network Cable Revenue (undefined) Forecast, by Application 2020 & 2033
- Table 90: Oceania Marine Network Cable Volume (K) Forecast, by Application 2020 & 2033
- Table 91: Rest of Asia Pacific Marine Network Cable Revenue (undefined) Forecast, by Application 2020 & 2033
- Table 92: Rest of Asia Pacific Marine Network Cable Volume (K) Forecast, by Application 2020 & 2033
Frequently Asked Questions
1. What is the projected Compound Annual Growth Rate (CAGR) of the Marine Network Cable?
The projected CAGR is approximately 8.7%.
2. Which companies are prominent players in the Marine Network Cable?
Key companies in the market include Garmin, Raymarine, Humminbird, Furuno, Navico, Simrad, JRC, B&G.
3. What are the main segments of the Marine Network Cable?
The market segments include Application, Types.
4. Can you provide details about the market size?
The market size is estimated to be USD XXX N/A as of 2022.
5. What are some drivers contributing to market growth?
N/A
6. What are the notable trends driving market growth?
N/A
7. Are there any restraints impacting market growth?
N/A
8. Can you provide examples of recent developments in the market?
N/A
9. What pricing options are available for accessing the report?
Pricing options include single-user, multi-user, and enterprise licenses priced at USD 4350.00, USD 6525.00, and USD 8700.00 respectively.
10. Is the market size provided in terms of value or volume?
The market size is provided in terms of value, measured in N/A and volume, measured in K.
11. Are there any specific market keywords associated with the report?
Yes, the market keyword associated with the report is "Marine Network Cable," which aids in identifying and referencing the specific market segment covered.
12. How do I determine which pricing option suits my needs best?
The pricing options vary based on user requirements and access needs. Individual users may opt for single-user licenses, while businesses requiring broader access may choose multi-user or enterprise licenses for cost-effective access to the report.
13. Are there any additional resources or data provided in the Marine Network Cable report?
While the report offers comprehensive insights, it's advisable to review the specific contents or supplementary materials provided to ascertain if additional resources or data are available.
14. How can I stay updated on further developments or reports in the Marine Network Cable?
To stay informed about further developments, trends, and reports in the Marine Network Cable, consider subscribing to industry newsletters, following relevant companies and organizations, or regularly checking reputable industry news sources and publications.
Methodology
Step 1 - Identification of Relevant Samples Size from Population Database


Step 2 - Approaches for Defining Global Market Size (Value, Volume* & Price*)

Note*: In applicable scenarios
Step 3 - Data Sources
Primary Research
- Web Analytics
- Survey Reports
- Research Institute
- Latest Research Reports
- Opinion Leaders
Secondary Research
- Annual Reports
- White Paper
- Latest Press Release
- Industry Association
- Paid Database
- Investor Presentations

Step 4 - Data Triangulation
Involves using different sources of information in order to increase the validity of a study
These sources are likely to be stakeholders in a program - participants, other researchers, program staff, other community members, and so on.
Then we put all data in single framework & apply various statistical tools to find out the dynamic on the market.
During the analysis stage, feedback from the stakeholder groups would be compared to determine areas of agreement as well as areas of divergence

