
Key Insights
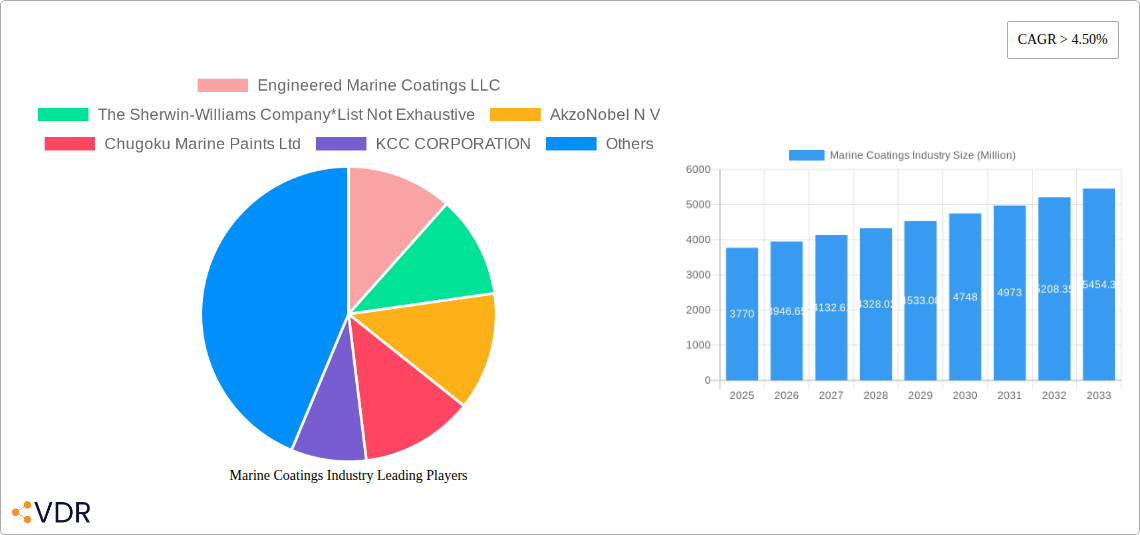
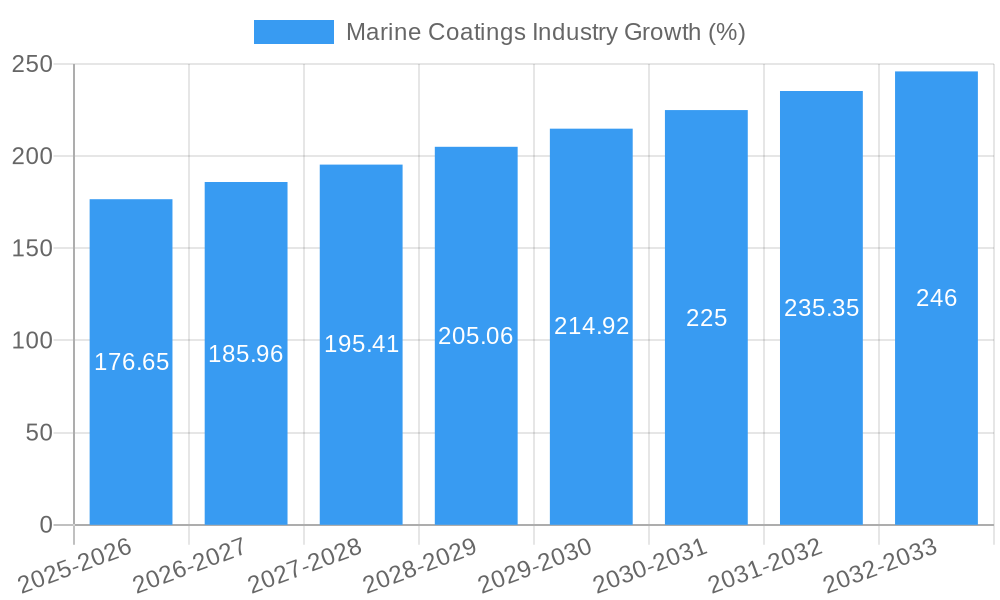
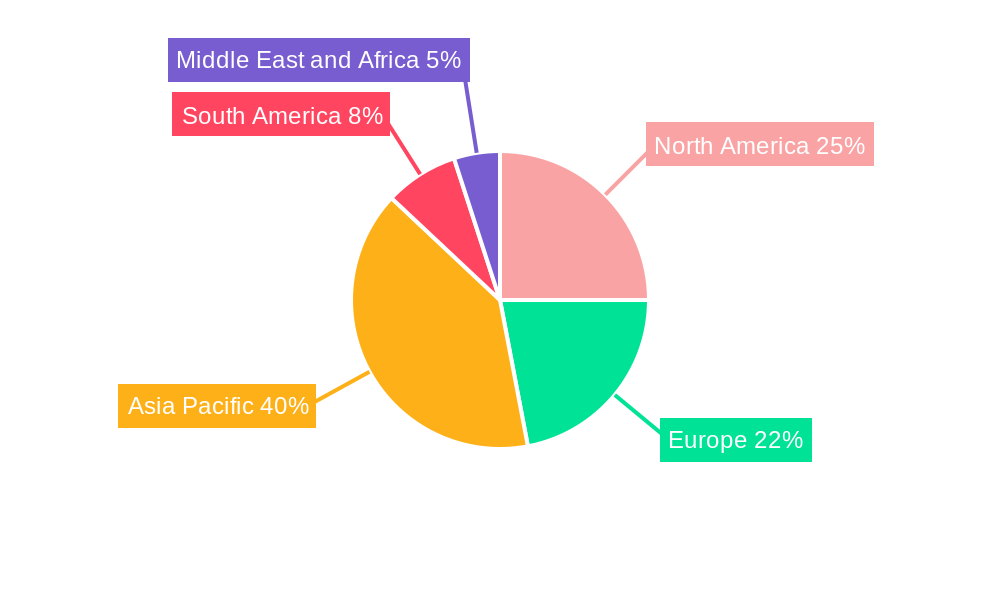
The marine coatings market, valued at $3.77 billion in 2025, is projected for robust growth, exhibiting a Compound Annual Growth Rate (CAGR) exceeding 4.5% from 2025 to 2033. This expansion is fueled by several key drivers. Increasing global maritime trade necessitates frequent ship maintenance and repainting, boosting demand for anti-corrosion and antifouling coatings. Stringent environmental regulations are pushing the adoption of eco-friendly water-borne and UV-cured coatings, replacing traditional solvent-borne options. Furthermore, the growing leisure boating sector and offshore energy exploration activities contribute significantly to market growth. Segment-wise, the marine OEM (Original Equipment Manufacturer) application segment holds a substantial market share, driven by new vessel construction. However, the marine aftermarket segment is anticipated to witness faster growth due to the increasing age of the global shipping fleet requiring regular maintenance and repairs. Epoxy and polyurethane resins dominate the market due to their superior performance characteristics, while technological advancements in powder coatings are gaining traction for their efficiency and reduced environmental impact. Geographically, the Asia-Pacific region, particularly China and India, leads in market size owing to its extensive shipbuilding and shipping activities. However, North America and Europe are expected to experience steady growth driven by stringent environmental regulations and a focus on sustainable maritime practices. Major players like AkzoNobel, Jotun, and Sherwin-Williams are actively engaged in innovation and market expansion, further shaping the competitive landscape.
The competitive landscape is characterized by both established multinational corporations and specialized marine coatings manufacturers. Companies are increasingly focusing on developing advanced coatings with enhanced durability, improved corrosion resistance, and reduced environmental impact. Strategic partnerships, mergers and acquisitions, and investments in research and development are key strategies adopted by market players to maintain a competitive edge. The market faces challenges such as fluctuating raw material prices and economic downturns impacting investment in shipping and marine infrastructure. However, the long-term outlook remains positive, driven by ongoing growth in global shipping, stricter environmental regulations, and the continuous demand for high-performance marine coatings that protect vessels and extend their lifespan. The forecasted market size for 2033 can be estimated by extrapolating the CAGR; however, providing a precise figure without further data would be speculative.
Marine Coatings Industry Market Report: 2019-2033
This comprehensive report provides a detailed analysis of the global marine coatings market, encompassing market size, growth trends, competitive landscape, and future outlook. With a focus on key segments – including marine OEM and aftermarket applications, along with anti-corrosion, antifouling, and other specialized coatings – this report offers invaluable insights for industry professionals, investors, and strategic decision-makers. The study period covers 2019-2033, with 2025 serving as the base and estimated year.
Marine Coatings Industry Market Dynamics & Structure
The global marine coatings market is characterized by a moderately consolidated structure with key players such as AkzoNobel N.V., Jotun, PPG Industries Inc., and Sherwin-Williams Company holding significant market share. The market size in 2024 is estimated at xx Million, and is projected to reach xx Million by 2033. Technological innovation, particularly in areas like environmentally friendly waterborne coatings and advanced antifouling technologies, is a major driver. Stringent environmental regulations, such as those imposed by the IMO, are shaping product development and increasing demand for sustainable solutions. Competitive pressures are significant, driven by product differentiation and cost optimization. The prevalence of mergers and acquisitions (M&A) activity reflects consolidation trends within the industry.
- Market Concentration: Highly concentrated, with top 5 players holding approximately xx% market share in 2024.
- Technological Innovation: Focus on waterborne, UV-cured, and foul-release coatings; increasing R&D investment.
- Regulatory Framework: Stringent environmental regulations driving adoption of eco-friendly coatings.
- Competitive Substitutes: Limited direct substitutes, competition primarily focused on performance and price.
- M&A Activity: Moderate level of M&A activity observed in the recent years, with xx major deals recorded between 2019 and 2024. Deal value totalled approximately xx Million.
- Innovation Barriers: High R&D costs, stringent regulatory approval processes.
Marine Coatings Industry Growth Trends & Insights
The marine coatings market experienced steady growth during the historical period (2019-2024), driven by increasing shipbuilding activity, expanding global shipping fleet, and rising demand for protective and performance-enhancing coatings. The market is expected to exhibit a CAGR of xx% during the forecast period (2025-2033), reaching a projected value of xx Million by 2033. Technological advancements, such as the introduction of high-performance coatings with reduced environmental impact, are accelerating market growth. The increasing adoption of eco-friendly waterborne and UV-cured coatings is a key trend. Shifting consumer preferences towards enhanced durability, longevity, and reduced maintenance costs are also driving market demand. Market penetration of high-performance coatings is projected to reach xx% by 2033.
Dominant Regions, Countries, or Segments in Marine Coatings Industry
The Asia-Pacific region dominates the marine coatings market, driven by substantial shipbuilding and shipping activities in countries like China, Japan, South Korea, and Singapore. Within the application segments, the marine OEM segment holds the largest market share, followed by the marine aftermarket segment. In terms of coating types, anti-corrosion coatings dominate due to the crucial role in protecting marine vessels from rust and corrosion. Epoxy resins remain the most widely used resin type, followed by polyurethane and acrylic. Waterborne coatings are gaining traction due to their environmental benefits.
- Key Drivers: Robust shipbuilding industry in Asia-Pacific, increasing global shipping traffic, and stringent environmental regulations.
- Dominant Segments: Marine OEM application, anti-corrosion coatings, epoxy resins, and waterborne technology.
- Growth Potential: Significant growth potential exists in developing economies and emerging markets.
Marine Coatings Industry Product Landscape
The marine coatings market offers a wide range of products catering to diverse needs, from high-performance anti-corrosion and antifouling coatings to specialized solutions like foul-release and moisture-cure coatings. Key innovations focus on enhancing durability, improving environmental performance, and reducing maintenance costs. Product differentiation is achieved through superior performance characteristics, extended lifespan, and eco-friendly formulations. Advancements in resin chemistry and coating technology are leading to the development of high-performance coatings that deliver superior protection and extended service life.
Key Drivers, Barriers & Challenges in Marine Coatings Industry
Key Drivers:
- Growing global shipping fleet and shipbuilding activities.
- Increasing demand for protective and performance-enhancing coatings.
- Stringent environmental regulations promoting eco-friendly solutions.
- Technological advancements leading to improved coating performance.
Key Challenges & Restraints:
- Volatility in raw material prices and supply chain disruptions.
- Stringent regulatory approvals and compliance requirements.
- Intense competition from established players and new entrants.
- Economic downturns impacting investment in shipbuilding and shipping.
Emerging Opportunities in Marine Coatings Industry
- Growing demand for eco-friendly and sustainable coatings.
- Expansion into niche markets such as offshore wind energy and aquaculture.
- Development of specialized coatings for specific applications, such as high-speed vessels and LNG carriers.
- Adoption of digital technologies for improved coating application and monitoring.
Growth Accelerators in the Marine Coatings Industry
Technological breakthroughs, such as the development of self-healing coatings and advanced antifouling technologies, are driving long-term growth. Strategic partnerships and collaborations between coating manufacturers and shipbuilders are fostering innovation and market expansion. The adoption of sustainable and environmentally friendly solutions is further accelerating market growth.
Key Players Shaping the Marine Coatings Industry Market
- Engineered Marine Coatings LLC
- The Sherwin-Williams Company
- AkzoNobel N.V.
- Chugoku Marine Paints Ltd
- KCC CORPORATION
- Jotun
- RPM International Inc
- Kansai Paint Marine Co Ltd
- Pettit Marine Paints
- PPG Industries Inc
- BOERO BARTOLOMEO S.p.A
- Nippon Paint Marine Coatings Co Ltd
- BASF SE
- Axalta Coating Systems
- Hempel A/S
- MCU COATING INTERNATIONAL
Notable Milestones in Marine Coatings Industry Sector
- March 2023: PPG launched the PPG SIGMAGLIDE 2390 marine coating, focusing on reduced power consumption and carbon emissions.
- March 2023: Hempel joined the IMO's Global Industry Alliance for Marine Biosafety, aiming to reduce shipping emissions and invasive species spread.
In-Depth Marine Coatings Industry Market Outlook
The marine coatings market is poised for continued growth, driven by technological innovation, increasing environmental regulations, and expansion into new markets. Strategic partnerships and collaborations will play a crucial role in shaping the industry's future. Opportunities exist in developing sustainable, high-performance coatings that address the evolving needs of the shipping and shipbuilding industries. The market's long-term potential is significant, with sustained growth projected over the forecast period.
Marine Coatings Industry Segmentation
-
1. Type
- 1.1. Anti-corrosion
- 1.2. Antifouling
- 1.3. Other Types (Foul Release, Moisture Cure, etc.)
-
2. Resin
- 2.1. Epoxy
- 2.2. Polyurethane
- 2.3. Acrylic
- 2.4. Alkyd
- 2.5. Other Resins (Polyester, Fluoropolymer, etc.)
-
3. Technology
- 3.1. Water-borne
- 3.2. Solvent-borne
- 3.3. UV-cured
- 3.4. Powder Coatings
-
4. Application
- 4.1. Marine OEM
- 4.2. Marine Aftermarket
Marine Coatings Industry Segmentation By Geography
-
1. Asia Pacific
- 1.1. China
- 1.2. India
- 1.3. Japan
- 1.4. South Korea
- 1.5. Malaysia
- 1.6. Vietnam
- 1.7. Rest of Asia Pacific
-
2. North America
- 2.1. United States
- 2.2. Canada
- 2.3. Mexico
-
3. Europe
- 3.1. Germany
- 3.2. United Kingdom
- 3.3. Italy
- 3.4. France
- 3.5. Rest of Europe
-
4. South America
- 4.1. Brazil
- 4.2. Argentina
- 4.3. Rest of South America
-
5. Middle East and Africa
- 5.1. Saudi Arabia
- 5.2. South Africa
- 5.3. Rest of Middle East and Africa
Marine Coatings Industry REPORT HIGHLIGHTS
| Aspects | Details |
|---|---|
| Study Period | 2019-2033 |
| Base Year | 2024 |
| Estimated Year | 2025 |
| Forecast Period | 2025-2033 |
| Historical Period | 2019-2024 |
| Growth Rate | CAGR of > 4.50% from 2019-2033 |
| Segmentation |
|
Table of Contents
- 1. Introduction
- 1.1. Research Scope
- 1.2. Market Segmentation
- 1.3. Research Methodology
- 1.4. Definitions and Assumptions
- 2. Executive Summary
- 2.1. Introduction
- 3. Market Dynamics
- 3.1. Introduction
- 3.2. Market Drivers
- 3.2.1. Increase in Production of Leisure Boats and Cruise Ships; Growing Ship Repairs and Maintenance Activities
- 3.3. Market Restrains
- 3.3.1. Stringent Government Regulations; Sluggish Growth in Shipbuilding Activities in Few Countries
- 3.4. Market Trends
- 3.4.1. Marine OEM Application Segment to Dominate The Market
- 4. Market Factor Analysis
- 4.1. Porters Five Forces
- 4.2. Supply/Value Chain
- 4.3. PESTEL analysis
- 4.4. Market Entropy
- 4.5. Patent/Trademark Analysis
- 5. Global Marine Coatings Industry Analysis, Insights and Forecast, 2019-2031
- 5.1. Market Analysis, Insights and Forecast - by Type
- 5.1.1. Anti-corrosion
- 5.1.2. Antifouling
- 5.1.3. Other Types (Foul Release, Moisture Cure, etc.)
- 5.2. Market Analysis, Insights and Forecast - by Resin
- 5.2.1. Epoxy
- 5.2.2. Polyurethane
- 5.2.3. Acrylic
- 5.2.4. Alkyd
- 5.2.5. Other Resins (Polyester, Fluoropolymer, etc.)
- 5.3. Market Analysis, Insights and Forecast - by Technology
- 5.3.1. Water-borne
- 5.3.2. Solvent-borne
- 5.3.3. UV-cured
- 5.3.4. Powder Coatings
- 5.4. Market Analysis, Insights and Forecast - by Application
- 5.4.1. Marine OEM
- 5.4.2. Marine Aftermarket
- 5.5. Market Analysis, Insights and Forecast - by Region
- 5.5.1. Asia Pacific
- 5.5.2. North America
- 5.5.3. Europe
- 5.5.4. South America
- 5.5.5. Middle East and Africa
- 5.1. Market Analysis, Insights and Forecast - by Type
- 6. Asia Pacific Marine Coatings Industry Analysis, Insights and Forecast, 2019-2031
- 6.1. Market Analysis, Insights and Forecast - by Type
- 6.1.1. Anti-corrosion
- 6.1.2. Antifouling
- 6.1.3. Other Types (Foul Release, Moisture Cure, etc.)
- 6.2. Market Analysis, Insights and Forecast - by Resin
- 6.2.1. Epoxy
- 6.2.2. Polyurethane
- 6.2.3. Acrylic
- 6.2.4. Alkyd
- 6.2.5. Other Resins (Polyester, Fluoropolymer, etc.)
- 6.3. Market Analysis, Insights and Forecast - by Technology
- 6.3.1. Water-borne
- 6.3.2. Solvent-borne
- 6.3.3. UV-cured
- 6.3.4. Powder Coatings
- 6.4. Market Analysis, Insights and Forecast - by Application
- 6.4.1. Marine OEM
- 6.4.2. Marine Aftermarket
- 6.1. Market Analysis, Insights and Forecast - by Type
- 7. North America Marine Coatings Industry Analysis, Insights and Forecast, 2019-2031
- 7.1. Market Analysis, Insights and Forecast - by Type
- 7.1.1. Anti-corrosion
- 7.1.2. Antifouling
- 7.1.3. Other Types (Foul Release, Moisture Cure, etc.)
- 7.2. Market Analysis, Insights and Forecast - by Resin
- 7.2.1. Epoxy
- 7.2.2. Polyurethane
- 7.2.3. Acrylic
- 7.2.4. Alkyd
- 7.2.5. Other Resins (Polyester, Fluoropolymer, etc.)
- 7.3. Market Analysis, Insights and Forecast - by Technology
- 7.3.1. Water-borne
- 7.3.2. Solvent-borne
- 7.3.3. UV-cured
- 7.3.4. Powder Coatings
- 7.4. Market Analysis, Insights and Forecast - by Application
- 7.4.1. Marine OEM
- 7.4.2. Marine Aftermarket
- 7.1. Market Analysis, Insights and Forecast - by Type
- 8. Europe Marine Coatings Industry Analysis, Insights and Forecast, 2019-2031
- 8.1. Market Analysis, Insights and Forecast - by Type
- 8.1.1. Anti-corrosion
- 8.1.2. Antifouling
- 8.1.3. Other Types (Foul Release, Moisture Cure, etc.)
- 8.2. Market Analysis, Insights and Forecast - by Resin
- 8.2.1. Epoxy
- 8.2.2. Polyurethane
- 8.2.3. Acrylic
- 8.2.4. Alkyd
- 8.2.5. Other Resins (Polyester, Fluoropolymer, etc.)
- 8.3. Market Analysis, Insights and Forecast - by Technology
- 8.3.1. Water-borne
- 8.3.2. Solvent-borne
- 8.3.3. UV-cured
- 8.3.4. Powder Coatings
- 8.4. Market Analysis, Insights and Forecast - by Application
- 8.4.1. Marine OEM
- 8.4.2. Marine Aftermarket
- 8.1. Market Analysis, Insights and Forecast - by Type
- 9. South America Marine Coatings Industry Analysis, Insights and Forecast, 2019-2031
- 9.1. Market Analysis, Insights and Forecast - by Type
- 9.1.1. Anti-corrosion
- 9.1.2. Antifouling
- 9.1.3. Other Types (Foul Release, Moisture Cure, etc.)
- 9.2. Market Analysis, Insights and Forecast - by Resin
- 9.2.1. Epoxy
- 9.2.2. Polyurethane
- 9.2.3. Acrylic
- 9.2.4. Alkyd
- 9.2.5. Other Resins (Polyester, Fluoropolymer, etc.)
- 9.3. Market Analysis, Insights and Forecast - by Technology
- 9.3.1. Water-borne
- 9.3.2. Solvent-borne
- 9.3.3. UV-cured
- 9.3.4. Powder Coatings
- 9.4. Market Analysis, Insights and Forecast - by Application
- 9.4.1. Marine OEM
- 9.4.2. Marine Aftermarket
- 9.1. Market Analysis, Insights and Forecast - by Type
- 10. Middle East and Africa Marine Coatings Industry Analysis, Insights and Forecast, 2019-2031
- 10.1. Market Analysis, Insights and Forecast - by Type
- 10.1.1. Anti-corrosion
- 10.1.2. Antifouling
- 10.1.3. Other Types (Foul Release, Moisture Cure, etc.)
- 10.2. Market Analysis, Insights and Forecast - by Resin
- 10.2.1. Epoxy
- 10.2.2. Polyurethane
- 10.2.3. Acrylic
- 10.2.4. Alkyd
- 10.2.5. Other Resins (Polyester, Fluoropolymer, etc.)
- 10.3. Market Analysis, Insights and Forecast - by Technology
- 10.3.1. Water-borne
- 10.3.2. Solvent-borne
- 10.3.3. UV-cured
- 10.3.4. Powder Coatings
- 10.4. Market Analysis, Insights and Forecast - by Application
- 10.4.1. Marine OEM
- 10.4.2. Marine Aftermarket
- 10.1. Market Analysis, Insights and Forecast - by Type
- 11. Asia Pacific Marine Coatings Industry Analysis, Insights and Forecast, 2019-2031
- 11.1. Market Analysis, Insights and Forecast - By Country/Sub-region
- 11.1.1 China
- 11.1.2 India
- 11.1.3 Japan
- 11.1.4 South Korea
- 11.1.5 Malaysia
- 11.1.6 Vietnam
- 11.1.7 Rest of Asia Pacific
- 12. North America Marine Coatings Industry Analysis, Insights and Forecast, 2019-2031
- 12.1. Market Analysis, Insights and Forecast - By Country/Sub-region
- 12.1.1 United States
- 12.1.2 Canada
- 12.1.3 Mexico
- 13. Europe Marine Coatings Industry Analysis, Insights and Forecast, 2019-2031
- 13.1. Market Analysis, Insights and Forecast - By Country/Sub-region
- 13.1.1 Germany
- 13.1.2 United Kingdom
- 13.1.3 Italy
- 13.1.4 France
- 13.1.5 Rest of Europe
- 14. South America Marine Coatings Industry Analysis, Insights and Forecast, 2019-2031
- 14.1. Market Analysis, Insights and Forecast - By Country/Sub-region
- 14.1.1 Brazil
- 14.1.2 Argentina
- 14.1.3 Rest of South America
- 15. Middle East and Africa Marine Coatings Industry Analysis, Insights and Forecast, 2019-2031
- 15.1. Market Analysis, Insights and Forecast - By Country/Sub-region
- 15.1.1 Saudi Arabia
- 15.1.2 South Africa
- 15.1.3 Rest of Middle East and Africa
- 16. Competitive Analysis
- 16.1. Global Market Share Analysis 2024
- 16.2. Company Profiles
- 16.2.1 Engineered Marine Coatings LLC
- 16.2.1.1. Overview
- 16.2.1.2. Products
- 16.2.1.3. SWOT Analysis
- 16.2.1.4. Recent Developments
- 16.2.1.5. Financials (Based on Availability)
- 16.2.2 The Sherwin-Williams Company*List Not Exhaustive
- 16.2.2.1. Overview
- 16.2.2.2. Products
- 16.2.2.3. SWOT Analysis
- 16.2.2.4. Recent Developments
- 16.2.2.5. Financials (Based on Availability)
- 16.2.3 AkzoNobel N V
- 16.2.3.1. Overview
- 16.2.3.2. Products
- 16.2.3.3. SWOT Analysis
- 16.2.3.4. Recent Developments
- 16.2.3.5. Financials (Based on Availability)
- 16.2.4 Chugoku Marine Paints Ltd
- 16.2.4.1. Overview
- 16.2.4.2. Products
- 16.2.4.3. SWOT Analysis
- 16.2.4.4. Recent Developments
- 16.2.4.5. Financials (Based on Availability)
- 16.2.5 KCC CORPORATION
- 16.2.5.1. Overview
- 16.2.5.2. Products
- 16.2.5.3. SWOT Analysis
- 16.2.5.4. Recent Developments
- 16.2.5.5. Financials (Based on Availability)
- 16.2.6 Jotun
- 16.2.6.1. Overview
- 16.2.6.2. Products
- 16.2.6.3. SWOT Analysis
- 16.2.6.4. Recent Developments
- 16.2.6.5. Financials (Based on Availability)
- 16.2.7 RPM International Inc
- 16.2.7.1. Overview
- 16.2.7.2. Products
- 16.2.7.3. SWOT Analysis
- 16.2.7.4. Recent Developments
- 16.2.7.5. Financials (Based on Availability)
- 16.2.8 Kansai Paint Marine Co Ltd
- 16.2.8.1. Overview
- 16.2.8.2. Products
- 16.2.8.3. SWOT Analysis
- 16.2.8.4. Recent Developments
- 16.2.8.5. Financials (Based on Availability)
- 16.2.9 Pettit Marine Paints
- 16.2.9.1. Overview
- 16.2.9.2. Products
- 16.2.9.3. SWOT Analysis
- 16.2.9.4. Recent Developments
- 16.2.9.5. Financials (Based on Availability)
- 16.2.10 PPG Industries Inc
- 16.2.10.1. Overview
- 16.2.10.2. Products
- 16.2.10.3. SWOT Analysis
- 16.2.10.4. Recent Developments
- 16.2.10.5. Financials (Based on Availability)
- 16.2.11 BOERO BARTOLOMEO S p A
- 16.2.11.1. Overview
- 16.2.11.2. Products
- 16.2.11.3. SWOT Analysis
- 16.2.11.4. Recent Developments
- 16.2.11.5. Financials (Based on Availability)
- 16.2.12 Nippon Paint Marine Coatings Co Ltd
- 16.2.12.1. Overview
- 16.2.12.2. Products
- 16.2.12.3. SWOT Analysis
- 16.2.12.4. Recent Developments
- 16.2.12.5. Financials (Based on Availability)
- 16.2.13 BASF SE
- 16.2.13.1. Overview
- 16.2.13.2. Products
- 16.2.13.3. SWOT Analysis
- 16.2.13.4. Recent Developments
- 16.2.13.5. Financials (Based on Availability)
- 16.2.14 Axalta Coating Systems
- 16.2.14.1. Overview
- 16.2.14.2. Products
- 16.2.14.3. SWOT Analysis
- 16.2.14.4. Recent Developments
- 16.2.14.5. Financials (Based on Availability)
- 16.2.15 Hempel A/S
- 16.2.15.1. Overview
- 16.2.15.2. Products
- 16.2.15.3. SWOT Analysis
- 16.2.15.4. Recent Developments
- 16.2.15.5. Financials (Based on Availability)
- 16.2.16 MCU COATING INTERNATIONAL
- 16.2.16.1. Overview
- 16.2.16.2. Products
- 16.2.16.3. SWOT Analysis
- 16.2.16.4. Recent Developments
- 16.2.16.5. Financials (Based on Availability)
- 16.2.1 Engineered Marine Coatings LLC
List of Figures
- Figure 1: Global Marine Coatings Industry Revenue Breakdown (Million, %) by Region 2024 & 2032
- Figure 2: Global Marine Coatings Industry Volume Breakdown (liter , %) by Region 2024 & 2032
- Figure 3: Asia Pacific Marine Coatings Industry Revenue (Million), by Country 2024 & 2032
- Figure 4: Asia Pacific Marine Coatings Industry Volume (liter ), by Country 2024 & 2032
- Figure 5: Asia Pacific Marine Coatings Industry Revenue Share (%), by Country 2024 & 2032
- Figure 6: Asia Pacific Marine Coatings Industry Volume Share (%), by Country 2024 & 2032
- Figure 7: North America Marine Coatings Industry Revenue (Million), by Country 2024 & 2032
- Figure 8: North America Marine Coatings Industry Volume (liter ), by Country 2024 & 2032
- Figure 9: North America Marine Coatings Industry Revenue Share (%), by Country 2024 & 2032
- Figure 10: North America Marine Coatings Industry Volume Share (%), by Country 2024 & 2032
- Figure 11: Europe Marine Coatings Industry Revenue (Million), by Country 2024 & 2032
- Figure 12: Europe Marine Coatings Industry Volume (liter ), by Country 2024 & 2032
- Figure 13: Europe Marine Coatings Industry Revenue Share (%), by Country 2024 & 2032
- Figure 14: Europe Marine Coatings Industry Volume Share (%), by Country 2024 & 2032
- Figure 15: South America Marine Coatings Industry Revenue (Million), by Country 2024 & 2032
- Figure 16: South America Marine Coatings Industry Volume (liter ), by Country 2024 & 2032
- Figure 17: South America Marine Coatings Industry Revenue Share (%), by Country 2024 & 2032
- Figure 18: South America Marine Coatings Industry Volume Share (%), by Country 2024 & 2032
- Figure 19: Middle East and Africa Marine Coatings Industry Revenue (Million), by Country 2024 & 2032
- Figure 20: Middle East and Africa Marine Coatings Industry Volume (liter ), by Country 2024 & 2032
- Figure 21: Middle East and Africa Marine Coatings Industry Revenue Share (%), by Country 2024 & 2032
- Figure 22: Middle East and Africa Marine Coatings Industry Volume Share (%), by Country 2024 & 2032
- Figure 23: Asia Pacific Marine Coatings Industry Revenue (Million), by Type 2024 & 2032
- Figure 24: Asia Pacific Marine Coatings Industry Volume (liter ), by Type 2024 & 2032
- Figure 25: Asia Pacific Marine Coatings Industry Revenue Share (%), by Type 2024 & 2032
- Figure 26: Asia Pacific Marine Coatings Industry Volume Share (%), by Type 2024 & 2032
- Figure 27: Asia Pacific Marine Coatings Industry Revenue (Million), by Resin 2024 & 2032
- Figure 28: Asia Pacific Marine Coatings Industry Volume (liter ), by Resin 2024 & 2032
- Figure 29: Asia Pacific Marine Coatings Industry Revenue Share (%), by Resin 2024 & 2032
- Figure 30: Asia Pacific Marine Coatings Industry Volume Share (%), by Resin 2024 & 2032
- Figure 31: Asia Pacific Marine Coatings Industry Revenue (Million), by Technology 2024 & 2032
- Figure 32: Asia Pacific Marine Coatings Industry Volume (liter ), by Technology 2024 & 2032
- Figure 33: Asia Pacific Marine Coatings Industry Revenue Share (%), by Technology 2024 & 2032
- Figure 34: Asia Pacific Marine Coatings Industry Volume Share (%), by Technology 2024 & 2032
- Figure 35: Asia Pacific Marine Coatings Industry Revenue (Million), by Application 2024 & 2032
- Figure 36: Asia Pacific Marine Coatings Industry Volume (liter ), by Application 2024 & 2032
- Figure 37: Asia Pacific Marine Coatings Industry Revenue Share (%), by Application 2024 & 2032
- Figure 38: Asia Pacific Marine Coatings Industry Volume Share (%), by Application 2024 & 2032
- Figure 39: Asia Pacific Marine Coatings Industry Revenue (Million), by Country 2024 & 2032
- Figure 40: Asia Pacific Marine Coatings Industry Volume (liter ), by Country 2024 & 2032
- Figure 41: Asia Pacific Marine Coatings Industry Revenue Share (%), by Country 2024 & 2032
- Figure 42: Asia Pacific Marine Coatings Industry Volume Share (%), by Country 2024 & 2032
- Figure 43: North America Marine Coatings Industry Revenue (Million), by Type 2024 & 2032
- Figure 44: North America Marine Coatings Industry Volume (liter ), by Type 2024 & 2032
- Figure 45: North America Marine Coatings Industry Revenue Share (%), by Type 2024 & 2032
- Figure 46: North America Marine Coatings Industry Volume Share (%), by Type 2024 & 2032
- Figure 47: North America Marine Coatings Industry Revenue (Million), by Resin 2024 & 2032
- Figure 48: North America Marine Coatings Industry Volume (liter ), by Resin 2024 & 2032
- Figure 49: North America Marine Coatings Industry Revenue Share (%), by Resin 2024 & 2032
- Figure 50: North America Marine Coatings Industry Volume Share (%), by Resin 2024 & 2032
- Figure 51: North America Marine Coatings Industry Revenue (Million), by Technology 2024 & 2032
- Figure 52: North America Marine Coatings Industry Volume (liter ), by Technology 2024 & 2032
- Figure 53: North America Marine Coatings Industry Revenue Share (%), by Technology 2024 & 2032
- Figure 54: North America Marine Coatings Industry Volume Share (%), by Technology 2024 & 2032
- Figure 55: North America Marine Coatings Industry Revenue (Million), by Application 2024 & 2032
- Figure 56: North America Marine Coatings Industry Volume (liter ), by Application 2024 & 2032
- Figure 57: North America Marine Coatings Industry Revenue Share (%), by Application 2024 & 2032
- Figure 58: North America Marine Coatings Industry Volume Share (%), by Application 2024 & 2032
- Figure 59: North America Marine Coatings Industry Revenue (Million), by Country 2024 & 2032
- Figure 60: North America Marine Coatings Industry Volume (liter ), by Country 2024 & 2032
- Figure 61: North America Marine Coatings Industry Revenue Share (%), by Country 2024 & 2032
- Figure 62: North America Marine Coatings Industry Volume Share (%), by Country 2024 & 2032
- Figure 63: Europe Marine Coatings Industry Revenue (Million), by Type 2024 & 2032
- Figure 64: Europe Marine Coatings Industry Volume (liter ), by Type 2024 & 2032
- Figure 65: Europe Marine Coatings Industry Revenue Share (%), by Type 2024 & 2032
- Figure 66: Europe Marine Coatings Industry Volume Share (%), by Type 2024 & 2032
- Figure 67: Europe Marine Coatings Industry Revenue (Million), by Resin 2024 & 2032
- Figure 68: Europe Marine Coatings Industry Volume (liter ), by Resin 2024 & 2032
- Figure 69: Europe Marine Coatings Industry Revenue Share (%), by Resin 2024 & 2032
- Figure 70: Europe Marine Coatings Industry Volume Share (%), by Resin 2024 & 2032
- Figure 71: Europe Marine Coatings Industry Revenue (Million), by Technology 2024 & 2032
- Figure 72: Europe Marine Coatings Industry Volume (liter ), by Technology 2024 & 2032
- Figure 73: Europe Marine Coatings Industry Revenue Share (%), by Technology 2024 & 2032
- Figure 74: Europe Marine Coatings Industry Volume Share (%), by Technology 2024 & 2032
- Figure 75: Europe Marine Coatings Industry Revenue (Million), by Application 2024 & 2032
- Figure 76: Europe Marine Coatings Industry Volume (liter ), by Application 2024 & 2032
- Figure 77: Europe Marine Coatings Industry Revenue Share (%), by Application 2024 & 2032
- Figure 78: Europe Marine Coatings Industry Volume Share (%), by Application 2024 & 2032
- Figure 79: Europe Marine Coatings Industry Revenue (Million), by Country 2024 & 2032
- Figure 80: Europe Marine Coatings Industry Volume (liter ), by Country 2024 & 2032
- Figure 81: Europe Marine Coatings Industry Revenue Share (%), by Country 2024 & 2032
- Figure 82: Europe Marine Coatings Industry Volume Share (%), by Country 2024 & 2032
- Figure 83: South America Marine Coatings Industry Revenue (Million), by Type 2024 & 2032
- Figure 84: South America Marine Coatings Industry Volume (liter ), by Type 2024 & 2032
- Figure 85: South America Marine Coatings Industry Revenue Share (%), by Type 2024 & 2032
- Figure 86: South America Marine Coatings Industry Volume Share (%), by Type 2024 & 2032
- Figure 87: South America Marine Coatings Industry Revenue (Million), by Resin 2024 & 2032
- Figure 88: South America Marine Coatings Industry Volume (liter ), by Resin 2024 & 2032
- Figure 89: South America Marine Coatings Industry Revenue Share (%), by Resin 2024 & 2032
- Figure 90: South America Marine Coatings Industry Volume Share (%), by Resin 2024 & 2032
- Figure 91: South America Marine Coatings Industry Revenue (Million), by Technology 2024 & 2032
- Figure 92: South America Marine Coatings Industry Volume (liter ), by Technology 2024 & 2032
- Figure 93: South America Marine Coatings Industry Revenue Share (%), by Technology 2024 & 2032
- Figure 94: South America Marine Coatings Industry Volume Share (%), by Technology 2024 & 2032
- Figure 95: South America Marine Coatings Industry Revenue (Million), by Application 2024 & 2032
- Figure 96: South America Marine Coatings Industry Volume (liter ), by Application 2024 & 2032
- Figure 97: South America Marine Coatings Industry Revenue Share (%), by Application 2024 & 2032
- Figure 98: South America Marine Coatings Industry Volume Share (%), by Application 2024 & 2032
- Figure 99: South America Marine Coatings Industry Revenue (Million), by Country 2024 & 2032
- Figure 100: South America Marine Coatings Industry Volume (liter ), by Country 2024 & 2032
- Figure 101: South America Marine Coatings Industry Revenue Share (%), by Country 2024 & 2032
- Figure 102: South America Marine Coatings Industry Volume Share (%), by Country 2024 & 2032
- Figure 103: Middle East and Africa Marine Coatings Industry Revenue (Million), by Type 2024 & 2032
- Figure 104: Middle East and Africa Marine Coatings Industry Volume (liter ), by Type 2024 & 2032
- Figure 105: Middle East and Africa Marine Coatings Industry Revenue Share (%), by Type 2024 & 2032
- Figure 106: Middle East and Africa Marine Coatings Industry Volume Share (%), by Type 2024 & 2032
- Figure 107: Middle East and Africa Marine Coatings Industry Revenue (Million), by Resin 2024 & 2032
- Figure 108: Middle East and Africa Marine Coatings Industry Volume (liter ), by Resin 2024 & 2032
- Figure 109: Middle East and Africa Marine Coatings Industry Revenue Share (%), by Resin 2024 & 2032
- Figure 110: Middle East and Africa Marine Coatings Industry Volume Share (%), by Resin 2024 & 2032
- Figure 111: Middle East and Africa Marine Coatings Industry Revenue (Million), by Technology 2024 & 2032
- Figure 112: Middle East and Africa Marine Coatings Industry Volume (liter ), by Technology 2024 & 2032
- Figure 113: Middle East and Africa Marine Coatings Industry Revenue Share (%), by Technology 2024 & 2032
- Figure 114: Middle East and Africa Marine Coatings Industry Volume Share (%), by Technology 2024 & 2032
- Figure 115: Middle East and Africa Marine Coatings Industry Revenue (Million), by Application 2024 & 2032
- Figure 116: Middle East and Africa Marine Coatings Industry Volume (liter ), by Application 2024 & 2032
- Figure 117: Middle East and Africa Marine Coatings Industry Revenue Share (%), by Application 2024 & 2032
- Figure 118: Middle East and Africa Marine Coatings Industry Volume Share (%), by Application 2024 & 2032
- Figure 119: Middle East and Africa Marine Coatings Industry Revenue (Million), by Country 2024 & 2032
- Figure 120: Middle East and Africa Marine Coatings Industry Volume (liter ), by Country 2024 & 2032
- Figure 121: Middle East and Africa Marine Coatings Industry Revenue Share (%), by Country 2024 & 2032
- Figure 122: Middle East and Africa Marine Coatings Industry Volume Share (%), by Country 2024 & 2032
List of Tables
- Table 1: Global Marine Coatings Industry Revenue Million Forecast, by Region 2019 & 2032
- Table 2: Global Marine Coatings Industry Volume liter Forecast, by Region 2019 & 2032
- Table 3: Global Marine Coatings Industry Revenue Million Forecast, by Type 2019 & 2032
- Table 4: Global Marine Coatings Industry Volume liter Forecast, by Type 2019 & 2032
- Table 5: Global Marine Coatings Industry Revenue Million Forecast, by Resin 2019 & 2032
- Table 6: Global Marine Coatings Industry Volume liter Forecast, by Resin 2019 & 2032
- Table 7: Global Marine Coatings Industry Revenue Million Forecast, by Technology 2019 & 2032
- Table 8: Global Marine Coatings Industry Volume liter Forecast, by Technology 2019 & 2032
- Table 9: Global Marine Coatings Industry Revenue Million Forecast, by Application 2019 & 2032
- Table 10: Global Marine Coatings Industry Volume liter Forecast, by Application 2019 & 2032
- Table 11: Global Marine Coatings Industry Revenue Million Forecast, by Region 2019 & 2032
- Table 12: Global Marine Coatings Industry Volume liter Forecast, by Region 2019 & 2032
- Table 13: Global Marine Coatings Industry Revenue Million Forecast, by Country 2019 & 2032
- Table 14: Global Marine Coatings Industry Volume liter Forecast, by Country 2019 & 2032
- Table 15: China Marine Coatings Industry Revenue (Million) Forecast, by Application 2019 & 2032
- Table 16: China Marine Coatings Industry Volume (liter ) Forecast, by Application 2019 & 2032
- Table 17: India Marine Coatings Industry Revenue (Million) Forecast, by Application 2019 & 2032
- Table 18: India Marine Coatings Industry Volume (liter ) Forecast, by Application 2019 & 2032
- Table 19: Japan Marine Coatings Industry Revenue (Million) Forecast, by Application 2019 & 2032
- Table 20: Japan Marine Coatings Industry Volume (liter ) Forecast, by Application 2019 & 2032
- Table 21: South Korea Marine Coatings Industry Revenue (Million) Forecast, by Application 2019 & 2032
- Table 22: South Korea Marine Coatings Industry Volume (liter ) Forecast, by Application 2019 & 2032
- Table 23: Malaysia Marine Coatings Industry Revenue (Million) Forecast, by Application 2019 & 2032
- Table 24: Malaysia Marine Coatings Industry Volume (liter ) Forecast, by Application 2019 & 2032
- Table 25: Vietnam Marine Coatings Industry Revenue (Million) Forecast, by Application 2019 & 2032
- Table 26: Vietnam Marine Coatings Industry Volume (liter ) Forecast, by Application 2019 & 2032
- Table 27: Rest of Asia Pacific Marine Coatings Industry Revenue (Million) Forecast, by Application 2019 & 2032
- Table 28: Rest of Asia Pacific Marine Coatings Industry Volume (liter ) Forecast, by Application 2019 & 2032
- Table 29: Global Marine Coatings Industry Revenue Million Forecast, by Country 2019 & 2032
- Table 30: Global Marine Coatings Industry Volume liter Forecast, by Country 2019 & 2032
- Table 31: United States Marine Coatings Industry Revenue (Million) Forecast, by Application 2019 & 2032
- Table 32: United States Marine Coatings Industry Volume (liter ) Forecast, by Application 2019 & 2032
- Table 33: Canada Marine Coatings Industry Revenue (Million) Forecast, by Application 2019 & 2032
- Table 34: Canada Marine Coatings Industry Volume (liter ) Forecast, by Application 2019 & 2032
- Table 35: Mexico Marine Coatings Industry Revenue (Million) Forecast, by Application 2019 & 2032
- Table 36: Mexico Marine Coatings Industry Volume (liter ) Forecast, by Application 2019 & 2032
- Table 37: Global Marine Coatings Industry Revenue Million Forecast, by Country 2019 & 2032
- Table 38: Global Marine Coatings Industry Volume liter Forecast, by Country 2019 & 2032
- Table 39: Germany Marine Coatings Industry Revenue (Million) Forecast, by Application 2019 & 2032
- Table 40: Germany Marine Coatings Industry Volume (liter ) Forecast, by Application 2019 & 2032
- Table 41: United Kingdom Marine Coatings Industry Revenue (Million) Forecast, by Application 2019 & 2032
- Table 42: United Kingdom Marine Coatings Industry Volume (liter ) Forecast, by Application 2019 & 2032
- Table 43: Italy Marine Coatings Industry Revenue (Million) Forecast, by Application 2019 & 2032
- Table 44: Italy Marine Coatings Industry Volume (liter ) Forecast, by Application 2019 & 2032
- Table 45: France Marine Coatings Industry Revenue (Million) Forecast, by Application 2019 & 2032
- Table 46: France Marine Coatings Industry Volume (liter ) Forecast, by Application 2019 & 2032
- Table 47: Rest of Europe Marine Coatings Industry Revenue (Million) Forecast, by Application 2019 & 2032
- Table 48: Rest of Europe Marine Coatings Industry Volume (liter ) Forecast, by Application 2019 & 2032
- Table 49: Global Marine Coatings Industry Revenue Million Forecast, by Country 2019 & 2032
- Table 50: Global Marine Coatings Industry Volume liter Forecast, by Country 2019 & 2032
- Table 51: Brazil Marine Coatings Industry Revenue (Million) Forecast, by Application 2019 & 2032
- Table 52: Brazil Marine Coatings Industry Volume (liter ) Forecast, by Application 2019 & 2032
- Table 53: Argentina Marine Coatings Industry Revenue (Million) Forecast, by Application 2019 & 2032
- Table 54: Argentina Marine Coatings Industry Volume (liter ) Forecast, by Application 2019 & 2032
- Table 55: Rest of South America Marine Coatings Industry Revenue (Million) Forecast, by Application 2019 & 2032
- Table 56: Rest of South America Marine Coatings Industry Volume (liter ) Forecast, by Application 2019 & 2032
- Table 57: Global Marine Coatings Industry Revenue Million Forecast, by Country 2019 & 2032
- Table 58: Global Marine Coatings Industry Volume liter Forecast, by Country 2019 & 2032
- Table 59: Saudi Arabia Marine Coatings Industry Revenue (Million) Forecast, by Application 2019 & 2032
- Table 60: Saudi Arabia Marine Coatings Industry Volume (liter ) Forecast, by Application 2019 & 2032
- Table 61: South Africa Marine Coatings Industry Revenue (Million) Forecast, by Application 2019 & 2032
- Table 62: South Africa Marine Coatings Industry Volume (liter ) Forecast, by Application 2019 & 2032
- Table 63: Rest of Middle East and Africa Marine Coatings Industry Revenue (Million) Forecast, by Application 2019 & 2032
- Table 64: Rest of Middle East and Africa Marine Coatings Industry Volume (liter ) Forecast, by Application 2019 & 2032
- Table 65: Global Marine Coatings Industry Revenue Million Forecast, by Type 2019 & 2032
- Table 66: Global Marine Coatings Industry Volume liter Forecast, by Type 2019 & 2032
- Table 67: Global Marine Coatings Industry Revenue Million Forecast, by Resin 2019 & 2032
- Table 68: Global Marine Coatings Industry Volume liter Forecast, by Resin 2019 & 2032
- Table 69: Global Marine Coatings Industry Revenue Million Forecast, by Technology 2019 & 2032
- Table 70: Global Marine Coatings Industry Volume liter Forecast, by Technology 2019 & 2032
- Table 71: Global Marine Coatings Industry Revenue Million Forecast, by Application 2019 & 2032
- Table 72: Global Marine Coatings Industry Volume liter Forecast, by Application 2019 & 2032
- Table 73: Global Marine Coatings Industry Revenue Million Forecast, by Country 2019 & 2032
- Table 74: Global Marine Coatings Industry Volume liter Forecast, by Country 2019 & 2032
- Table 75: China Marine Coatings Industry Revenue (Million) Forecast, by Application 2019 & 2032
- Table 76: China Marine Coatings Industry Volume (liter ) Forecast, by Application 2019 & 2032
- Table 77: India Marine Coatings Industry Revenue (Million) Forecast, by Application 2019 & 2032
- Table 78: India Marine Coatings Industry Volume (liter ) Forecast, by Application 2019 & 2032
- Table 79: Japan Marine Coatings Industry Revenue (Million) Forecast, by Application 2019 & 2032
- Table 80: Japan Marine Coatings Industry Volume (liter ) Forecast, by Application 2019 & 2032
- Table 81: South Korea Marine Coatings Industry Revenue (Million) Forecast, by Application 2019 & 2032
- Table 82: South Korea Marine Coatings Industry Volume (liter ) Forecast, by Application 2019 & 2032
- Table 83: Malaysia Marine Coatings Industry Revenue (Million) Forecast, by Application 2019 & 2032
- Table 84: Malaysia Marine Coatings Industry Volume (liter ) Forecast, by Application 2019 & 2032
- Table 85: Vietnam Marine Coatings Industry Revenue (Million) Forecast, by Application 2019 & 2032
- Table 86: Vietnam Marine Coatings Industry Volume (liter ) Forecast, by Application 2019 & 2032
- Table 87: Rest of Asia Pacific Marine Coatings Industry Revenue (Million) Forecast, by Application 2019 & 2032
- Table 88: Rest of Asia Pacific Marine Coatings Industry Volume (liter ) Forecast, by Application 2019 & 2032
- Table 89: Global Marine Coatings Industry Revenue Million Forecast, by Type 2019 & 2032
- Table 90: Global Marine Coatings Industry Volume liter Forecast, by Type 2019 & 2032
- Table 91: Global Marine Coatings Industry Revenue Million Forecast, by Resin 2019 & 2032
- Table 92: Global Marine Coatings Industry Volume liter Forecast, by Resin 2019 & 2032
- Table 93: Global Marine Coatings Industry Revenue Million Forecast, by Technology 2019 & 2032
- Table 94: Global Marine Coatings Industry Volume liter Forecast, by Technology 2019 & 2032
- Table 95: Global Marine Coatings Industry Revenue Million Forecast, by Application 2019 & 2032
- Table 96: Global Marine Coatings Industry Volume liter Forecast, by Application 2019 & 2032
- Table 97: Global Marine Coatings Industry Revenue Million Forecast, by Country 2019 & 2032
- Table 98: Global Marine Coatings Industry Volume liter Forecast, by Country 2019 & 2032
- Table 99: United States Marine Coatings Industry Revenue (Million) Forecast, by Application 2019 & 2032
- Table 100: United States Marine Coatings Industry Volume (liter ) Forecast, by Application 2019 & 2032
- Table 101: Canada Marine Coatings Industry Revenue (Million) Forecast, by Application 2019 & 2032
- Table 102: Canada Marine Coatings Industry Volume (liter ) Forecast, by Application 2019 & 2032
- Table 103: Mexico Marine Coatings Industry Revenue (Million) Forecast, by Application 2019 & 2032
- Table 104: Mexico Marine Coatings Industry Volume (liter ) Forecast, by Application 2019 & 2032
- Table 105: Global Marine Coatings Industry Revenue Million Forecast, by Type 2019 & 2032
- Table 106: Global Marine Coatings Industry Volume liter Forecast, by Type 2019 & 2032
- Table 107: Global Marine Coatings Industry Revenue Million Forecast, by Resin 2019 & 2032
- Table 108: Global Marine Coatings Industry Volume liter Forecast, by Resin 2019 & 2032
- Table 109: Global Marine Coatings Industry Revenue Million Forecast, by Technology 2019 & 2032
- Table 110: Global Marine Coatings Industry Volume liter Forecast, by Technology 2019 & 2032
- Table 111: Global Marine Coatings Industry Revenue Million Forecast, by Application 2019 & 2032
- Table 112: Global Marine Coatings Industry Volume liter Forecast, by Application 2019 & 2032
- Table 113: Global Marine Coatings Industry Revenue Million Forecast, by Country 2019 & 2032
- Table 114: Global Marine Coatings Industry Volume liter Forecast, by Country 2019 & 2032
- Table 115: Germany Marine Coatings Industry Revenue (Million) Forecast, by Application 2019 & 2032
- Table 116: Germany Marine Coatings Industry Volume (liter ) Forecast, by Application 2019 & 2032
- Table 117: United Kingdom Marine Coatings Industry Revenue (Million) Forecast, by Application 2019 & 2032
- Table 118: United Kingdom Marine Coatings Industry Volume (liter ) Forecast, by Application 2019 & 2032
- Table 119: Italy Marine Coatings Industry Revenue (Million) Forecast, by Application 2019 & 2032
- Table 120: Italy Marine Coatings Industry Volume (liter ) Forecast, by Application 2019 & 2032
- Table 121: France Marine Coatings Industry Revenue (Million) Forecast, by Application 2019 & 2032
- Table 122: France Marine Coatings Industry Volume (liter ) Forecast, by Application 2019 & 2032
- Table 123: Rest of Europe Marine Coatings Industry Revenue (Million) Forecast, by Application 2019 & 2032
- Table 124: Rest of Europe Marine Coatings Industry Volume (liter ) Forecast, by Application 2019 & 2032
- Table 125: Global Marine Coatings Industry Revenue Million Forecast, by Type 2019 & 2032
- Table 126: Global Marine Coatings Industry Volume liter Forecast, by Type 2019 & 2032
- Table 127: Global Marine Coatings Industry Revenue Million Forecast, by Resin 2019 & 2032
- Table 128: Global Marine Coatings Industry Volume liter Forecast, by Resin 2019 & 2032
- Table 129: Global Marine Coatings Industry Revenue Million Forecast, by Technology 2019 & 2032
- Table 130: Global Marine Coatings Industry Volume liter Forecast, by Technology 2019 & 2032
- Table 131: Global Marine Coatings Industry Revenue Million Forecast, by Application 2019 & 2032
- Table 132: Global Marine Coatings Industry Volume liter Forecast, by Application 2019 & 2032
- Table 133: Global Marine Coatings Industry Revenue Million Forecast, by Country 2019 & 2032
- Table 134: Global Marine Coatings Industry Volume liter Forecast, by Country 2019 & 2032
- Table 135: Brazil Marine Coatings Industry Revenue (Million) Forecast, by Application 2019 & 2032
- Table 136: Brazil Marine Coatings Industry Volume (liter ) Forecast, by Application 2019 & 2032
- Table 137: Argentina Marine Coatings Industry Revenue (Million) Forecast, by Application 2019 & 2032
- Table 138: Argentina Marine Coatings Industry Volume (liter ) Forecast, by Application 2019 & 2032
- Table 139: Rest of South America Marine Coatings Industry Revenue (Million) Forecast, by Application 2019 & 2032
- Table 140: Rest of South America Marine Coatings Industry Volume (liter ) Forecast, by Application 2019 & 2032
- Table 141: Global Marine Coatings Industry Revenue Million Forecast, by Type 2019 & 2032
- Table 142: Global Marine Coatings Industry Volume liter Forecast, by Type 2019 & 2032
- Table 143: Global Marine Coatings Industry Revenue Million Forecast, by Resin 2019 & 2032
- Table 144: Global Marine Coatings Industry Volume liter Forecast, by Resin 2019 & 2032
- Table 145: Global Marine Coatings Industry Revenue Million Forecast, by Technology 2019 & 2032
- Table 146: Global Marine Coatings Industry Volume liter Forecast, by Technology 2019 & 2032
- Table 147: Global Marine Coatings Industry Revenue Million Forecast, by Application 2019 & 2032
- Table 148: Global Marine Coatings Industry Volume liter Forecast, by Application 2019 & 2032
- Table 149: Global Marine Coatings Industry Revenue Million Forecast, by Country 2019 & 2032
- Table 150: Global Marine Coatings Industry Volume liter Forecast, by Country 2019 & 2032
- Table 151: Saudi Arabia Marine Coatings Industry Revenue (Million) Forecast, by Application 2019 & 2032
- Table 152: Saudi Arabia Marine Coatings Industry Volume (liter ) Forecast, by Application 2019 & 2032
- Table 153: South Africa Marine Coatings Industry Revenue (Million) Forecast, by Application 2019 & 2032
- Table 154: South Africa Marine Coatings Industry Volume (liter ) Forecast, by Application 2019 & 2032
- Table 155: Rest of Middle East and Africa Marine Coatings Industry Revenue (Million) Forecast, by Application 2019 & 2032
- Table 156: Rest of Middle East and Africa Marine Coatings Industry Volume (liter ) Forecast, by Application 2019 & 2032
Frequently Asked Questions
1. What is the projected Compound Annual Growth Rate (CAGR) of the Marine Coatings Industry?
The projected CAGR is approximately > 4.50%.
2. Which companies are prominent players in the Marine Coatings Industry?
Key companies in the market include Engineered Marine Coatings LLC, The Sherwin-Williams Company*List Not Exhaustive, AkzoNobel N V, Chugoku Marine Paints Ltd, KCC CORPORATION, Jotun, RPM International Inc, Kansai Paint Marine Co Ltd, Pettit Marine Paints, PPG Industries Inc, BOERO BARTOLOMEO S p A, Nippon Paint Marine Coatings Co Ltd, BASF SE, Axalta Coating Systems, Hempel A/S, MCU COATING INTERNATIONAL.
3. What are the main segments of the Marine Coatings Industry?
The market segments include Type, Resin, Technology, Application.
4. Can you provide details about the market size?
The market size is estimated to be USD 3.77 Million as of 2022.
5. What are some drivers contributing to market growth?
Increase in Production of Leisure Boats and Cruise Ships; Growing Ship Repairs and Maintenance Activities.
6. What are the notable trends driving market growth?
Marine OEM Application Segment to Dominate The Market.
7. Are there any restraints impacting market growth?
Stringent Government Regulations; Sluggish Growth in Shipbuilding Activities in Few Countries.
8. Can you provide examples of recent developments in the market?
March 2023: PPG launched the PPG SIGMAGLIDE 2390 marine coating to help shipowners lower power consumption and carbon emissions and meet demands for higher performance without adversely impacting the marine environment.
9. What pricing options are available for accessing the report?
Pricing options include single-user, multi-user, and enterprise licenses priced at USD 4750, USD 5250, and USD 8750 respectively.
10. Is the market size provided in terms of value or volume?
The market size is provided in terms of value, measured in Million and volume, measured in liter .
11. Are there any specific market keywords associated with the report?
Yes, the market keyword associated with the report is "Marine Coatings Industry," which aids in identifying and referencing the specific market segment covered.
12. How do I determine which pricing option suits my needs best?
The pricing options vary based on user requirements and access needs. Individual users may opt for single-user licenses, while businesses requiring broader access may choose multi-user or enterprise licenses for cost-effective access to the report.
13. Are there any additional resources or data provided in the Marine Coatings Industry report?
While the report offers comprehensive insights, it's advisable to review the specific contents or supplementary materials provided to ascertain if additional resources or data are available.
14. How can I stay updated on further developments or reports in the Marine Coatings Industry?
To stay informed about further developments, trends, and reports in the Marine Coatings Industry, consider subscribing to industry newsletters, following relevant companies and organizations, or regularly checking reputable industry news sources and publications.
Methodology
Step 1 - Identification of Relevant Samples Size from Population Database


Step 2 - Approaches for Defining Global Market Size (Value, Volume* & Price*)

Note*: In applicable scenarios
Step 3 - Data Sources
Primary Research
- Web Analytics
- Survey Reports
- Research Institute
- Latest Research Reports
- Opinion Leaders
Secondary Research
- Annual Reports
- White Paper
- Latest Press Release
- Industry Association
- Paid Database
- Investor Presentations

Step 4 - Data Triangulation
Involves using different sources of information in order to increase the validity of a study
These sources are likely to be stakeholders in a program - participants, other researchers, program staff, other community members, and so on.
Then we put all data in single framework & apply various statistical tools to find out the dynamic on the market.
During the analysis stage, feedback from the stakeholder groups would be compared to determine areas of agreement as well as areas of divergence


