

Key Insights
The Managed Power over Ethernet (PoE) switch market is experiencing significant expansion, driven by the increasing integration of IP-based surveillance, wireless access points, and IoT devices across diverse industries. This growth is propelled by the escalating demand for high-bandwidth, dependable network connectivity, particularly within enterprise environments and smart city development. Businesses are prioritizing enhanced network security and operational efficiency, favoring managed PoE switches that offer advanced capabilities like real-time network monitoring, granular access control, and Quality of Service (QoS) management. The market is segmented by switch type (e.g., Layer 2, Layer 3), port density, power budget, and application (e.g., security, industrial automation). Leading entities such as Cisco, HPE, and Juniper Networks are actively investing in R&D to refine their product portfolios, focusing on higher port densities, superior power efficiency, and advanced security features. The competitive arena features a blend of established vendors and emerging innovators, fostering continuous technological advancements and competitive pricing. Geographical expansion, notably in developing economies undertaking substantial infrastructure projects, serves as a key growth catalyst. However, potential restraints include the considerable initial investment for managed PoE switches and the requirement for specialized technical expertise for deployment and maintenance. Projections indicate a sustained upward growth trajectory, underpinned by ongoing technological evolution and expanding application diversity.
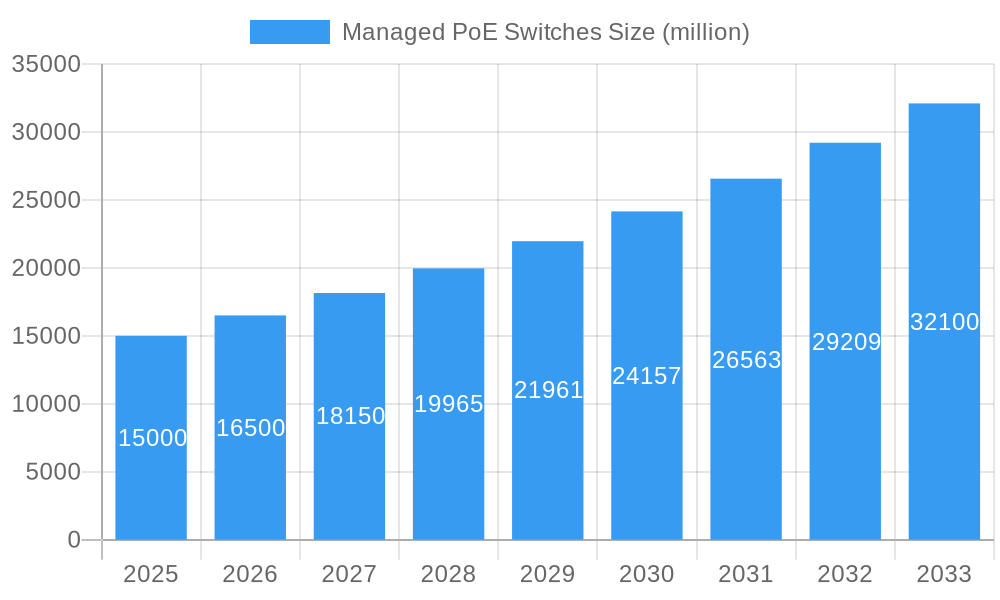
Managed PoE Switches Market Size (In Billion)
The forecast period of 2025-2033 anticipates sustained market growth for managed PoE switches, influenced by several converging trends. The widespread adoption of 5G technology will necessitate more robust and scalable network infrastructures, thereby increasing demand for these switches. Moreover, the proliferation of smart cities and the Internet of Things (IoT) will require enhanced network power delivery capabilities, directly benefiting market expansion. Intense competition is expected, with companies differentiating their offerings through advanced security protocols, intelligent power management, and cloud-based management solutions. The market may witness increased consolidation as larger corporations acquire smaller entities, potentially leading to greater market share concentration. Nevertheless, the introduction of novel technologies and the deeper penetration of managed PoE solutions into new vertical markets will present opportunities for specialized, niche players. The overall outlook for managed PoE switches is highly positive, with considerable growth potential anticipated over the next decade. The market size is projected to reach $7.04 billion by 2033, expanding at a Compound Annual Growth Rate (CAGR) of 14.39% from the base year 2025.
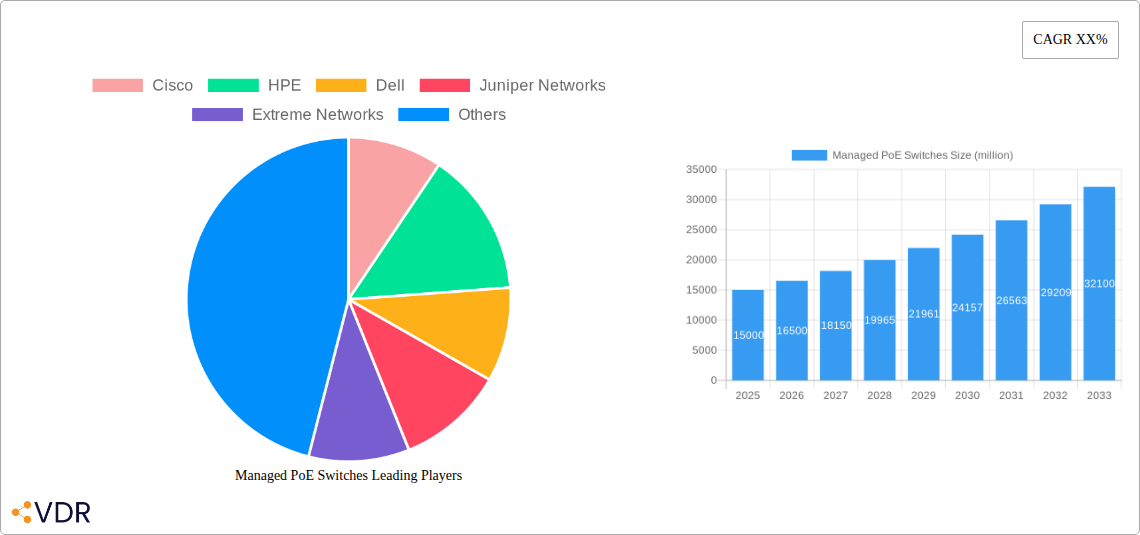
Managed PoE Switches Company Market Share
Managed PoE Switches Market Report: 2019-2033
This comprehensive report provides an in-depth analysis of the Managed PoE Switches market, encompassing market dynamics, growth trends, regional dominance, product landscape, key players, and future outlook. The study period covers 2019-2033, with 2025 as the base and estimated year. The forecast period spans 2025-2033, and the historical period encompasses 2019-2024. The report is invaluable for industry professionals, investors, and strategic decision-makers seeking to understand and capitalize on opportunities within this rapidly evolving market segment of the broader Networking Equipment market.
Managed PoE Switches Market Dynamics & Structure
This section analyzes the competitive landscape of the Managed PoE Switches market, examining market concentration, technological innovation drivers, regulatory frameworks, and competitive dynamics. The report delves into end-user demographics, M&A trends, and assesses the impact of these factors on market growth. Quantitative insights, including market share percentages and M&A deal volumes (in millions of USD), are presented alongside qualitative analysis of innovation barriers and competitive strategies.
- Market Concentration: The market is moderately concentrated, with the top 5 players holding approximately xx% of the market share in 2025. This is expected to slightly decrease to xx% by 2033 due to increased competition from smaller players.
- Technological Innovation: Key drivers include advancements in PoE standards (e.g., PoE++, 802.3bt), increased demand for higher power delivery, and the integration of intelligent management features.
- Regulatory Frameworks: Government regulations regarding network security and energy efficiency are influencing market growth and adoption.
- Competitive Dynamics: Intense competition exists amongst established players like Cisco, HPE, and Juniper, leading to aggressive pricing strategies and product differentiation. The number of M&A deals in the sector is estimated at xx in 2024, and predicted to be xx in 2025.
- End-User Demographics: Significant growth is driven by increasing adoption in enterprise networks, particularly in sectors like data centers, manufacturing, and transportation.
Managed PoE Switches Growth Trends & Insights
This section provides a detailed analysis of the Managed PoE Switches market size evolution, adoption rates, technological disruptions, and consumer behavior shifts from 2019 to 2033. The analysis utilizes various quantitative metrics, including Compound Annual Growth Rate (CAGR) and market penetration rates, to offer precise insights into market trajectory. The global market size for Managed PoE Switches was estimated at xx million units in 2024 and is projected to reach xx million units by 2033, exhibiting a CAGR of xx% during the forecast period. This growth is primarily attributed to the rising demand for network infrastructure upgrades, adoption of IoT devices, and the increasing need for efficient power delivery solutions. The report will also analyze shifts in consumer preferences toward cloud-managed solutions and the impact of technological disruptions such as the adoption of AI and machine learning in network management.
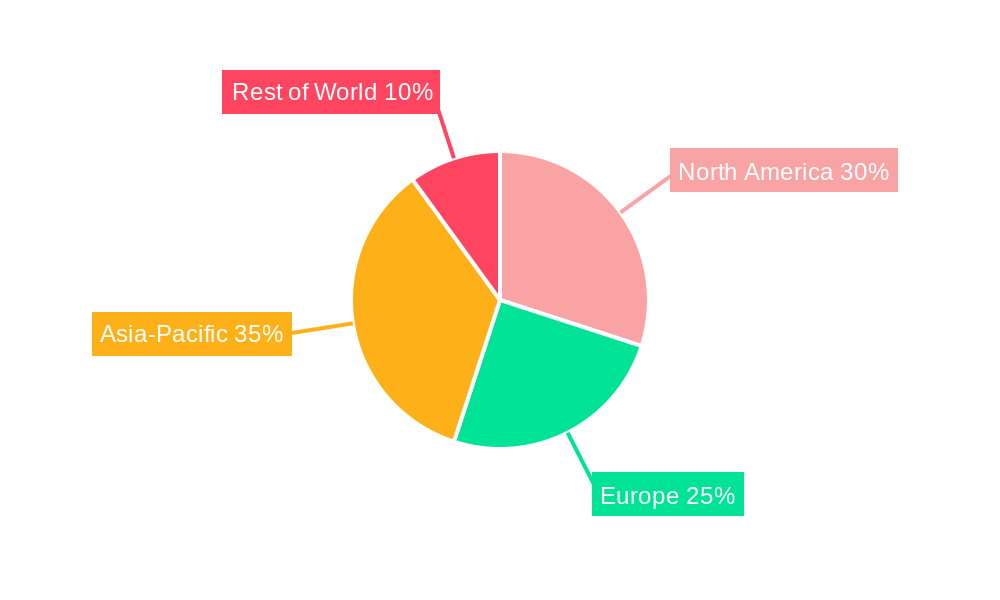
Dominant Regions, Countries, or Segments in Managed PoE Switches
This section identifies the leading regions, countries, or segments driving market growth. Key drivers, including economic policies and infrastructure development, are highlighted using bullet points. The analysis focuses on dominance factors, market share, and growth potential.
- North America: Strong market growth is driven by significant investments in IT infrastructure and technological advancements, leading to a market share of approximately xx% in 2025.
- Europe: Government initiatives promoting digitalization and increasing adoption of smart city projects contribute to substantial market expansion. Market share is projected at xx% in 2025.
- Asia-Pacific: This region is experiencing the fastest growth rate, fueled by rapid urbanization, industrialization, and a surge in IoT deployments. Market share is estimated at xx% in 2025.
Managed PoE Switches Product Landscape
The Managed PoE Switches market offers a diverse range of products, featuring varying power delivery capabilities, port counts, management features, and form factors. Recent innovations include higher-power PoE++ (802.3bt) switches supporting devices with greater power demands, cloud-managed switches for simplified remote administration, and enhanced security features to mitigate cyber threats. These advancements cater to the evolving needs of diverse applications, enhancing network scalability and efficiency.
Key Drivers, Barriers & Challenges in Managed PoE Switches
Key Drivers:
- The increasing adoption of PoE-enabled devices (IP cameras, access points, VoIP phones) is a primary driver of market growth.
- The rising demand for high-bandwidth and low-latency networks in various industries.
- Technological advancements in PoE standards and management capabilities.
Challenges and Restraints:
- The high initial investment cost associated with implementing Managed PoE Switches can hinder adoption among small and medium-sized enterprises.
- Supply chain disruptions and component shortages can impact production and market availability.
- Intense competition amongst vendors leading to price pressure and reduced profit margins.
Emerging Opportunities in Managed PoE Switches
The market presents opportunities in several areas, including:
- Expanding into untapped markets such as smart homes and smaller businesses.
- Development of specialized PoE solutions for niche applications like industrial automation.
- Integration of advanced features, such as AI-powered network management and advanced security protocols.
Growth Accelerators in the Managed PoE Switches Industry
Long-term growth will be accelerated by strategic partnerships between switch vendors and PoE device manufacturers, fostering seamless interoperability and driving market expansion. Further breakthroughs in PoE technology will lead to higher power delivery capabilities and broader applications, while investments in R&D to create more efficient and secure switches will also propel growth.
Key Players Shaping the Managed PoE Switches Market
- Cisco
- HPE
- Dell
- Juniper Networks
- Extreme Networks
- Alcatel-Lucent Enterprise
- Netgear
- Broadcom Inc
- D-Link
- Adtran
- Panasonic
- Advantech
- Zyxel
- Alaxala
- Microchip Technology
- Westermo
- Rubytech
- Moxa
- Repoteck
- DrayTek
- Huawei
- TP-Link
- Hikvision
- Phoenix Contact (EtherWAN)
- Shenzhen Folksafe Technology
Notable Milestones in Managed PoE Switches Sector
- 2020, Q4: Cisco launches its next-generation Catalyst 9000 series switches with enhanced PoE capabilities.
- 2022, Q2: HPE acquires a smaller PoE switch manufacturer, expanding its market share and product portfolio.
- 2023, Q3: Juniper Networks releases a new cloud-managed PoE switch platform.
In-Depth Managed PoE Switches Market Outlook
The Managed PoE Switches market is poised for sustained growth over the next decade, driven by the increasing demand for intelligent and efficient network infrastructure. Technological advancements in PoE standards, coupled with the expansion of IoT deployments across various sectors, will create lucrative opportunities for existing and new market entrants. Strategic partnerships and product diversification will be critical for success in this competitive market.
Managed PoE Switches Segmentation
-
1. Application
- 1.1. Commercial
- 1.2. Government
- 1.3. School
- 1.4. Industrial
- 1.5. Others
-
2. Types
- 2.1. Below 12 Ports
- 2.2. 12-24 Ports
- 2.3. 24-32 Ports
- 2.4. 32-48 Ports
- 2.5. Above 48 Ports
Managed PoE Switches Segmentation By Geography
-
1. North America
- 1.1. United States
- 1.2. Canada
- 1.3. Mexico
-
2. South America
- 2.1. Brazil
- 2.2. Argentina
- 2.3. Rest of South America
-
3. Europe
- 3.1. United Kingdom
- 3.2. Germany
- 3.3. France
- 3.4. Italy
- 3.5. Spain
- 3.6. Russia
- 3.7. Benelux
- 3.8. Nordics
- 3.9. Rest of Europe
-
4. Middle East & Africa
- 4.1. Turkey
- 4.2. Israel
- 4.3. GCC
- 4.4. North Africa
- 4.5. South Africa
- 4.6. Rest of Middle East & Africa
-
5. Asia Pacific
- 5.1. China
- 5.2. India
- 5.3. Japan
- 5.4. South Korea
- 5.5. ASEAN
- 5.6. Oceania
- 5.7. Rest of Asia Pacific
Managed PoE Switches Regional Market Share
Geographic Coverage of Managed PoE Switches
Managed PoE Switches REPORT HIGHLIGHTS
| Aspects | Details |
|---|---|
| Study Period | 2020-2034 |
| Base Year | 2025 |
| Estimated Year | 2026 |
| Forecast Period | 2026-2034 |
| Historical Period | 2020-2025 |
| Growth Rate | CAGR of 14.39% from 2020-2034 |
| Segmentation |
|
Table of Contents
- 1. Introduction
- 1.1. Research Scope
- 1.2. Market Segmentation
- 1.3. Research Objective
- 1.4. Definitions and Assumptions
- 2. Executive Summary
- 2.1. Market Snapshot
- 3. Market Dynamics
- 3.1. Market Drivers
- 3.2. Market Restrains
- 3.3. Market Trends
- 3.4. Market Opportunities
- 4. Market Factor Analysis
- 4.1. Porters Five Forces
- 4.1.1. Bargaining Power of Suppliers
- 4.1.2. Bargaining Power of Buyers
- 4.1.3. Threat of New Entrants
- 4.1.4. Threat of Substitutes
- 4.1.5. Competitive Rivalry
- 4.2. PESTEL analysis
- 4.3. BCG Analysis
- 4.3.1. Stars (High Growth, High Market Share)
- 4.3.2. Cash Cows (Low Growth, High Market Share)
- 4.3.3. Question Mark (High Growth, Low Market Share)
- 4.3.4. Dogs (Low Growth, Low Market Share)
- 4.4. Ansoff Matrix Analysis
- 4.5. Supply Chain Analysis
- 4.6. Regulatory Landscape
- 4.7. Current Market Potential and Opportunity Assessment (TAM–SAM–SOM Framework)
- 4.8. VDR Analyst Note
- 4.1. Porters Five Forces
- 5. Market Analysis, Insights and Forecast 2021-2033
- 5.1. Market Analysis, Insights and Forecast - by Application
- 5.1.1. Commercial
- 5.1.2. Government
- 5.1.3. School
- 5.1.4. Industrial
- 5.1.5. Others
- 5.2. Market Analysis, Insights and Forecast - by Types
- 5.2.1. Below 12 Ports
- 5.2.2. 12-24 Ports
- 5.2.3. 24-32 Ports
- 5.2.4. 32-48 Ports
- 5.2.5. Above 48 Ports
- 5.3. Market Analysis, Insights and Forecast - by Region
- 5.3.1. North America
- 5.3.2. South America
- 5.3.3. Europe
- 5.3.4. Middle East & Africa
- 5.3.5. Asia Pacific
- 5.1. Market Analysis, Insights and Forecast - by Application
- 6. Global Managed PoE Switches Analysis, Insights and Forecast, 2021-2033
- 6.1. Market Analysis, Insights and Forecast - by Application
- 6.1.1. Commercial
- 6.1.2. Government
- 6.1.3. School
- 6.1.4. Industrial
- 6.1.5. Others
- 6.2. Market Analysis, Insights and Forecast - by Types
- 6.2.1. Below 12 Ports
- 6.2.2. 12-24 Ports
- 6.2.3. 24-32 Ports
- 6.2.4. 32-48 Ports
- 6.2.5. Above 48 Ports
- 6.1. Market Analysis, Insights and Forecast - by Application
- 7. North America Managed PoE Switches Analysis, Insights and Forecast, 2021-2033
- 7.1. Market Analysis, Insights and Forecast - by Application
- 7.1.1. Commercial
- 7.1.2. Government
- 7.1.3. School
- 7.1.4. Industrial
- 7.1.5. Others
- 7.2. Market Analysis, Insights and Forecast - by Types
- 7.2.1. Below 12 Ports
- 7.2.2. 12-24 Ports
- 7.2.3. 24-32 Ports
- 7.2.4. 32-48 Ports
- 7.2.5. Above 48 Ports
- 7.1. Market Analysis, Insights and Forecast - by Application
- 8. South America Managed PoE Switches Analysis, Insights and Forecast, 2021-2033
- 8.1. Market Analysis, Insights and Forecast - by Application
- 8.1.1. Commercial
- 8.1.2. Government
- 8.1.3. School
- 8.1.4. Industrial
- 8.1.5. Others
- 8.2. Market Analysis, Insights and Forecast - by Types
- 8.2.1. Below 12 Ports
- 8.2.2. 12-24 Ports
- 8.2.3. 24-32 Ports
- 8.2.4. 32-48 Ports
- 8.2.5. Above 48 Ports
- 8.1. Market Analysis, Insights and Forecast - by Application
- 9. Europe Managed PoE Switches Analysis, Insights and Forecast, 2021-2033
- 9.1. Market Analysis, Insights and Forecast - by Application
- 9.1.1. Commercial
- 9.1.2. Government
- 9.1.3. School
- 9.1.4. Industrial
- 9.1.5. Others
- 9.2. Market Analysis, Insights and Forecast - by Types
- 9.2.1. Below 12 Ports
- 9.2.2. 12-24 Ports
- 9.2.3. 24-32 Ports
- 9.2.4. 32-48 Ports
- 9.2.5. Above 48 Ports
- 9.1. Market Analysis, Insights and Forecast - by Application
- 10. Middle East & Africa Managed PoE Switches Analysis, Insights and Forecast, 2021-2033
- 10.1. Market Analysis, Insights and Forecast - by Application
- 10.1.1. Commercial
- 10.1.2. Government
- 10.1.3. School
- 10.1.4. Industrial
- 10.1.5. Others
- 10.2. Market Analysis, Insights and Forecast - by Types
- 10.2.1. Below 12 Ports
- 10.2.2. 12-24 Ports
- 10.2.3. 24-32 Ports
- 10.2.4. 32-48 Ports
- 10.2.5. Above 48 Ports
- 10.1. Market Analysis, Insights and Forecast - by Application
- 11. Asia Pacific Managed PoE Switches Analysis, Insights and Forecast, 2021-2033
- 11.1. Market Analysis, Insights and Forecast - by Application
- 11.1.1. Commercial
- 11.1.2. Government
- 11.1.3. School
- 11.1.4. Industrial
- 11.1.5. Others
- 11.2. Market Analysis, Insights and Forecast - by Types
- 11.2.1. Below 12 Ports
- 11.2.2. 12-24 Ports
- 11.2.3. 24-32 Ports
- 11.2.4. 32-48 Ports
- 11.2.5. Above 48 Ports
- 11.1. Market Analysis, Insights and Forecast - by Application
- 12. Competitive Analysis
- 12.1. Company Profiles
- 12.1.1 Cisco
- 12.1.1.1. Company Overview
- 12.1.1.2. Products
- 12.1.1.3. Company Financials
- 12.1.1.4. SWOT Analysis
- 12.1.2 HPE
- 12.1.2.1. Company Overview
- 12.1.2.2. Products
- 12.1.2.3. Company Financials
- 12.1.2.4. SWOT Analysis
- 12.1.3 Dell
- 12.1.3.1. Company Overview
- 12.1.3.2. Products
- 12.1.3.3. Company Financials
- 12.1.3.4. SWOT Analysis
- 12.1.4 Juniper Networks
- 12.1.4.1. Company Overview
- 12.1.4.2. Products
- 12.1.4.3. Company Financials
- 12.1.4.4. SWOT Analysis
- 12.1.5 Extreme Networks
- 12.1.5.1. Company Overview
- 12.1.5.2. Products
- 12.1.5.3. Company Financials
- 12.1.5.4. SWOT Analysis
- 12.1.6 Alcatel-Lucent Enterprise
- 12.1.6.1. Company Overview
- 12.1.6.2. Products
- 12.1.6.3. Company Financials
- 12.1.6.4. SWOT Analysis
- 12.1.7 Netgear
- 12.1.7.1. Company Overview
- 12.1.7.2. Products
- 12.1.7.3. Company Financials
- 12.1.7.4. SWOT Analysis
- 12.1.8 Broadcom Inc
- 12.1.8.1. Company Overview
- 12.1.8.2. Products
- 12.1.8.3. Company Financials
- 12.1.8.4. SWOT Analysis
- 12.1.9 D-Link
- 12.1.9.1. Company Overview
- 12.1.9.2. Products
- 12.1.9.3. Company Financials
- 12.1.9.4. SWOT Analysis
- 12.1.10 Adtran
- 12.1.10.1. Company Overview
- 12.1.10.2. Products
- 12.1.10.3. Company Financials
- 12.1.10.4. SWOT Analysis
- 12.1.11 Panasonic
- 12.1.11.1. Company Overview
- 12.1.11.2. Products
- 12.1.11.3. Company Financials
- 12.1.11.4. SWOT Analysis
- 12.1.12 Advantech
- 12.1.12.1. Company Overview
- 12.1.12.2. Products
- 12.1.12.3. Company Financials
- 12.1.12.4. SWOT Analysis
- 12.1.13 Zyxel
- 12.1.13.1. Company Overview
- 12.1.13.2. Products
- 12.1.13.3. Company Financials
- 12.1.13.4. SWOT Analysis
- 12.1.14 Alaxala
- 12.1.14.1. Company Overview
- 12.1.14.2. Products
- 12.1.14.3. Company Financials
- 12.1.14.4. SWOT Analysis
- 12.1.15 Microchip Technology
- 12.1.15.1. Company Overview
- 12.1.15.2. Products
- 12.1.15.3. Company Financials
- 12.1.15.4. SWOT Analysis
- 12.1.16 Westermo
- 12.1.16.1. Company Overview
- 12.1.16.2. Products
- 12.1.16.3. Company Financials
- 12.1.16.4. SWOT Analysis
- 12.1.17 Rubytech
- 12.1.17.1. Company Overview
- 12.1.17.2. Products
- 12.1.17.3. Company Financials
- 12.1.17.4. SWOT Analysis
- 12.1.18 Moxa
- 12.1.18.1. Company Overview
- 12.1.18.2. Products
- 12.1.18.3. Company Financials
- 12.1.18.4. SWOT Analysis
- 12.1.19 Repotec
- 12.1.19.1. Company Overview
- 12.1.19.2. Products
- 12.1.19.3. Company Financials
- 12.1.19.4. SWOT Analysis
- 12.1.20 DrayTek
- 12.1.20.1. Company Overview
- 12.1.20.2. Products
- 12.1.20.3. Company Financials
- 12.1.20.4. SWOT Analysis
- 12.1.21 Huawei
- 12.1.21.1. Company Overview
- 12.1.21.2. Products
- 12.1.21.3. Company Financials
- 12.1.21.4. SWOT Analysis
- 12.1.22 TP-Link
- 12.1.22.1. Company Overview
- 12.1.22.2. Products
- 12.1.22.3. Company Financials
- 12.1.22.4. SWOT Analysis
- 12.1.23 Hikvision
- 12.1.23.1. Company Overview
- 12.1.23.2. Products
- 12.1.23.3. Company Financials
- 12.1.23.4. SWOT Analysis
- 12.1.24 Phoenix Contact(EtherWAN)
- 12.1.24.1. Company Overview
- 12.1.24.2. Products
- 12.1.24.3. Company Financials
- 12.1.24.4. SWOT Analysis
- 12.1.25 Shenzhen Folksafe Technology
- 12.1.25.1. Company Overview
- 12.1.25.2. Products
- 12.1.25.3. Company Financials
- 12.1.25.4. SWOT Analysis
- 12.1.1 Cisco
- 12.2. Market Entropy
- 12.2.1 Company's Key Areas Served
- 12.2.2 Recent Developments
- 12.3. Company Market Share Analysis 2025
- 12.3.1 Top 5 Companies Market Share Analysis
- 12.3.2 Top 3 Companies Market Share Analysis
- 12.4. List of Potential Customers
- 13. Research Methodology
List of Figures
- Figure 1: Global Managed PoE Switches Revenue Breakdown (billion, %) by Region 2025 & 2033
- Figure 2: North America Managed PoE Switches Revenue (billion), by Application 2025 & 2033
- Figure 3: North America Managed PoE Switches Revenue Share (%), by Application 2025 & 2033
- Figure 4: North America Managed PoE Switches Revenue (billion), by Types 2025 & 2033
- Figure 5: North America Managed PoE Switches Revenue Share (%), by Types 2025 & 2033
- Figure 6: North America Managed PoE Switches Revenue (billion), by Country 2025 & 2033
- Figure 7: North America Managed PoE Switches Revenue Share (%), by Country 2025 & 2033
- Figure 8: South America Managed PoE Switches Revenue (billion), by Application 2025 & 2033
- Figure 9: South America Managed PoE Switches Revenue Share (%), by Application 2025 & 2033
- Figure 10: South America Managed PoE Switches Revenue (billion), by Types 2025 & 2033
- Figure 11: South America Managed PoE Switches Revenue Share (%), by Types 2025 & 2033
- Figure 12: South America Managed PoE Switches Revenue (billion), by Country 2025 & 2033
- Figure 13: South America Managed PoE Switches Revenue Share (%), by Country 2025 & 2033
- Figure 14: Europe Managed PoE Switches Revenue (billion), by Application 2025 & 2033
- Figure 15: Europe Managed PoE Switches Revenue Share (%), by Application 2025 & 2033
- Figure 16: Europe Managed PoE Switches Revenue (billion), by Types 2025 & 2033
- Figure 17: Europe Managed PoE Switches Revenue Share (%), by Types 2025 & 2033
- Figure 18: Europe Managed PoE Switches Revenue (billion), by Country 2025 & 2033
- Figure 19: Europe Managed PoE Switches Revenue Share (%), by Country 2025 & 2033
- Figure 20: Middle East & Africa Managed PoE Switches Revenue (billion), by Application 2025 & 2033
- Figure 21: Middle East & Africa Managed PoE Switches Revenue Share (%), by Application 2025 & 2033
- Figure 22: Middle East & Africa Managed PoE Switches Revenue (billion), by Types 2025 & 2033
- Figure 23: Middle East & Africa Managed PoE Switches Revenue Share (%), by Types 2025 & 2033
- Figure 24: Middle East & Africa Managed PoE Switches Revenue (billion), by Country 2025 & 2033
- Figure 25: Middle East & Africa Managed PoE Switches Revenue Share (%), by Country 2025 & 2033
- Figure 26: Asia Pacific Managed PoE Switches Revenue (billion), by Application 2025 & 2033
- Figure 27: Asia Pacific Managed PoE Switches Revenue Share (%), by Application 2025 & 2033
- Figure 28: Asia Pacific Managed PoE Switches Revenue (billion), by Types 2025 & 2033
- Figure 29: Asia Pacific Managed PoE Switches Revenue Share (%), by Types 2025 & 2033
- Figure 30: Asia Pacific Managed PoE Switches Revenue (billion), by Country 2025 & 2033
- Figure 31: Asia Pacific Managed PoE Switches Revenue Share (%), by Country 2025 & 2033
List of Tables
- Table 1: Global Managed PoE Switches Revenue billion Forecast, by Application 2020 & 2033
- Table 2: Global Managed PoE Switches Revenue billion Forecast, by Types 2020 & 2033
- Table 3: Global Managed PoE Switches Revenue billion Forecast, by Region 2020 & 2033
- Table 4: Global Managed PoE Switches Revenue billion Forecast, by Application 2020 & 2033
- Table 5: Global Managed PoE Switches Revenue billion Forecast, by Types 2020 & 2033
- Table 6: Global Managed PoE Switches Revenue billion Forecast, by Country 2020 & 2033
- Table 7: United States Managed PoE Switches Revenue (billion) Forecast, by Application 2020 & 2033
- Table 8: Canada Managed PoE Switches Revenue (billion) Forecast, by Application 2020 & 2033
- Table 9: Mexico Managed PoE Switches Revenue (billion) Forecast, by Application 2020 & 2033
- Table 10: Global Managed PoE Switches Revenue billion Forecast, by Application 2020 & 2033
- Table 11: Global Managed PoE Switches Revenue billion Forecast, by Types 2020 & 2033
- Table 12: Global Managed PoE Switches Revenue billion Forecast, by Country 2020 & 2033
- Table 13: Brazil Managed PoE Switches Revenue (billion) Forecast, by Application 2020 & 2033
- Table 14: Argentina Managed PoE Switches Revenue (billion) Forecast, by Application 2020 & 2033
- Table 15: Rest of South America Managed PoE Switches Revenue (billion) Forecast, by Application 2020 & 2033
- Table 16: Global Managed PoE Switches Revenue billion Forecast, by Application 2020 & 2033
- Table 17: Global Managed PoE Switches Revenue billion Forecast, by Types 2020 & 2033
- Table 18: Global Managed PoE Switches Revenue billion Forecast, by Country 2020 & 2033
- Table 19: United Kingdom Managed PoE Switches Revenue (billion) Forecast, by Application 2020 & 2033
- Table 20: Germany Managed PoE Switches Revenue (billion) Forecast, by Application 2020 & 2033
- Table 21: France Managed PoE Switches Revenue (billion) Forecast, by Application 2020 & 2033
- Table 22: Italy Managed PoE Switches Revenue (billion) Forecast, by Application 2020 & 2033
- Table 23: Spain Managed PoE Switches Revenue (billion) Forecast, by Application 2020 & 2033
- Table 24: Russia Managed PoE Switches Revenue (billion) Forecast, by Application 2020 & 2033
- Table 25: Benelux Managed PoE Switches Revenue (billion) Forecast, by Application 2020 & 2033
- Table 26: Nordics Managed PoE Switches Revenue (billion) Forecast, by Application 2020 & 2033
- Table 27: Rest of Europe Managed PoE Switches Revenue (billion) Forecast, by Application 2020 & 2033
- Table 28: Global Managed PoE Switches Revenue billion Forecast, by Application 2020 & 2033
- Table 29: Global Managed PoE Switches Revenue billion Forecast, by Types 2020 & 2033
- Table 30: Global Managed PoE Switches Revenue billion Forecast, by Country 2020 & 2033
- Table 31: Turkey Managed PoE Switches Revenue (billion) Forecast, by Application 2020 & 2033
- Table 32: Israel Managed PoE Switches Revenue (billion) Forecast, by Application 2020 & 2033
- Table 33: GCC Managed PoE Switches Revenue (billion) Forecast, by Application 2020 & 2033
- Table 34: North Africa Managed PoE Switches Revenue (billion) Forecast, by Application 2020 & 2033
- Table 35: South Africa Managed PoE Switches Revenue (billion) Forecast, by Application 2020 & 2033
- Table 36: Rest of Middle East & Africa Managed PoE Switches Revenue (billion) Forecast, by Application 2020 & 2033
- Table 37: Global Managed PoE Switches Revenue billion Forecast, by Application 2020 & 2033
- Table 38: Global Managed PoE Switches Revenue billion Forecast, by Types 2020 & 2033
- Table 39: Global Managed PoE Switches Revenue billion Forecast, by Country 2020 & 2033
- Table 40: China Managed PoE Switches Revenue (billion) Forecast, by Application 2020 & 2033
- Table 41: India Managed PoE Switches Revenue (billion) Forecast, by Application 2020 & 2033
- Table 42: Japan Managed PoE Switches Revenue (billion) Forecast, by Application 2020 & 2033
- Table 43: South Korea Managed PoE Switches Revenue (billion) Forecast, by Application 2020 & 2033
- Table 44: ASEAN Managed PoE Switches Revenue (billion) Forecast, by Application 2020 & 2033
- Table 45: Oceania Managed PoE Switches Revenue (billion) Forecast, by Application 2020 & 2033
- Table 46: Rest of Asia Pacific Managed PoE Switches Revenue (billion) Forecast, by Application 2020 & 2033
Frequently Asked Questions
1. What is the projected Compound Annual Growth Rate (CAGR) of the Managed PoE Switches?
The projected CAGR is approximately 14.39%.
2. Which companies are prominent players in the Managed PoE Switches?
Key companies in the market include Cisco, HPE, Dell, Juniper Networks, Extreme Networks, Alcatel-Lucent Enterprise, Netgear, Broadcom Inc, D-Link, Adtran, Panasonic, Advantech, Zyxel, Alaxala, Microchip Technology, Westermo, Rubytech, Moxa, Repotec, DrayTek, Huawei, TP-Link, Hikvision, Phoenix Contact(EtherWAN), Shenzhen Folksafe Technology.
3. What are the main segments of the Managed PoE Switches?
The market segments include Application, Types.
4. Can you provide details about the market size?
The market size is estimated to be USD 7.04 billion as of 2022.
5. What are some drivers contributing to market growth?
N/A
6. What are the notable trends driving market growth?
N/A
7. Are there any restraints impacting market growth?
N/A
8. Can you provide examples of recent developments in the market?
N/A
9. What pricing options are available for accessing the report?
Pricing options include single-user, multi-user, and enterprise licenses priced at USD 2900.00, USD 4350.00, and USD 5800.00 respectively.
10. Is the market size provided in terms of value or volume?
The market size is provided in terms of value, measured in billion.
11. Are there any specific market keywords associated with the report?
Yes, the market keyword associated with the report is "Managed PoE Switches," which aids in identifying and referencing the specific market segment covered.
12. How do I determine which pricing option suits my needs best?
The pricing options vary based on user requirements and access needs. Individual users may opt for single-user licenses, while businesses requiring broader access may choose multi-user or enterprise licenses for cost-effective access to the report.
13. Are there any additional resources or data provided in the Managed PoE Switches report?
While the report offers comprehensive insights, it's advisable to review the specific contents or supplementary materials provided to ascertain if additional resources or data are available.
14. How can I stay updated on further developments or reports in the Managed PoE Switches?
To stay informed about further developments, trends, and reports in the Managed PoE Switches, consider subscribing to industry newsletters, following relevant companies and organizations, or regularly checking reputable industry news sources and publications.
Methodology
Step 1 - Identification of Relevant Samples Size from Population Database


Step 2 - Approaches for Defining Global Market Size (Value, Volume* & Price*)

Note*: In applicable scenarios
Step 3 - Data Sources
Primary Research
- Web Analytics
- Survey Reports
- Research Institute
- Latest Research Reports
- Opinion Leaders
Secondary Research
- Annual Reports
- White Paper
- Latest Press Release
- Industry Association
- Paid Database
- Investor Presentations

Step 4 - Data Triangulation
Involves using different sources of information in order to increase the validity of a study
These sources are likely to be stakeholders in a program - participants, other researchers, program staff, other community members, and so on.
Then we put all data in single framework & apply various statistical tools to find out the dynamic on the market.
During the analysis stage, feedback from the stakeholder groups would be compared to determine areas of agreement as well as areas of divergence