
Key Insights
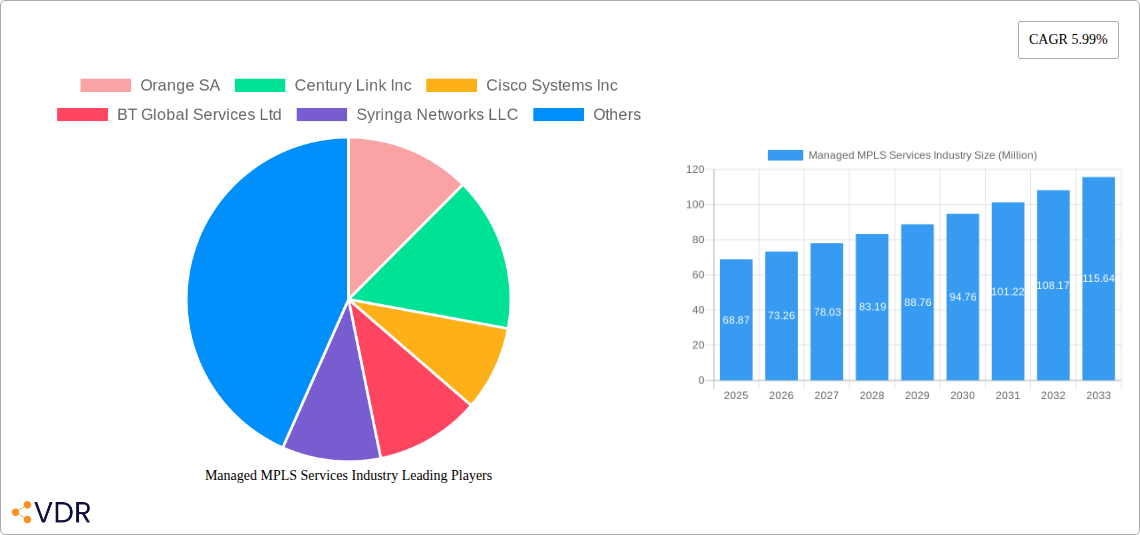
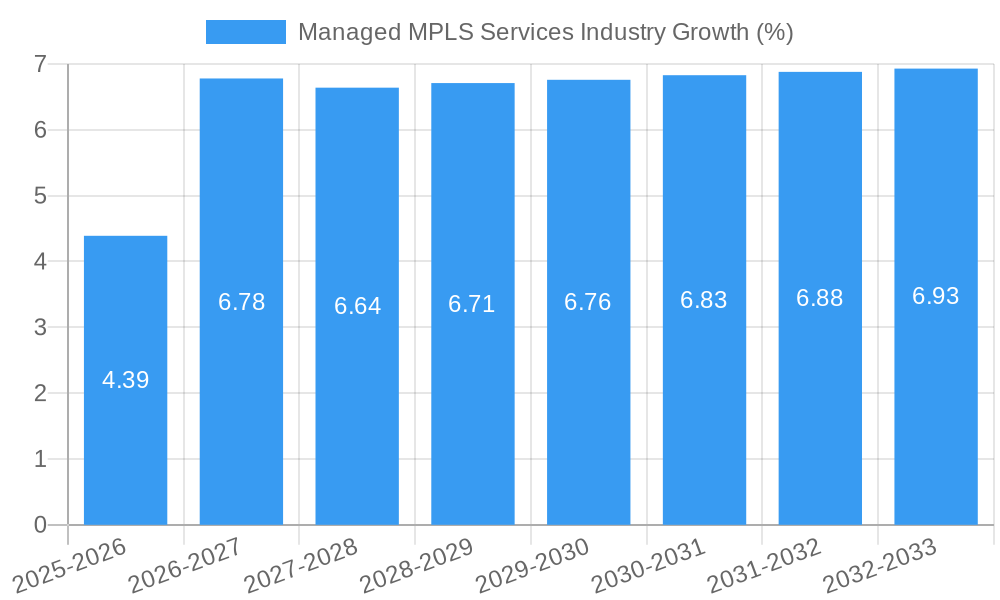
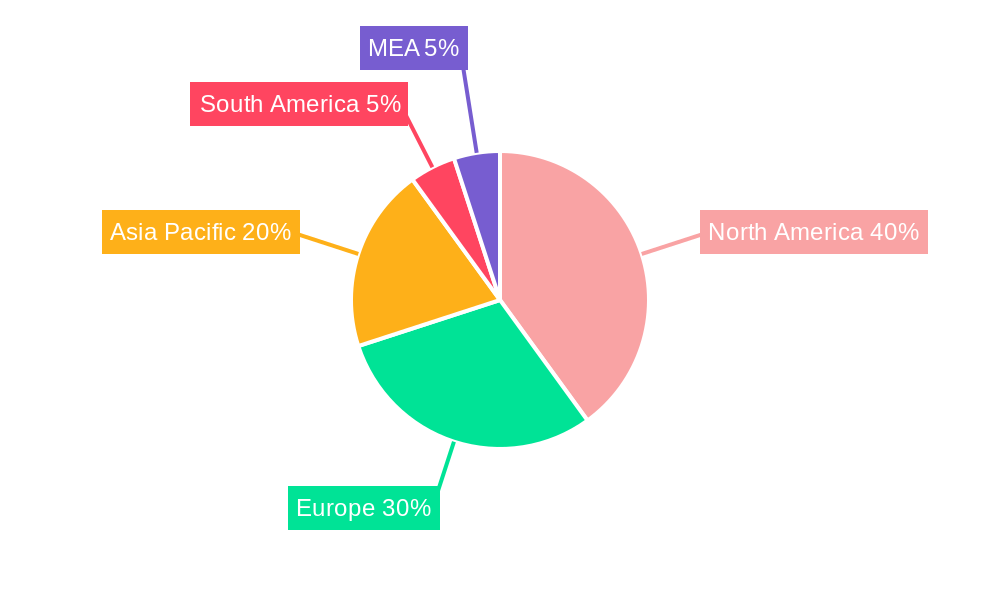
The Managed MPLS Services market, valued at $68.87 million in 2025, is projected to experience robust growth, exhibiting a Compound Annual Growth Rate (CAGR) of 5.99% from 2025 to 2033. This expansion is driven by several key factors. The increasing adoption of cloud computing and the need for secure, reliable network connectivity across geographically dispersed locations are fueling demand for managed MPLS services. Businesses, particularly in sectors like healthcare (requiring HIPAA compliance), BFSI (demanding high security), and retail (needing robust point-of-sale systems), are prioritizing managed services to simplify network management and reduce operational costs. Furthermore, the rising adoption of IoT devices and the need for seamless integration of these devices into enterprise networks are further contributing to market growth. The market segmentation reveals a strong preference for Level 3 VPN services, offering enhanced security and performance compared to Level 2 solutions. Geographically, North America currently holds a significant market share, driven by high technology adoption and a robust digital infrastructure. However, rapid growth is anticipated in Asia Pacific, fuelled by increasing digitalization and infrastructure development across emerging economies like India and China. Competitive pressures from established telecommunication giants alongside specialized managed service providers contribute to a dynamic and innovative market landscape.
The restraints on market growth primarily stem from the high initial investment costs associated with implementing MPLS networks. The emergence of alternative technologies, such as SD-WAN, offering potentially lower costs and greater flexibility, presents a challenge. However, MPLS continues to offer advantages in terms of security and guaranteed quality of service, particularly for mission-critical applications. The market is witnessing a shift towards hybrid network architectures, integrating MPLS with SD-WAN to leverage the strengths of both technologies. This trend reflects a nuanced approach to network optimization rather than a complete replacement of MPLS. The future growth will depend on the ability of service providers to adapt their offerings to meet evolving business needs, focusing on flexible pricing models, enhanced security features, and robust customer support.
Managed MPLS Services Market Report: 2019-2033
This comprehensive report provides a detailed analysis of the Managed MPLS Services market, encompassing market dynamics, growth trends, regional dominance, product landscape, challenges, opportunities, key players, and notable milestones. The study period covers 2019-2033, with 2025 as the base and estimated year. The report offers invaluable insights for industry professionals, investors, and strategists seeking to navigate this evolving landscape. The market is segmented by service (Level 2 VPN, Level 3 VPN) and end-user vertical (Healthcare, BFSI, Retail, Manufacturing, Government, IT & Telecommunication, Other). The report projects a market value of xx Million by 2033.
Managed MPLS Services Industry Market Dynamics & Structure
The Managed MPLS Services market is characterized by moderate concentration, with a few major players holding significant market share. Technological innovation, particularly in software-defined networking (SDN) and network function virtualization (NFV), is a key driver. Regulatory frameworks, varying across regions, impact market access and operational costs. Competitive substitutes, such as Software-Defined Wide Area Networks (SD-WAN), are gaining traction, posing a challenge to traditional MPLS. End-user demographics, particularly the growth of cloud adoption and the digital transformation across industries, shape demand. M&A activity has been relatively steady, with consolidation among providers aiming to expand service portfolios and geographic reach.
- Market Concentration: Moderately concentrated, with top 5 players holding approximately xx% market share in 2025.
- Technological Innovation: SDN, NFV, and automation driving efficiency and cost reduction.
- Regulatory Landscape: Varying regulations across regions impacting market access and compliance.
- Competitive Substitutes: SD-WAN adoption increasing, impacting MPLS market growth.
- M&A Activity: xx deals recorded between 2019 and 2024, indicating consolidation trends.
- Innovation Barriers: High initial investment costs and integration complexities hinder innovation.
Managed MPLS Services Industry Growth Trends & Insights
The Managed MPLS Services market experienced significant growth during the historical period (2019-2024), driven by increasing enterprise adoption of cloud services and the need for secure, reliable connectivity. The market size reached xx Million in 2024. The CAGR during this period was xx%. Technological disruptions, such as the rise of SD-WAN, are impacting adoption rates, leading to a shift in consumer behavior towards more flexible and cost-effective solutions. However, the forecast period (2025-2033) projects continued growth, albeit at a slightly moderated pace, fueled by the ongoing digital transformation and expansion of 5G networks. Market penetration is expected to reach xx% by 2033. This growth will be particularly notable in emerging economies with expanding digital infrastructure.
Dominant Regions, Countries, or Segments in Managed MPLS Services Industry
North America currently holds the largest market share in the Managed MPLS Services industry, driven by strong technological advancements and high adoption rates among enterprises. However, the Asia-Pacific region is expected to witness the fastest growth in the forecast period due to rapid economic development and increasing digitalization. Within the segments, Level 2 VPN currently dominates due to its cost-effectiveness for smaller businesses, while Level 3 VPN is gaining traction among larger enterprises requiring higher levels of security and performance. The BFSI sector is the leading end-user vertical due to its stringent security requirements and high data transmission needs.
- North America: High adoption rates, advanced technology infrastructure.
- Asia-Pacific: Fastest growth potential, driven by expanding digitalization.
- Level 2 VPN: Cost-effective, high adoption among SMBs.
- Level 3 VPN: High security and performance, gaining traction among large enterprises.
- BFSI: Stringent security needs, high data transmission, driving sector growth.
- Healthcare: Growing adoption for secure data transfer, telemedicine applications.
Managed MPLS Services Industry Product Landscape
Managed MPLS services are evolving to incorporate advanced features like SDN, NFV, and AI-powered network management tools. These advancements enhance network performance, security, and scalability. Unique selling propositions include guaranteed service level agreements (SLAs), flexible bandwidth options, and robust security features like encryption and access controls. Technological innovations focus on simplifying network management, improving network visibility, and reducing operational costs for end-users.
Key Drivers, Barriers & Challenges in Managed MPLS Services Industry
Key Drivers:
- Increasing demand for secure and reliable network connectivity for businesses.
- Growing adoption of cloud services and the need for hybrid cloud solutions.
- Expansion of 5G networks enhancing network capabilities and performance.
Challenges:
- Competition from emerging technologies like SD-WAN, impacting MPLS market share. This is estimated to reduce the market size by approximately xx Million by 2033.
- High initial investment costs and complexity of implementation remain barriers to adoption.
- Regulatory changes and compliance requirements add complexity and cost.
Emerging Opportunities in Managed MPLS Services Industry
- Growing demand for secure connectivity in emerging markets presents significant opportunities for expansion.
- Integration of MPLS with emerging technologies like IoT and Edge computing offers new applications.
- Customized and managed services tailored to specific industry needs drive market growth.
Growth Accelerators in the Managed MPLS Services Industry
The long-term growth of the Managed MPLS Services market is driven by continuous technological advancements, strategic partnerships between providers and technology vendors, and expansion into new geographic markets. The increasing adoption of hybrid and multi-cloud architectures necessitates secure and reliable connectivity, fueling demand for MPLS services.
Key Players Shaping the Managed MPLS Services Industry Market
- Orange SA
- CenturyLink Inc
- Cisco Systems Inc
- BT Global Services Ltd
- Syringa Networks LLC
- Sprint Nextel Corporation
- AT&T Communications Inc
- Netmagic Solutions Pvt Ltd (NTT Communications)
- Verizon Communications Inc
- Vodafone Group PLC
Notable Milestones in Managed MPLS Services Industry Sector
- November 2022: Wipro and VMware's cloud services partnership expands multi-cloud enterprise tools to BFSI, healthcare, and retail sectors, indirectly impacting MPLS demand for hybrid cloud solutions.
- April 2022: RailTel Corporation of India's MPLS-VPN deployment across 33 RVNL locations demonstrates government investment in network infrastructure, boosting market growth in India.
In-Depth Managed MPLS Services Industry Market Outlook
The future of the Managed MPLS Services market is promising, driven by sustained demand for secure and reliable connectivity, particularly with the increasing adoption of cloud services and IoT devices. Strategic partnerships and technological innovation will continue to shape the industry, opening up new opportunities for growth. The focus on optimizing network performance, enhancing security features, and lowering operational costs will remain crucial for market success.
Managed MPLS Services Industry Segmentation
-
1. Service (Qualitative Trend Analysis)
- 1.1. MPLS-based VPNs
- 1.2. IP transit
- 1.3. Cloud connectivity
-
2. End-user Vertical
- 2.1. Healthcare
- 2.2. BFSI
- 2.3. Retail
- 2.4. Manufacturing
- 2.5. Government
- 2.6. IT and Telecommunication
- 2.7. Other End-user Verticals
Managed MPLS Services Industry Segmentation By Geography
- 1. North America
- 2. Europe
- 3. Asia Pacific
- 4. Latin America
- 5. Middle East
Managed MPLS Services Industry REPORT HIGHLIGHTS
| Aspects | Details |
|---|---|
| Study Period | 2019-2033 |
| Base Year | 2024 |
| Estimated Year | 2025 |
| Forecast Period | 2025-2033 |
| Historical Period | 2019-2024 |
| Growth Rate | CAGR of 5.99% from 2019-2033 |
| Segmentation |
|
Table of Contents
- 1. Introduction
- 1.1. Research Scope
- 1.2. Market Segmentation
- 1.3. Research Methodology
- 1.4. Definitions and Assumptions
- 2. Executive Summary
- 2.1. Introduction
- 3. Market Dynamics
- 3.1. Introduction
- 3.2. Market Drivers
- 3.2.1. Rise in Mobile Backhaul Networks; Increased Penetration of Cloud Services
- 3.3. Market Restrains
- 3.3.1. Higher Costs Associated With MPLS
- 3.4. Market Trends
- 3.4.1. BFSI Industry is Expected to Drive the Market Growth
- 4. Market Factor Analysis
- 4.1. Porters Five Forces
- 4.2. Supply/Value Chain
- 4.3. PESTEL analysis
- 4.4. Market Entropy
- 4.5. Patent/Trademark Analysis
- 5. Global Managed MPLS Services Industry Analysis, Insights and Forecast, 2019-2031
- 5.1. Market Analysis, Insights and Forecast - by Service (Qualitative Trend Analysis)
- 5.1.1. MPLS-based VPNs
- 5.1.2. IP transit
- 5.1.3. Cloud connectivity
- 5.2. Market Analysis, Insights and Forecast - by End-user Vertical
- 5.2.1. Healthcare
- 5.2.2. BFSI
- 5.2.3. Retail
- 5.2.4. Manufacturing
- 5.2.5. Government
- 5.2.6. IT and Telecommunication
- 5.2.7. Other End-user Verticals
- 5.3. Market Analysis, Insights and Forecast - by Region
- 5.3.1. North America
- 5.3.2. Europe
- 5.3.3. Asia Pacific
- 5.3.4. Latin America
- 5.3.5. Middle East
- 5.1. Market Analysis, Insights and Forecast - by Service (Qualitative Trend Analysis)
- 6. North America Managed MPLS Services Industry Analysis, Insights and Forecast, 2019-2031
- 6.1. Market Analysis, Insights and Forecast - by Service (Qualitative Trend Analysis)
- 6.1.1. MPLS-based VPNs
- 6.1.2. IP transit
- 6.1.3. Cloud connectivity
- 6.2. Market Analysis, Insights and Forecast - by End-user Vertical
- 6.2.1. Healthcare
- 6.2.2. BFSI
- 6.2.3. Retail
- 6.2.4. Manufacturing
- 6.2.5. Government
- 6.2.6. IT and Telecommunication
- 6.2.7. Other End-user Verticals
- 6.1. Market Analysis, Insights and Forecast - by Service (Qualitative Trend Analysis)
- 7. Europe Managed MPLS Services Industry Analysis, Insights and Forecast, 2019-2031
- 7.1. Market Analysis, Insights and Forecast - by Service (Qualitative Trend Analysis)
- 7.1.1. MPLS-based VPNs
- 7.1.2. IP transit
- 7.1.3. Cloud connectivity
- 7.2. Market Analysis, Insights and Forecast - by End-user Vertical
- 7.2.1. Healthcare
- 7.2.2. BFSI
- 7.2.3. Retail
- 7.2.4. Manufacturing
- 7.2.5. Government
- 7.2.6. IT and Telecommunication
- 7.2.7. Other End-user Verticals
- 7.1. Market Analysis, Insights and Forecast - by Service (Qualitative Trend Analysis)
- 8. Asia Pacific Managed MPLS Services Industry Analysis, Insights and Forecast, 2019-2031
- 8.1. Market Analysis, Insights and Forecast - by Service (Qualitative Trend Analysis)
- 8.1.1. MPLS-based VPNs
- 8.1.2. IP transit
- 8.1.3. Cloud connectivity
- 8.2. Market Analysis, Insights and Forecast - by End-user Vertical
- 8.2.1. Healthcare
- 8.2.2. BFSI
- 8.2.3. Retail
- 8.2.4. Manufacturing
- 8.2.5. Government
- 8.2.6. IT and Telecommunication
- 8.2.7. Other End-user Verticals
- 8.1. Market Analysis, Insights and Forecast - by Service (Qualitative Trend Analysis)
- 9. Latin America Managed MPLS Services Industry Analysis, Insights and Forecast, 2019-2031
- 9.1. Market Analysis, Insights and Forecast - by Service (Qualitative Trend Analysis)
- 9.1.1. MPLS-based VPNs
- 9.1.2. IP transit
- 9.1.3. Cloud connectivity
- 9.2. Market Analysis, Insights and Forecast - by End-user Vertical
- 9.2.1. Healthcare
- 9.2.2. BFSI
- 9.2.3. Retail
- 9.2.4. Manufacturing
- 9.2.5. Government
- 9.2.6. IT and Telecommunication
- 9.2.7. Other End-user Verticals
- 9.1. Market Analysis, Insights and Forecast - by Service (Qualitative Trend Analysis)
- 10. Middle East Managed MPLS Services Industry Analysis, Insights and Forecast, 2019-2031
- 10.1. Market Analysis, Insights and Forecast - by Service (Qualitative Trend Analysis)
- 10.1.1. MPLS-based VPNs
- 10.1.2. IP transit
- 10.1.3. Cloud connectivity
- 10.2. Market Analysis, Insights and Forecast - by End-user Vertical
- 10.2.1. Healthcare
- 10.2.2. BFSI
- 10.2.3. Retail
- 10.2.4. Manufacturing
- 10.2.5. Government
- 10.2.6. IT and Telecommunication
- 10.2.7. Other End-user Verticals
- 10.1. Market Analysis, Insights and Forecast - by Service (Qualitative Trend Analysis)
- 11. North America Managed MPLS Services Industry Analysis, Insights and Forecast, 2019-2031
- 11.1. Market Analysis, Insights and Forecast - By Country/Sub-region
- 11.1.1 United States
- 11.1.2 Canada
- 11.1.3 Mexico
- 12. Europe Managed MPLS Services Industry Analysis, Insights and Forecast, 2019-2031
- 12.1. Market Analysis, Insights and Forecast - By Country/Sub-region
- 12.1.1 Germany
- 12.1.2 United Kingdom
- 12.1.3 France
- 12.1.4 Spain
- 12.1.5 Italy
- 12.1.6 Spain
- 12.1.7 Belgium
- 12.1.8 Netherland
- 12.1.9 Nordics
- 12.1.10 Rest of Europe
- 13. Asia Pacific Managed MPLS Services Industry Analysis, Insights and Forecast, 2019-2031
- 13.1. Market Analysis, Insights and Forecast - By Country/Sub-region
- 13.1.1 China
- 13.1.2 Japan
- 13.1.3 India
- 13.1.4 South Korea
- 13.1.5 Southeast Asia
- 13.1.6 Australia
- 13.1.7 Indonesia
- 13.1.8 Phillipes
- 13.1.9 Singapore
- 13.1.10 Thailandc
- 13.1.11 Rest of Asia Pacific
- 14. South America Managed MPLS Services Industry Analysis, Insights and Forecast, 2019-2031
- 14.1. Market Analysis, Insights and Forecast - By Country/Sub-region
- 14.1.1 Brazil
- 14.1.2 Argentina
- 14.1.3 Peru
- 14.1.4 Chile
- 14.1.5 Colombia
- 14.1.6 Ecuador
- 14.1.7 Venezuela
- 14.1.8 Rest of South America
- 15. North America Managed MPLS Services Industry Analysis, Insights and Forecast, 2019-2031
- 15.1. Market Analysis, Insights and Forecast - By Country/Sub-region
- 15.1.1 United States
- 15.1.2 Canada
- 15.1.3 Mexico
- 16. MEA Managed MPLS Services Industry Analysis, Insights and Forecast, 2019-2031
- 16.1. Market Analysis, Insights and Forecast - By Country/Sub-region
- 16.1.1 United Arab Emirates
- 16.1.2 Saudi Arabia
- 16.1.3 South Africa
- 16.1.4 Rest of Middle East and Africa
- 17. Competitive Analysis
- 17.1. Global Market Share Analysis 2024
- 17.2. Company Profiles
- 17.2.1 Orange SA
- 17.2.1.1. Overview
- 17.2.1.2. Products
- 17.2.1.3. SWOT Analysis
- 17.2.1.4. Recent Developments
- 17.2.1.5. Financials (Based on Availability)
- 17.2.2 Century Link Inc
- 17.2.2.1. Overview
- 17.2.2.2. Products
- 17.2.2.3. SWOT Analysis
- 17.2.2.4. Recent Developments
- 17.2.2.5. Financials (Based on Availability)
- 17.2.3 Cisco Systems Inc
- 17.2.3.1. Overview
- 17.2.3.2. Products
- 17.2.3.3. SWOT Analysis
- 17.2.3.4. Recent Developments
- 17.2.3.5. Financials (Based on Availability)
- 17.2.4 BT Global Services Ltd
- 17.2.4.1. Overview
- 17.2.4.2. Products
- 17.2.4.3. SWOT Analysis
- 17.2.4.4. Recent Developments
- 17.2.4.5. Financials (Based on Availability)
- 17.2.5 Syringa Networks LLC
- 17.2.5.1. Overview
- 17.2.5.2. Products
- 17.2.5.3. SWOT Analysis
- 17.2.5.4. Recent Developments
- 17.2.5.5. Financials (Based on Availability)
- 17.2.6 Sprint Nextel Corporation
- 17.2.6.1. Overview
- 17.2.6.2. Products
- 17.2.6.3. SWOT Analysis
- 17.2.6.4. Recent Developments
- 17.2.6.5. Financials (Based on Availability)
- 17.2.7 AT&T Communications Inc
- 17.2.7.1. Overview
- 17.2.7.2. Products
- 17.2.7.3. SWOT Analysis
- 17.2.7.4. Recent Developments
- 17.2.7.5. Financials (Based on Availability)
- 17.2.8 Netmagic Solutions Pvt Ltd (NTT Communications)
- 17.2.8.1. Overview
- 17.2.8.2. Products
- 17.2.8.3. SWOT Analysis
- 17.2.8.4. Recent Developments
- 17.2.8.5. Financials (Based on Availability)
- 17.2.9 Verizon Communications Inc
- 17.2.9.1. Overview
- 17.2.9.2. Products
- 17.2.9.3. SWOT Analysis
- 17.2.9.4. Recent Developments
- 17.2.9.5. Financials (Based on Availability)
- 17.2.10 Vodafone Group PLC
- 17.2.10.1. Overview
- 17.2.10.2. Products
- 17.2.10.3. SWOT Analysis
- 17.2.10.4. Recent Developments
- 17.2.10.5. Financials (Based on Availability)
- 17.2.1 Orange SA
List of Figures
- Figure 1: Global Managed MPLS Services Industry Revenue Breakdown (Million, %) by Region 2024 & 2032
- Figure 2: Global Managed MPLS Services Industry Volume Breakdown (K Unit, %) by Region 2024 & 2032
- Figure 3: North America Managed MPLS Services Industry Revenue (Million), by Country 2024 & 2032
- Figure 4: North America Managed MPLS Services Industry Volume (K Unit), by Country 2024 & 2032
- Figure 5: North America Managed MPLS Services Industry Revenue Share (%), by Country 2024 & 2032
- Figure 6: North America Managed MPLS Services Industry Volume Share (%), by Country 2024 & 2032
- Figure 7: Europe Managed MPLS Services Industry Revenue (Million), by Country 2024 & 2032
- Figure 8: Europe Managed MPLS Services Industry Volume (K Unit), by Country 2024 & 2032
- Figure 9: Europe Managed MPLS Services Industry Revenue Share (%), by Country 2024 & 2032
- Figure 10: Europe Managed MPLS Services Industry Volume Share (%), by Country 2024 & 2032
- Figure 11: Asia Pacific Managed MPLS Services Industry Revenue (Million), by Country 2024 & 2032
- Figure 12: Asia Pacific Managed MPLS Services Industry Volume (K Unit), by Country 2024 & 2032
- Figure 13: Asia Pacific Managed MPLS Services Industry Revenue Share (%), by Country 2024 & 2032
- Figure 14: Asia Pacific Managed MPLS Services Industry Volume Share (%), by Country 2024 & 2032
- Figure 15: South America Managed MPLS Services Industry Revenue (Million), by Country 2024 & 2032
- Figure 16: South America Managed MPLS Services Industry Volume (K Unit), by Country 2024 & 2032
- Figure 17: South America Managed MPLS Services Industry Revenue Share (%), by Country 2024 & 2032
- Figure 18: South America Managed MPLS Services Industry Volume Share (%), by Country 2024 & 2032
- Figure 19: North America Managed MPLS Services Industry Revenue (Million), by Country 2024 & 2032
- Figure 20: North America Managed MPLS Services Industry Volume (K Unit), by Country 2024 & 2032
- Figure 21: North America Managed MPLS Services Industry Revenue Share (%), by Country 2024 & 2032
- Figure 22: North America Managed MPLS Services Industry Volume Share (%), by Country 2024 & 2032
- Figure 23: MEA Managed MPLS Services Industry Revenue (Million), by Country 2024 & 2032
- Figure 24: MEA Managed MPLS Services Industry Volume (K Unit), by Country 2024 & 2032
- Figure 25: MEA Managed MPLS Services Industry Revenue Share (%), by Country 2024 & 2032
- Figure 26: MEA Managed MPLS Services Industry Volume Share (%), by Country 2024 & 2032
- Figure 27: North America Managed MPLS Services Industry Revenue (Million), by Service (Qualitative Trend Analysis) 2024 & 2032
- Figure 28: North America Managed MPLS Services Industry Volume (K Unit), by Service (Qualitative Trend Analysis) 2024 & 2032
- Figure 29: North America Managed MPLS Services Industry Revenue Share (%), by Service (Qualitative Trend Analysis) 2024 & 2032
- Figure 30: North America Managed MPLS Services Industry Volume Share (%), by Service (Qualitative Trend Analysis) 2024 & 2032
- Figure 31: North America Managed MPLS Services Industry Revenue (Million), by End-user Vertical 2024 & 2032
- Figure 32: North America Managed MPLS Services Industry Volume (K Unit), by End-user Vertical 2024 & 2032
- Figure 33: North America Managed MPLS Services Industry Revenue Share (%), by End-user Vertical 2024 & 2032
- Figure 34: North America Managed MPLS Services Industry Volume Share (%), by End-user Vertical 2024 & 2032
- Figure 35: North America Managed MPLS Services Industry Revenue (Million), by Country 2024 & 2032
- Figure 36: North America Managed MPLS Services Industry Volume (K Unit), by Country 2024 & 2032
- Figure 37: North America Managed MPLS Services Industry Revenue Share (%), by Country 2024 & 2032
- Figure 38: North America Managed MPLS Services Industry Volume Share (%), by Country 2024 & 2032
- Figure 39: Europe Managed MPLS Services Industry Revenue (Million), by Service (Qualitative Trend Analysis) 2024 & 2032
- Figure 40: Europe Managed MPLS Services Industry Volume (K Unit), by Service (Qualitative Trend Analysis) 2024 & 2032
- Figure 41: Europe Managed MPLS Services Industry Revenue Share (%), by Service (Qualitative Trend Analysis) 2024 & 2032
- Figure 42: Europe Managed MPLS Services Industry Volume Share (%), by Service (Qualitative Trend Analysis) 2024 & 2032
- Figure 43: Europe Managed MPLS Services Industry Revenue (Million), by End-user Vertical 2024 & 2032
- Figure 44: Europe Managed MPLS Services Industry Volume (K Unit), by End-user Vertical 2024 & 2032
- Figure 45: Europe Managed MPLS Services Industry Revenue Share (%), by End-user Vertical 2024 & 2032
- Figure 46: Europe Managed MPLS Services Industry Volume Share (%), by End-user Vertical 2024 & 2032
- Figure 47: Europe Managed MPLS Services Industry Revenue (Million), by Country 2024 & 2032
- Figure 48: Europe Managed MPLS Services Industry Volume (K Unit), by Country 2024 & 2032
- Figure 49: Europe Managed MPLS Services Industry Revenue Share (%), by Country 2024 & 2032
- Figure 50: Europe Managed MPLS Services Industry Volume Share (%), by Country 2024 & 2032
- Figure 51: Asia Pacific Managed MPLS Services Industry Revenue (Million), by Service (Qualitative Trend Analysis) 2024 & 2032
- Figure 52: Asia Pacific Managed MPLS Services Industry Volume (K Unit), by Service (Qualitative Trend Analysis) 2024 & 2032
- Figure 53: Asia Pacific Managed MPLS Services Industry Revenue Share (%), by Service (Qualitative Trend Analysis) 2024 & 2032
- Figure 54: Asia Pacific Managed MPLS Services Industry Volume Share (%), by Service (Qualitative Trend Analysis) 2024 & 2032
- Figure 55: Asia Pacific Managed MPLS Services Industry Revenue (Million), by End-user Vertical 2024 & 2032
- Figure 56: Asia Pacific Managed MPLS Services Industry Volume (K Unit), by End-user Vertical 2024 & 2032
- Figure 57: Asia Pacific Managed MPLS Services Industry Revenue Share (%), by End-user Vertical 2024 & 2032
- Figure 58: Asia Pacific Managed MPLS Services Industry Volume Share (%), by End-user Vertical 2024 & 2032
- Figure 59: Asia Pacific Managed MPLS Services Industry Revenue (Million), by Country 2024 & 2032
- Figure 60: Asia Pacific Managed MPLS Services Industry Volume (K Unit), by Country 2024 & 2032
- Figure 61: Asia Pacific Managed MPLS Services Industry Revenue Share (%), by Country 2024 & 2032
- Figure 62: Asia Pacific Managed MPLS Services Industry Volume Share (%), by Country 2024 & 2032
- Figure 63: Latin America Managed MPLS Services Industry Revenue (Million), by Service (Qualitative Trend Analysis) 2024 & 2032
- Figure 64: Latin America Managed MPLS Services Industry Volume (K Unit), by Service (Qualitative Trend Analysis) 2024 & 2032
- Figure 65: Latin America Managed MPLS Services Industry Revenue Share (%), by Service (Qualitative Trend Analysis) 2024 & 2032
- Figure 66: Latin America Managed MPLS Services Industry Volume Share (%), by Service (Qualitative Trend Analysis) 2024 & 2032
- Figure 67: Latin America Managed MPLS Services Industry Revenue (Million), by End-user Vertical 2024 & 2032
- Figure 68: Latin America Managed MPLS Services Industry Volume (K Unit), by End-user Vertical 2024 & 2032
- Figure 69: Latin America Managed MPLS Services Industry Revenue Share (%), by End-user Vertical 2024 & 2032
- Figure 70: Latin America Managed MPLS Services Industry Volume Share (%), by End-user Vertical 2024 & 2032
- Figure 71: Latin America Managed MPLS Services Industry Revenue (Million), by Country 2024 & 2032
- Figure 72: Latin America Managed MPLS Services Industry Volume (K Unit), by Country 2024 & 2032
- Figure 73: Latin America Managed MPLS Services Industry Revenue Share (%), by Country 2024 & 2032
- Figure 74: Latin America Managed MPLS Services Industry Volume Share (%), by Country 2024 & 2032
- Figure 75: Middle East Managed MPLS Services Industry Revenue (Million), by Service (Qualitative Trend Analysis) 2024 & 2032
- Figure 76: Middle East Managed MPLS Services Industry Volume (K Unit), by Service (Qualitative Trend Analysis) 2024 & 2032
- Figure 77: Middle East Managed MPLS Services Industry Revenue Share (%), by Service (Qualitative Trend Analysis) 2024 & 2032
- Figure 78: Middle East Managed MPLS Services Industry Volume Share (%), by Service (Qualitative Trend Analysis) 2024 & 2032
- Figure 79: Middle East Managed MPLS Services Industry Revenue (Million), by End-user Vertical 2024 & 2032
- Figure 80: Middle East Managed MPLS Services Industry Volume (K Unit), by End-user Vertical 2024 & 2032
- Figure 81: Middle East Managed MPLS Services Industry Revenue Share (%), by End-user Vertical 2024 & 2032
- Figure 82: Middle East Managed MPLS Services Industry Volume Share (%), by End-user Vertical 2024 & 2032
- Figure 83: Middle East Managed MPLS Services Industry Revenue (Million), by Country 2024 & 2032
- Figure 84: Middle East Managed MPLS Services Industry Volume (K Unit), by Country 2024 & 2032
- Figure 85: Middle East Managed MPLS Services Industry Revenue Share (%), by Country 2024 & 2032
- Figure 86: Middle East Managed MPLS Services Industry Volume Share (%), by Country 2024 & 2032
List of Tables
- Table 1: Global Managed MPLS Services Industry Revenue Million Forecast, by Region 2019 & 2032
- Table 2: Global Managed MPLS Services Industry Volume K Unit Forecast, by Region 2019 & 2032
- Table 3: Global Managed MPLS Services Industry Revenue Million Forecast, by Service (Qualitative Trend Analysis) 2019 & 2032
- Table 4: Global Managed MPLS Services Industry Volume K Unit Forecast, by Service (Qualitative Trend Analysis) 2019 & 2032
- Table 5: Global Managed MPLS Services Industry Revenue Million Forecast, by End-user Vertical 2019 & 2032
- Table 6: Global Managed MPLS Services Industry Volume K Unit Forecast, by End-user Vertical 2019 & 2032
- Table 7: Global Managed MPLS Services Industry Revenue Million Forecast, by Region 2019 & 2032
- Table 8: Global Managed MPLS Services Industry Volume K Unit Forecast, by Region 2019 & 2032
- Table 9: Global Managed MPLS Services Industry Revenue Million Forecast, by Country 2019 & 2032
- Table 10: Global Managed MPLS Services Industry Volume K Unit Forecast, by Country 2019 & 2032
- Table 11: United States Managed MPLS Services Industry Revenue (Million) Forecast, by Application 2019 & 2032
- Table 12: United States Managed MPLS Services Industry Volume (K Unit) Forecast, by Application 2019 & 2032
- Table 13: Canada Managed MPLS Services Industry Revenue (Million) Forecast, by Application 2019 & 2032
- Table 14: Canada Managed MPLS Services Industry Volume (K Unit) Forecast, by Application 2019 & 2032
- Table 15: Mexico Managed MPLS Services Industry Revenue (Million) Forecast, by Application 2019 & 2032
- Table 16: Mexico Managed MPLS Services Industry Volume (K Unit) Forecast, by Application 2019 & 2032
- Table 17: Global Managed MPLS Services Industry Revenue Million Forecast, by Country 2019 & 2032
- Table 18: Global Managed MPLS Services Industry Volume K Unit Forecast, by Country 2019 & 2032
- Table 19: Germany Managed MPLS Services Industry Revenue (Million) Forecast, by Application 2019 & 2032
- Table 20: Germany Managed MPLS Services Industry Volume (K Unit) Forecast, by Application 2019 & 2032
- Table 21: United Kingdom Managed MPLS Services Industry Revenue (Million) Forecast, by Application 2019 & 2032
- Table 22: United Kingdom Managed MPLS Services Industry Volume (K Unit) Forecast, by Application 2019 & 2032
- Table 23: France Managed MPLS Services Industry Revenue (Million) Forecast, by Application 2019 & 2032
- Table 24: France Managed MPLS Services Industry Volume (K Unit) Forecast, by Application 2019 & 2032
- Table 25: Spain Managed MPLS Services Industry Revenue (Million) Forecast, by Application 2019 & 2032
- Table 26: Spain Managed MPLS Services Industry Volume (K Unit) Forecast, by Application 2019 & 2032
- Table 27: Italy Managed MPLS Services Industry Revenue (Million) Forecast, by Application 2019 & 2032
- Table 28: Italy Managed MPLS Services Industry Volume (K Unit) Forecast, by Application 2019 & 2032
- Table 29: Spain Managed MPLS Services Industry Revenue (Million) Forecast, by Application 2019 & 2032
- Table 30: Spain Managed MPLS Services Industry Volume (K Unit) Forecast, by Application 2019 & 2032
- Table 31: Belgium Managed MPLS Services Industry Revenue (Million) Forecast, by Application 2019 & 2032
- Table 32: Belgium Managed MPLS Services Industry Volume (K Unit) Forecast, by Application 2019 & 2032
- Table 33: Netherland Managed MPLS Services Industry Revenue (Million) Forecast, by Application 2019 & 2032
- Table 34: Netherland Managed MPLS Services Industry Volume (K Unit) Forecast, by Application 2019 & 2032
- Table 35: Nordics Managed MPLS Services Industry Revenue (Million) Forecast, by Application 2019 & 2032
- Table 36: Nordics Managed MPLS Services Industry Volume (K Unit) Forecast, by Application 2019 & 2032
- Table 37: Rest of Europe Managed MPLS Services Industry Revenue (Million) Forecast, by Application 2019 & 2032
- Table 38: Rest of Europe Managed MPLS Services Industry Volume (K Unit) Forecast, by Application 2019 & 2032
- Table 39: Global Managed MPLS Services Industry Revenue Million Forecast, by Country 2019 & 2032
- Table 40: Global Managed MPLS Services Industry Volume K Unit Forecast, by Country 2019 & 2032
- Table 41: China Managed MPLS Services Industry Revenue (Million) Forecast, by Application 2019 & 2032
- Table 42: China Managed MPLS Services Industry Volume (K Unit) Forecast, by Application 2019 & 2032
- Table 43: Japan Managed MPLS Services Industry Revenue (Million) Forecast, by Application 2019 & 2032
- Table 44: Japan Managed MPLS Services Industry Volume (K Unit) Forecast, by Application 2019 & 2032
- Table 45: India Managed MPLS Services Industry Revenue (Million) Forecast, by Application 2019 & 2032
- Table 46: India Managed MPLS Services Industry Volume (K Unit) Forecast, by Application 2019 & 2032
- Table 47: South Korea Managed MPLS Services Industry Revenue (Million) Forecast, by Application 2019 & 2032
- Table 48: South Korea Managed MPLS Services Industry Volume (K Unit) Forecast, by Application 2019 & 2032
- Table 49: Southeast Asia Managed MPLS Services Industry Revenue (Million) Forecast, by Application 2019 & 2032
- Table 50: Southeast Asia Managed MPLS Services Industry Volume (K Unit) Forecast, by Application 2019 & 2032
- Table 51: Australia Managed MPLS Services Industry Revenue (Million) Forecast, by Application 2019 & 2032
- Table 52: Australia Managed MPLS Services Industry Volume (K Unit) Forecast, by Application 2019 & 2032
- Table 53: Indonesia Managed MPLS Services Industry Revenue (Million) Forecast, by Application 2019 & 2032
- Table 54: Indonesia Managed MPLS Services Industry Volume (K Unit) Forecast, by Application 2019 & 2032
- Table 55: Phillipes Managed MPLS Services Industry Revenue (Million) Forecast, by Application 2019 & 2032
- Table 56: Phillipes Managed MPLS Services Industry Volume (K Unit) Forecast, by Application 2019 & 2032
- Table 57: Singapore Managed MPLS Services Industry Revenue (Million) Forecast, by Application 2019 & 2032
- Table 58: Singapore Managed MPLS Services Industry Volume (K Unit) Forecast, by Application 2019 & 2032
- Table 59: Thailandc Managed MPLS Services Industry Revenue (Million) Forecast, by Application 2019 & 2032
- Table 60: Thailandc Managed MPLS Services Industry Volume (K Unit) Forecast, by Application 2019 & 2032
- Table 61: Rest of Asia Pacific Managed MPLS Services Industry Revenue (Million) Forecast, by Application 2019 & 2032
- Table 62: Rest of Asia Pacific Managed MPLS Services Industry Volume (K Unit) Forecast, by Application 2019 & 2032
- Table 63: Global Managed MPLS Services Industry Revenue Million Forecast, by Country 2019 & 2032
- Table 64: Global Managed MPLS Services Industry Volume K Unit Forecast, by Country 2019 & 2032
- Table 65: Brazil Managed MPLS Services Industry Revenue (Million) Forecast, by Application 2019 & 2032
- Table 66: Brazil Managed MPLS Services Industry Volume (K Unit) Forecast, by Application 2019 & 2032
- Table 67: Argentina Managed MPLS Services Industry Revenue (Million) Forecast, by Application 2019 & 2032
- Table 68: Argentina Managed MPLS Services Industry Volume (K Unit) Forecast, by Application 2019 & 2032
- Table 69: Peru Managed MPLS Services Industry Revenue (Million) Forecast, by Application 2019 & 2032
- Table 70: Peru Managed MPLS Services Industry Volume (K Unit) Forecast, by Application 2019 & 2032
- Table 71: Chile Managed MPLS Services Industry Revenue (Million) Forecast, by Application 2019 & 2032
- Table 72: Chile Managed MPLS Services Industry Volume (K Unit) Forecast, by Application 2019 & 2032
- Table 73: Colombia Managed MPLS Services Industry Revenue (Million) Forecast, by Application 2019 & 2032
- Table 74: Colombia Managed MPLS Services Industry Volume (K Unit) Forecast, by Application 2019 & 2032
- Table 75: Ecuador Managed MPLS Services Industry Revenue (Million) Forecast, by Application 2019 & 2032
- Table 76: Ecuador Managed MPLS Services Industry Volume (K Unit) Forecast, by Application 2019 & 2032
- Table 77: Venezuela Managed MPLS Services Industry Revenue (Million) Forecast, by Application 2019 & 2032
- Table 78: Venezuela Managed MPLS Services Industry Volume (K Unit) Forecast, by Application 2019 & 2032
- Table 79: Rest of South America Managed MPLS Services Industry Revenue (Million) Forecast, by Application 2019 & 2032
- Table 80: Rest of South America Managed MPLS Services Industry Volume (K Unit) Forecast, by Application 2019 & 2032
- Table 81: Global Managed MPLS Services Industry Revenue Million Forecast, by Country 2019 & 2032
- Table 82: Global Managed MPLS Services Industry Volume K Unit Forecast, by Country 2019 & 2032
- Table 83: United States Managed MPLS Services Industry Revenue (Million) Forecast, by Application 2019 & 2032
- Table 84: United States Managed MPLS Services Industry Volume (K Unit) Forecast, by Application 2019 & 2032
- Table 85: Canada Managed MPLS Services Industry Revenue (Million) Forecast, by Application 2019 & 2032
- Table 86: Canada Managed MPLS Services Industry Volume (K Unit) Forecast, by Application 2019 & 2032
- Table 87: Mexico Managed MPLS Services Industry Revenue (Million) Forecast, by Application 2019 & 2032
- Table 88: Mexico Managed MPLS Services Industry Volume (K Unit) Forecast, by Application 2019 & 2032
- Table 89: Global Managed MPLS Services Industry Revenue Million Forecast, by Country 2019 & 2032
- Table 90: Global Managed MPLS Services Industry Volume K Unit Forecast, by Country 2019 & 2032
- Table 91: United Arab Emirates Managed MPLS Services Industry Revenue (Million) Forecast, by Application 2019 & 2032
- Table 92: United Arab Emirates Managed MPLS Services Industry Volume (K Unit) Forecast, by Application 2019 & 2032
- Table 93: Saudi Arabia Managed MPLS Services Industry Revenue (Million) Forecast, by Application 2019 & 2032
- Table 94: Saudi Arabia Managed MPLS Services Industry Volume (K Unit) Forecast, by Application 2019 & 2032
- Table 95: South Africa Managed MPLS Services Industry Revenue (Million) Forecast, by Application 2019 & 2032
- Table 96: South Africa Managed MPLS Services Industry Volume (K Unit) Forecast, by Application 2019 & 2032
- Table 97: Rest of Middle East and Africa Managed MPLS Services Industry Revenue (Million) Forecast, by Application 2019 & 2032
- Table 98: Rest of Middle East and Africa Managed MPLS Services Industry Volume (K Unit) Forecast, by Application 2019 & 2032
- Table 99: Global Managed MPLS Services Industry Revenue Million Forecast, by Service (Qualitative Trend Analysis) 2019 & 2032
- Table 100: Global Managed MPLS Services Industry Volume K Unit Forecast, by Service (Qualitative Trend Analysis) 2019 & 2032
- Table 101: Global Managed MPLS Services Industry Revenue Million Forecast, by End-user Vertical 2019 & 2032
- Table 102: Global Managed MPLS Services Industry Volume K Unit Forecast, by End-user Vertical 2019 & 2032
- Table 103: Global Managed MPLS Services Industry Revenue Million Forecast, by Country 2019 & 2032
- Table 104: Global Managed MPLS Services Industry Volume K Unit Forecast, by Country 2019 & 2032
- Table 105: Global Managed MPLS Services Industry Revenue Million Forecast, by Service (Qualitative Trend Analysis) 2019 & 2032
- Table 106: Global Managed MPLS Services Industry Volume K Unit Forecast, by Service (Qualitative Trend Analysis) 2019 & 2032
- Table 107: Global Managed MPLS Services Industry Revenue Million Forecast, by End-user Vertical 2019 & 2032
- Table 108: Global Managed MPLS Services Industry Volume K Unit Forecast, by End-user Vertical 2019 & 2032
- Table 109: Global Managed MPLS Services Industry Revenue Million Forecast, by Country 2019 & 2032
- Table 110: Global Managed MPLS Services Industry Volume K Unit Forecast, by Country 2019 & 2032
- Table 111: Global Managed MPLS Services Industry Revenue Million Forecast, by Service (Qualitative Trend Analysis) 2019 & 2032
- Table 112: Global Managed MPLS Services Industry Volume K Unit Forecast, by Service (Qualitative Trend Analysis) 2019 & 2032
- Table 113: Global Managed MPLS Services Industry Revenue Million Forecast, by End-user Vertical 2019 & 2032
- Table 114: Global Managed MPLS Services Industry Volume K Unit Forecast, by End-user Vertical 2019 & 2032
- Table 115: Global Managed MPLS Services Industry Revenue Million Forecast, by Country 2019 & 2032
- Table 116: Global Managed MPLS Services Industry Volume K Unit Forecast, by Country 2019 & 2032
- Table 117: Global Managed MPLS Services Industry Revenue Million Forecast, by Service (Qualitative Trend Analysis) 2019 & 2032
- Table 118: Global Managed MPLS Services Industry Volume K Unit Forecast, by Service (Qualitative Trend Analysis) 2019 & 2032
- Table 119: Global Managed MPLS Services Industry Revenue Million Forecast, by End-user Vertical 2019 & 2032
- Table 120: Global Managed MPLS Services Industry Volume K Unit Forecast, by End-user Vertical 2019 & 2032
- Table 121: Global Managed MPLS Services Industry Revenue Million Forecast, by Country 2019 & 2032
- Table 122: Global Managed MPLS Services Industry Volume K Unit Forecast, by Country 2019 & 2032
- Table 123: Global Managed MPLS Services Industry Revenue Million Forecast, by Service (Qualitative Trend Analysis) 2019 & 2032
- Table 124: Global Managed MPLS Services Industry Volume K Unit Forecast, by Service (Qualitative Trend Analysis) 2019 & 2032
- Table 125: Global Managed MPLS Services Industry Revenue Million Forecast, by End-user Vertical 2019 & 2032
- Table 126: Global Managed MPLS Services Industry Volume K Unit Forecast, by End-user Vertical 2019 & 2032
- Table 127: Global Managed MPLS Services Industry Revenue Million Forecast, by Country 2019 & 2032
- Table 128: Global Managed MPLS Services Industry Volume K Unit Forecast, by Country 2019 & 2032
Frequently Asked Questions
1. What is the projected Compound Annual Growth Rate (CAGR) of the Managed MPLS Services Industry?
The projected CAGR is approximately 5.99%.
2. Which companies are prominent players in the Managed MPLS Services Industry?
Key companies in the market include Orange SA, Century Link Inc, Cisco Systems Inc, BT Global Services Ltd, Syringa Networks LLC, Sprint Nextel Corporation, AT&T Communications Inc, Netmagic Solutions Pvt Ltd (NTT Communications), Verizon Communications Inc , Vodafone Group PLC.
3. What are the main segments of the Managed MPLS Services Industry?
The market segments include Service (Qualitative Trend Analysis), End-user Vertical.
4. Can you provide details about the market size?
The market size is estimated to be USD 68.87 Million as of 2022.
5. What are some drivers contributing to market growth?
Rise in Mobile Backhaul Networks; Increased Penetration of Cloud Services.
6. What are the notable trends driving market growth?
BFSI Industry is Expected to Drive the Market Growth.
7. Are there any restraints impacting market growth?
Higher Costs Associated With MPLS.
8. Can you provide examples of recent developments in the market?
November 2022 - Wipro and VMware announce a cloud services partnership to offer VMware's cloud computing and remote work platform, which will allow enterprises to provide multi-cloud enterprise tools and focus on sectors such as banking, financial services, and insurance (BFSI), healthcare, and consumer and retail services.
9. What pricing options are available for accessing the report?
Pricing options include single-user, multi-user, and enterprise licenses priced at USD 4750, USD 5250, and USD 8750 respectively.
10. Is the market size provided in terms of value or volume?
The market size is provided in terms of value, measured in Million and volume, measured in K Unit.
11. Are there any specific market keywords associated with the report?
Yes, the market keyword associated with the report is "Managed MPLS Services Industry," which aids in identifying and referencing the specific market segment covered.
12. How do I determine which pricing option suits my needs best?
The pricing options vary based on user requirements and access needs. Individual users may opt for single-user licenses, while businesses requiring broader access may choose multi-user or enterprise licenses for cost-effective access to the report.
13. Are there any additional resources or data provided in the Managed MPLS Services Industry report?
While the report offers comprehensive insights, it's advisable to review the specific contents or supplementary materials provided to ascertain if additional resources or data are available.
14. How can I stay updated on further developments or reports in the Managed MPLS Services Industry?
To stay informed about further developments, trends, and reports in the Managed MPLS Services Industry, consider subscribing to industry newsletters, following relevant companies and organizations, or regularly checking reputable industry news sources and publications.
Methodology
Step 1 - Identification of Relevant Samples Size from Population Database


Step 2 - Approaches for Defining Global Market Size (Value, Volume* & Price*)

Note*: In applicable scenarios
Step 3 - Data Sources
Primary Research
- Web Analytics
- Survey Reports
- Research Institute
- Latest Research Reports
- Opinion Leaders
Secondary Research
- Annual Reports
- White Paper
- Latest Press Release
- Industry Association
- Paid Database
- Investor Presentations

Step 4 - Data Triangulation
Involves using different sources of information in order to increase the validity of a study
These sources are likely to be stakeholders in a program - participants, other researchers, program staff, other community members, and so on.
Then we put all data in single framework & apply various statistical tools to find out the dynamic on the market.
During the analysis stage, feedback from the stakeholder groups would be compared to determine areas of agreement as well as areas of divergence


