Key Insights
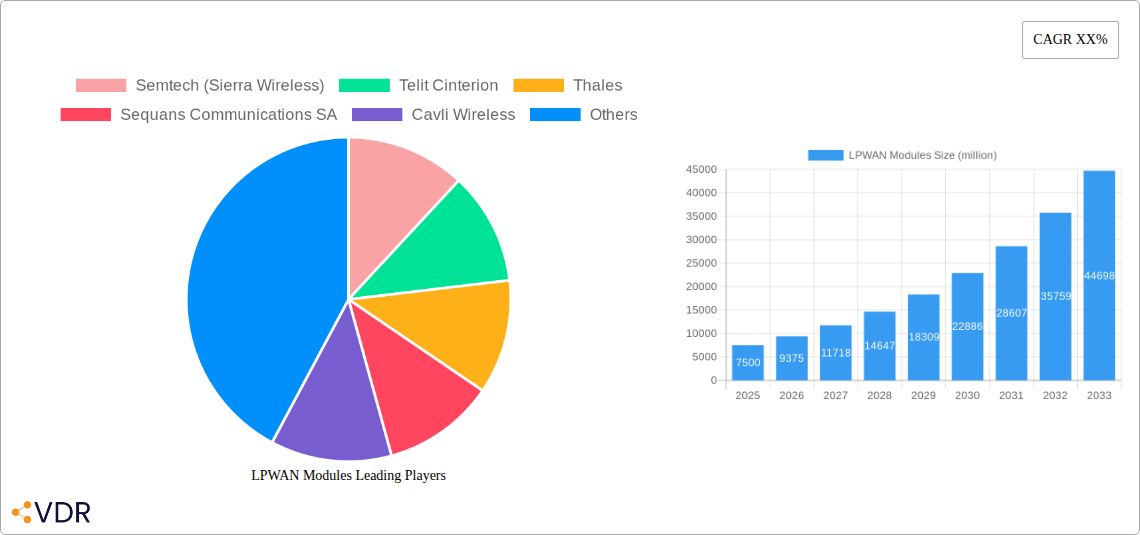
The Low-Power Wide-Area Network (LPWAN) Modules market is poised for significant expansion, projected to reach an estimated market size of approximately $7,500 million by 2025, with a robust Compound Annual Growth Rate (CAGR) of around 25%. This impressive growth trajectory is primarily fueled by the accelerating adoption of IoT technologies across diverse sectors. Key drivers include the escalating demand for smart meters in utilities, the burgeoning smart home ecosystem, the proliferation of wearable devices and trackers for personal and industrial use, and the transformative potential of smart agriculture and smart healthcare solutions. These applications benefit immensely from LPWAN's inherent advantages of low power consumption, extended range, and cost-effectiveness, enabling seamless connectivity for a vast number of devices. The market is witnessing a clear trend towards increased adoption of cellular LPWAN technologies like NB-IoT and LTE-M, owing to their superior performance, reliability, and integration capabilities with existing cellular infrastructure. However, the market also faces certain restraints, including the ongoing development and standardization of certain LPWAN protocols, and the need for enhanced security measures to protect sensitive data transmitted over these networks.
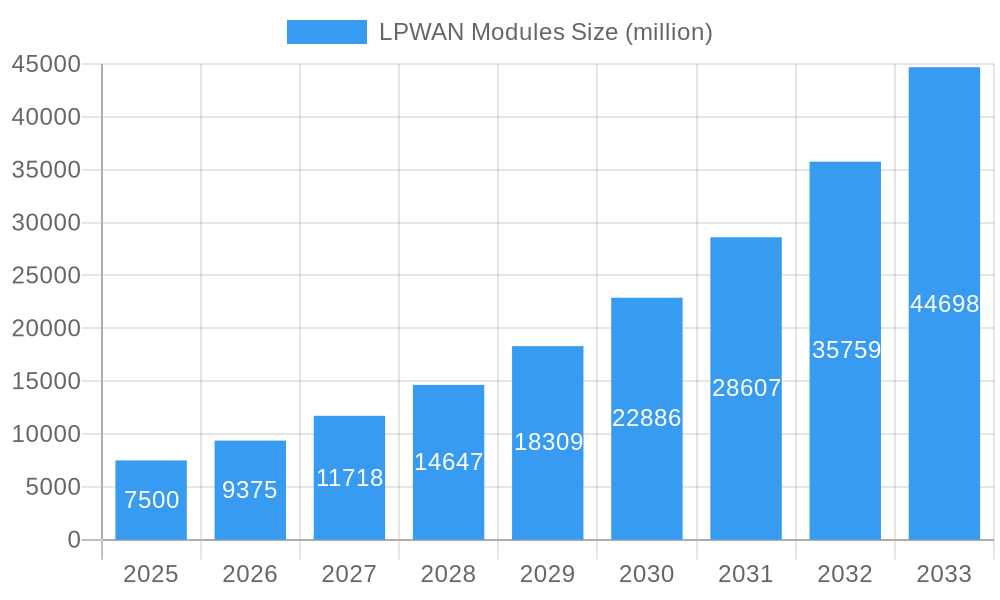
LPWAN Modules Market Size (In Billion)
The competitive landscape is dynamic, with established players like Semtech (Sierra Wireless), Telit Cinterion, Thales, and Quectel Wireless Solutions vying for market share alongside emerging innovators. These companies are continuously investing in research and development to introduce more advanced and versatile LPWAN modules. The market is segmented into applications such as Smart Meter, Smart Home, Wearable Device/tracker, Smart Agriculture, and Smart Healthcare, each contributing to the overall market expansion at varying paces. Geographically, Asia Pacific, led by China and India, is anticipated to emerge as the dominant region, driven by rapid industrialization and a burgeoning IoT market. North America and Europe also represent significant markets, with strong adoption in smart utility and smart city initiatives. The forecast period from 2025 to 2033 indicates sustained growth, solidifying LPWAN modules as a critical component in the global IoT infrastructure.
LPWAN Modules Company Market Share
Comprehensive Report: LPWAN Modules Market Analysis 2024-2033
This in-depth report provides a detailed analysis of the global LPWAN (Low-Power Wide-Area Network) modules market, exploring its dynamics, growth trajectories, regional dominance, product landscape, and key players. Leveraging extensive research and proprietary data, this report offers critical insights for stakeholders looking to capitalize on the burgeoning LPWAN ecosystem.
LPWAN Modules Market Dynamics & Structure
The LPWAN modules market is characterized by a dynamic interplay of technological innovation, evolving regulatory frameworks, and intensifying competition. Market concentration varies across different LPWAN technologies, with cellular LPWAN, such as LTE-M and NB-IoT, exhibiting a more consolidated structure dominated by major module manufacturers. Non-cellular LPWAN technologies like LoRaWAN and Sigfox present a more fragmented landscape, fostering a diverse ecosystem of hardware providers and network operators. Technological innovation is a primary driver, with continuous advancements in module miniaturization, power efficiency, and data processing capabilities. The increasing demand for low-cost, low-power connectivity solutions for the Internet of Things (IoT) fuels this innovation. Regulatory bodies play a crucial role in shaping market access and technology adoption through spectrum allocation and standardization efforts. Competitive product substitutes, while present, are largely differentiated by specific use case requirements, power consumption, and network coverage. End-user demographics are expanding rapidly, driven by adoption across various industries, from utilities and logistics to consumer electronics and smart cities. Mergers and acquisitions (M&A) are a notable trend, as larger players seek to expand their portfolios, acquire technological expertise, and consolidate market share. For instance, recent M&A activities have seen an estimated 3 significant deals in the past two years, with an estimated aggregate value of $XXX million. The barriers to entry are moderate, with established players benefiting from strong R&D capabilities and established supply chains. However, emerging companies can carve a niche by focusing on specific regional markets or highly specialized applications.
- Market Concentration: Cellular LPWAN is moderately concentrated, while Non-cellular LPWAN is highly fragmented.
- Technological Innovation Drivers: Miniaturization, power efficiency, enhanced security, and integrated software.
- Regulatory Frameworks: Spectrum availability, IoT device certification, and data privacy regulations.
- Competitive Product Substitutes: Wi-Fi, Bluetooth (for short-range), and other cellular technologies (for higher bandwidth needs).
- End-User Demographics: Industrial IoT, smart cities, agriculture, healthcare, smart home, and wearables.
- M&A Trends: Consolidation of market share, acquisition of specialized IP, and vertical integration.
LPWAN Modules Growth Trends & Insights
The LPWAN modules market is poised for substantial growth, driven by the exponential expansion of the Internet of Things (IoT) across diverse applications. The market size is projected to grow from an estimated $3,500 million in 2025 to $9,800 million by 2033, exhibiting a Compound Annual Growth Rate (CAGR) of 13.8% during the forecast period. This impressive growth is underpinned by increasing adoption rates in sectors such as smart metering, smart agriculture, and asset tracking. Technological disruptions, including advancements in narrowband IoT (NB-IoT) and LTE-M technologies, are enhancing the performance and reducing the cost of LPWAN modules, making them more accessible for a wider range of applications. Consumer behavior shifts are also contributing, with a growing demand for connected devices that offer convenience, efficiency, and enhanced functionality in areas like smart homes and wearable health trackers. The market penetration of LPWAN modules is expected to surge as more businesses and consumers embrace IoT solutions. The increasing deployment of 5G infrastructure, while not directly an LPWAN technology, creates a conducive environment for IoT growth, often leveraging LPWAN for specific low-power, wide-area use cases. Furthermore, the development of low-cost, energy-efficient sensors and actuators, coupled with declining module prices, is significantly accelerating adoption. The trend towards edge computing, where data is processed closer to the source, also favors LPWAN modules for their ability to efficiently transmit small packets of data. The report forecasts that the adoption rate for smart agriculture applications alone will see a CAGR of 15.2% over the forecast period, highlighting the significant market potential. The estimated market size for LPWAN modules in 2025 is $3,500 million, with a projected increase to $9,800 million by 2033. The historical period from 2019-2024 witnessed a CAGR of 12.5%, setting a strong foundation for future expansion.
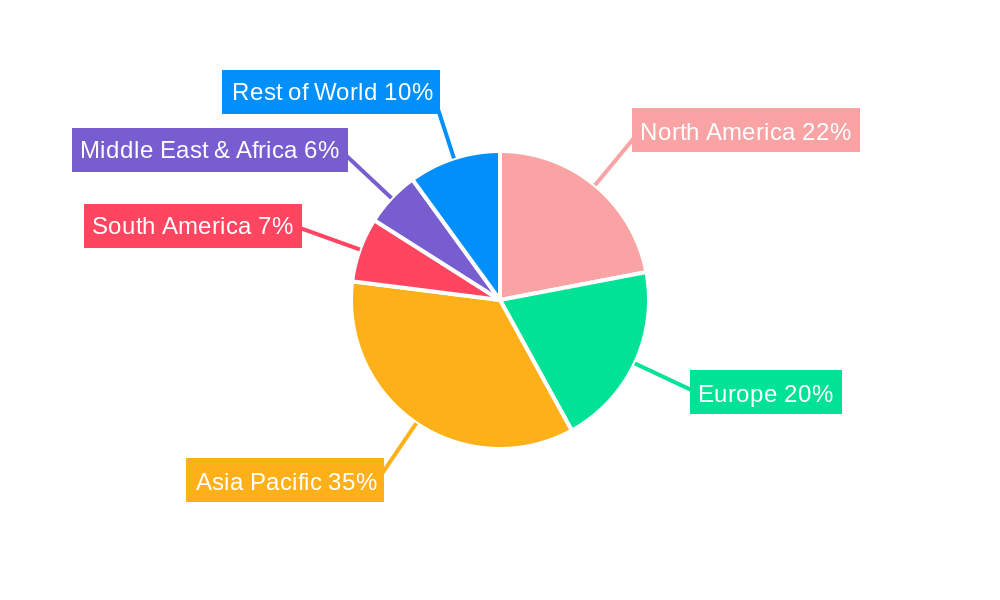
Dominant Regions, Countries, or Segments in LPWAN Modules
The Asia Pacific region is emerging as a dominant force in the LPWAN modules market, driven by rapid industrialization, a burgeoning manufacturing sector, and significant government initiatives promoting smart city development and digital transformation. China, in particular, is a key contributor, with a robust domestic demand for LPWAN solutions across various applications, supported by its extensive telecommunications infrastructure and strong ecosystem of module manufacturers. The country's aggressive deployment of IoT technologies in smart grids, logistics, and smart agriculture positions it at the forefront of market growth. North America and Europe also represent significant markets, fueled by established IoT adoption in smart utilities, intelligent transportation systems, and the growing demand for connected consumer devices. The dominance of certain segments is clearly visible. In terms of applications, Smart Metering is a leading segment, driven by global efforts towards energy efficiency, grid modernization, and the increasing implementation of smart grids. The demand for remote monitoring and control of utilities creates a sustained need for reliable and low-power connectivity solutions offered by LPWAN modules. Smart Home applications are also experiencing substantial growth, with consumers increasingly adopting connected devices for convenience, security, and energy management. The proliferation of smart speakers, thermostats, and security systems underscores the potential of this segment. From a technology perspective, Cellular LPWAN Type is expected to lead the market. Technologies like NB-IoT and LTE-M offer a compelling combination of wide-area coverage, enhanced security, and managed services, making them ideal for enterprise-grade IoT deployments. The established infrastructure of cellular networks provides a significant advantage for these technologies, enabling faster deployment and scalability. The forecast period anticipates the cellular LPWAN segment to hold a market share of over 65% by 2033.
- Dominant Region: Asia Pacific, primarily driven by China's industrial growth and IoT initiatives.
- Key Country Drivers: China (smart cities, manufacturing), North America (smart utilities, intelligent transport), Europe (industrial IoT, smart homes).
- Dominant Application Segment: Smart Metering, due to grid modernization and energy efficiency mandates.
- Driving Factors for Smart Metering: Remote monitoring, automated billing, fault detection, and reduced operational costs.
- Emerging Application Segment: Smart Healthcare, driven by remote patient monitoring and connected medical devices.
- Dominant Technology Type: Cellular LPWAN Type (NB-IoT, LTE-M) due to robust infrastructure and managed services.
- Growth Potential for Cellular LPWAN: Enhanced network capabilities, improved security features, and wider carrier support.
LPWAN Modules Product Landscape
The LPWAN modules product landscape is characterized by rapid innovation, focusing on enhanced performance, reduced power consumption, and increased integration. Manufacturers are developing compact, highly integrated modules that incorporate advanced security features, on-chip processing capabilities, and seamless connectivity across multiple LPWAN technologies. Key product advancements include modules with extended temperature ranges for industrial applications, low-power modes for battery-operated devices, and support for Over-The-Air (OTA) firmware updates. For instance, new product releases often boast a 30% reduction in power consumption compared to previous generations, enabling longer battery life for remote sensors. Furthermore, the integration of GNSS (Global Navigation Satellite System) capabilities within LPWAN modules is opening new avenues for asset tracking and logistics applications. The development of modules with embedded AI capabilities is also on the horizon, allowing for more intelligent data processing at the edge. The unique selling propositions of leading products often lie in their superior reliability, extended range, and comprehensive developer support, catering to diverse industry needs.
Key Drivers, Barriers & Challenges in LPWAN Modules
Key Drivers: The LPWAN modules market is propelled by several key drivers. The accelerating adoption of the Internet of Things (IoT) across industries, from smart agriculture and smart cities to industrial automation and healthcare, is the primary catalyst. The increasing demand for low-cost, low-power, and wide-area connectivity solutions for devices that require long battery life and infrequent data transmission is a significant factor. Government initiatives promoting digital transformation, smart infrastructure development, and energy efficiency further bolster market growth. Technological advancements in LPWAN technologies like NB-IoT and LTE-M, offering improved performance and reduced module costs, also act as strong drivers.
Barriers & Challenges: Despite the promising growth, the LPWAN modules market faces several barriers and challenges. The ongoing complexity in standardization and interoperability across different LPWAN technologies can create fragmentation and hinder widespread adoption. Regulatory hurdles related to spectrum allocation and device certification in various regions can lead to delays in market entry. Supply chain disruptions, exacerbated by global semiconductor shortages and geopolitical factors, continue to pose a challenge to manufacturers, impacting production and delivery timelines. The limited bandwidth of LPWAN technologies for high-data-rate applications may also present a constraint for certain use cases. The competitive pressure among module manufacturers, leading to price erosion, can impact profitability.
Emerging Opportunities in LPWAN Modules
Emerging opportunities in the LPWAN modules market are vast and continue to expand. The growing demand for intelligent asset tracking and logistics solutions, especially in the supply chain management sector, presents a significant avenue. The increasing adoption of LPWAN for remote patient monitoring and connected healthcare devices, driven by the need for efficient and accessible healthcare services, is another promising area. Furthermore, the development of smart city infrastructure, including smart waste management, intelligent street lighting, and environmental monitoring, offers substantial growth potential. Untapped markets in developing regions are also emerging as connectivity infrastructure improves. The evolution of edge computing and the need for localized data processing will drive the development of more sophisticated LPWAN modules with embedded intelligence.
Growth Accelerators in the LPWAN Modules Industry
Several factors are accelerating the growth of the LPWAN modules industry. Technological breakthroughs in chip design, leading to smaller, more power-efficient, and cost-effective modules, are a key accelerator. Strategic partnerships between module manufacturers, network operators, and cloud service providers are creating integrated solutions and simplifying deployment for end-users. The increasing availability of ready-to-deploy IoT platforms and development kits is lowering the barrier to entry for businesses looking to leverage LPWAN technology. Market expansion strategies by key players into new geographic regions and vertical markets are also contributing to accelerated growth. The development of robust security protocols and certifications for LPWAN devices is building trust and encouraging wider adoption.
Key Players Shaping the LPWAN Modules Market
- Semtech (Sierra Wireless)
- Telit Cinterion
- Thales
- Sequans Communications SA
- Cavli Wireless
- Murata
- Quectel Wireless Solutions
- SIMCom Wireless Solutions (Sunsea AIoT Technology)
- Sony
- SJI CO.,LTD.
- TOPPAN Inc.
- Fibocom Wirelessinc
- MeiG Smart Technology
Notable Milestones in LPWAN Modules Sector
- 2019: Significant advancements in NB-IoT chipset integration, leading to smaller and more power-efficient modules.
- 2020: Increased adoption of LTE-M for critical IoT applications requiring higher data rates and lower latency.
- 2021: Growth in the development of hybrid LPWAN modules offering support for multiple protocols.
- 2022: Launch of enhanced security features and certifications for LPWAN modules, addressing growing cybersecurity concerns.
- 2023: Expansion of LoRaWAN network deployments and growing interest in its suitability for private and localized IoT networks.
- 2024: Increased focus on AI integration within LPWAN modules for edge intelligence and predictive analytics.
In-Depth LPWAN Modules Market Outlook
The LPWAN modules market is projected for sustained and robust growth, driven by the relentless expansion of the IoT. Future market potential is immense, fueled by the increasing need for ubiquitous, low-power connectivity in sectors ranging from industrial automation and smart cities to healthcare and consumer electronics. Strategic opportunities lie in developing highly specialized modules for niche applications, enhancing edge computing capabilities within modules, and forging deeper collaborations across the IoT value chain. The market is expected to witness further consolidation as key players seek to expand their global reach and technological portfolios. The increasing maturity of LPWAN technologies, coupled with declining costs, will make them an indispensable component of the connected future.
LPWAN Modules Segmentation
-
1. Application
- 1.1. Smart Meter
- 1.2. Smart Home
- 1.3. Wearable Device/tracker
- 1.4. Smart Agriculture
- 1.5. Smart Healthcare
- 1.6. Others
-
2. Types
- 2.1. Cellular LPWAN Type
- 2.2. Non-cellular LPWAN Type
LPWAN Modules Segmentation By Geography
-
1. North America
- 1.1. United States
- 1.2. Canada
- 1.3. Mexico
-
2. South America
- 2.1. Brazil
- 2.2. Argentina
- 2.3. Rest of South America
-
3. Europe
- 3.1. United Kingdom
- 3.2. Germany
- 3.3. France
- 3.4. Italy
- 3.5. Spain
- 3.6. Russia
- 3.7. Benelux
- 3.8. Nordics
- 3.9. Rest of Europe
-
4. Middle East & Africa
- 4.1. Turkey
- 4.2. Israel
- 4.3. GCC
- 4.4. North Africa
- 4.5. South Africa
- 4.6. Rest of Middle East & Africa
-
5. Asia Pacific
- 5.1. China
- 5.2. India
- 5.3. Japan
- 5.4. South Korea
- 5.5. ASEAN
- 5.6. Oceania
- 5.7. Rest of Asia Pacific
LPWAN Modules Regional Market Share
Geographic Coverage of LPWAN Modules
LPWAN Modules REPORT HIGHLIGHTS
| Aspects | Details |
|---|---|
| Study Period | 2020-2034 |
| Base Year | 2025 |
| Estimated Year | 2026 |
| Forecast Period | 2026-2034 |
| Historical Period | 2020-2025 |
| Growth Rate | CAGR of 38.7% from 2020-2034 |
| Segmentation |
|
Table of Contents
- 1. Introduction
- 1.1. Research Scope
- 1.2. Market Segmentation
- 1.3. Research Objective
- 1.4. Definitions and Assumptions
- 2. Executive Summary
- 2.1. Market Snapshot
- 3. Market Dynamics
- 3.1. Market Drivers
- 3.2. Market Restrains
- 3.3. Market Trends
- 3.4. Market Opportunities
- 4. Market Factor Analysis
- 4.1. Porters Five Forces
- 4.1.1. Bargaining Power of Suppliers
- 4.1.2. Bargaining Power of Buyers
- 4.1.3. Threat of New Entrants
- 4.1.4. Threat of Substitutes
- 4.1.5. Competitive Rivalry
- 4.2. PESTEL analysis
- 4.3. BCG Analysis
- 4.3.1. Stars (High Growth, High Market Share)
- 4.3.2. Cash Cows (Low Growth, High Market Share)
- 4.3.3. Question Mark (High Growth, Low Market Share)
- 4.3.4. Dogs (Low Growth, Low Market Share)
- 4.4. Ansoff Matrix Analysis
- 4.5. Supply Chain Analysis
- 4.6. Regulatory Landscape
- 4.7. Current Market Potential and Opportunity Assessment (TAM–SAM–SOM Framework)
- 4.8. VDR Analyst Note
- 4.1. Porters Five Forces
- 5. Market Analysis, Insights and Forecast 2021-2033
- 5.1. Market Analysis, Insights and Forecast - by Application
- 5.1.1. Smart Meter
- 5.1.2. Smart Home
- 5.1.3. Wearable Device/tracker
- 5.1.4. Smart Agriculture
- 5.1.5. Smart Healthcare
- 5.1.6. Others
- 5.2. Market Analysis, Insights and Forecast - by Types
- 5.2.1. Cellular LPWAN Type
- 5.2.2. Non-cellular LPWAN Type
- 5.3. Market Analysis, Insights and Forecast - by Region
- 5.3.1. North America
- 5.3.2. South America
- 5.3.3. Europe
- 5.3.4. Middle East & Africa
- 5.3.5. Asia Pacific
- 5.1. Market Analysis, Insights and Forecast - by Application
- 6. Global LPWAN Modules Analysis, Insights and Forecast, 2021-2033
- 6.1. Market Analysis, Insights and Forecast - by Application
- 6.1.1. Smart Meter
- 6.1.2. Smart Home
- 6.1.3. Wearable Device/tracker
- 6.1.4. Smart Agriculture
- 6.1.5. Smart Healthcare
- 6.1.6. Others
- 6.2. Market Analysis, Insights and Forecast - by Types
- 6.2.1. Cellular LPWAN Type
- 6.2.2. Non-cellular LPWAN Type
- 6.1. Market Analysis, Insights and Forecast - by Application
- 7. North America LPWAN Modules Analysis, Insights and Forecast, 2021-2033
- 7.1. Market Analysis, Insights and Forecast - by Application
- 7.1.1. Smart Meter
- 7.1.2. Smart Home
- 7.1.3. Wearable Device/tracker
- 7.1.4. Smart Agriculture
- 7.1.5. Smart Healthcare
- 7.1.6. Others
- 7.2. Market Analysis, Insights and Forecast - by Types
- 7.2.1. Cellular LPWAN Type
- 7.2.2. Non-cellular LPWAN Type
- 7.1. Market Analysis, Insights and Forecast - by Application
- 8. South America LPWAN Modules Analysis, Insights and Forecast, 2021-2033
- 8.1. Market Analysis, Insights and Forecast - by Application
- 8.1.1. Smart Meter
- 8.1.2. Smart Home
- 8.1.3. Wearable Device/tracker
- 8.1.4. Smart Agriculture
- 8.1.5. Smart Healthcare
- 8.1.6. Others
- 8.2. Market Analysis, Insights and Forecast - by Types
- 8.2.1. Cellular LPWAN Type
- 8.2.2. Non-cellular LPWAN Type
- 8.1. Market Analysis, Insights and Forecast - by Application
- 9. Europe LPWAN Modules Analysis, Insights and Forecast, 2021-2033
- 9.1. Market Analysis, Insights and Forecast - by Application
- 9.1.1. Smart Meter
- 9.1.2. Smart Home
- 9.1.3. Wearable Device/tracker
- 9.1.4. Smart Agriculture
- 9.1.5. Smart Healthcare
- 9.1.6. Others
- 9.2. Market Analysis, Insights and Forecast - by Types
- 9.2.1. Cellular LPWAN Type
- 9.2.2. Non-cellular LPWAN Type
- 9.1. Market Analysis, Insights and Forecast - by Application
- 10. Middle East & Africa LPWAN Modules Analysis, Insights and Forecast, 2021-2033
- 10.1. Market Analysis, Insights and Forecast - by Application
- 10.1.1. Smart Meter
- 10.1.2. Smart Home
- 10.1.3. Wearable Device/tracker
- 10.1.4. Smart Agriculture
- 10.1.5. Smart Healthcare
- 10.1.6. Others
- 10.2. Market Analysis, Insights and Forecast - by Types
- 10.2.1. Cellular LPWAN Type
- 10.2.2. Non-cellular LPWAN Type
- 10.1. Market Analysis, Insights and Forecast - by Application
- 11. Asia Pacific LPWAN Modules Analysis, Insights and Forecast, 2021-2033
- 11.1. Market Analysis, Insights and Forecast - by Application
- 11.1.1. Smart Meter
- 11.1.2. Smart Home
- 11.1.3. Wearable Device/tracker
- 11.1.4. Smart Agriculture
- 11.1.5. Smart Healthcare
- 11.1.6. Others
- 11.2. Market Analysis, Insights and Forecast - by Types
- 11.2.1. Cellular LPWAN Type
- 11.2.2. Non-cellular LPWAN Type
- 11.1. Market Analysis, Insights and Forecast - by Application
- 12. Competitive Analysis
- 12.1. Company Profiles
- 12.1.1 Semtech (Sierra Wireless)
- 12.1.1.1. Company Overview
- 12.1.1.2. Products
- 12.1.1.3. Company Financials
- 12.1.1.4. SWOT Analysis
- 12.1.2 Telit Cinterion
- 12.1.2.1. Company Overview
- 12.1.2.2. Products
- 12.1.2.3. Company Financials
- 12.1.2.4. SWOT Analysis
- 12.1.3 Thales
- 12.1.3.1. Company Overview
- 12.1.3.2. Products
- 12.1.3.3. Company Financials
- 12.1.3.4. SWOT Analysis
- 12.1.4 Sequans Communications SA
- 12.1.4.1. Company Overview
- 12.1.4.2. Products
- 12.1.4.3. Company Financials
- 12.1.4.4. SWOT Analysis
- 12.1.5 Cavli Wireless
- 12.1.5.1. Company Overview
- 12.1.5.2. Products
- 12.1.5.3. Company Financials
- 12.1.5.4. SWOT Analysis
- 12.1.6 Murata
- 12.1.6.1. Company Overview
- 12.1.6.2. Products
- 12.1.6.3. Company Financials
- 12.1.6.4. SWOT Analysis
- 12.1.7 Quectel Wireless Solutions
- 12.1.7.1. Company Overview
- 12.1.7.2. Products
- 12.1.7.3. Company Financials
- 12.1.7.4. SWOT Analysis
- 12.1.8 SIMCom Wireless Solutions (Sunsea AIoT Technology)
- 12.1.8.1. Company Overview
- 12.1.8.2. Products
- 12.1.8.3. Company Financials
- 12.1.8.4. SWOT Analysis
- 12.1.9 Sony
- 12.1.9.1. Company Overview
- 12.1.9.2. Products
- 12.1.9.3. Company Financials
- 12.1.9.4. SWOT Analysis
- 12.1.10 SJI CO.
- 12.1.10.1. Company Overview
- 12.1.10.2. Products
- 12.1.10.3. Company Financials
- 12.1.10.4. SWOT Analysis
- 12.1.11 LTD.
- 12.1.11.1. Company Overview
- 12.1.11.2. Products
- 12.1.11.3. Company Financials
- 12.1.11.4. SWOT Analysis
- 12.1.12 TOPPAN Inc.
- 12.1.12.1. Company Overview
- 12.1.12.2. Products
- 12.1.12.3. Company Financials
- 12.1.12.4. SWOT Analysis
- 12.1.13 Fibocom Wirelessinc
- 12.1.13.1. Company Overview
- 12.1.13.2. Products
- 12.1.13.3. Company Financials
- 12.1.13.4. SWOT Analysis
- 12.1.14 MeiG Smart Technology
- 12.1.14.1. Company Overview
- 12.1.14.2. Products
- 12.1.14.3. Company Financials
- 12.1.14.4. SWOT Analysis
- 12.1.1 Semtech (Sierra Wireless)
- 12.2. Market Entropy
- 12.2.1 Company's Key Areas Served
- 12.2.2 Recent Developments
- 12.3. Company Market Share Analysis 2025
- 12.3.1 Top 5 Companies Market Share Analysis
- 12.3.2 Top 3 Companies Market Share Analysis
- 12.4. List of Potential Customers
- 13. Research Methodology
List of Figures
- Figure 1: Global LPWAN Modules Revenue Breakdown (undefined, %) by Region 2025 & 2033
- Figure 2: Global LPWAN Modules Volume Breakdown (K, %) by Region 2025 & 2033
- Figure 3: North America LPWAN Modules Revenue (undefined), by Application 2025 & 2033
- Figure 4: North America LPWAN Modules Volume (K), by Application 2025 & 2033
- Figure 5: North America LPWAN Modules Revenue Share (%), by Application 2025 & 2033
- Figure 6: North America LPWAN Modules Volume Share (%), by Application 2025 & 2033
- Figure 7: North America LPWAN Modules Revenue (undefined), by Types 2025 & 2033
- Figure 8: North America LPWAN Modules Volume (K), by Types 2025 & 2033
- Figure 9: North America LPWAN Modules Revenue Share (%), by Types 2025 & 2033
- Figure 10: North America LPWAN Modules Volume Share (%), by Types 2025 & 2033
- Figure 11: North America LPWAN Modules Revenue (undefined), by Country 2025 & 2033
- Figure 12: North America LPWAN Modules Volume (K), by Country 2025 & 2033
- Figure 13: North America LPWAN Modules Revenue Share (%), by Country 2025 & 2033
- Figure 14: North America LPWAN Modules Volume Share (%), by Country 2025 & 2033
- Figure 15: South America LPWAN Modules Revenue (undefined), by Application 2025 & 2033
- Figure 16: South America LPWAN Modules Volume (K), by Application 2025 & 2033
- Figure 17: South America LPWAN Modules Revenue Share (%), by Application 2025 & 2033
- Figure 18: South America LPWAN Modules Volume Share (%), by Application 2025 & 2033
- Figure 19: South America LPWAN Modules Revenue (undefined), by Types 2025 & 2033
- Figure 20: South America LPWAN Modules Volume (K), by Types 2025 & 2033
- Figure 21: South America LPWAN Modules Revenue Share (%), by Types 2025 & 2033
- Figure 22: South America LPWAN Modules Volume Share (%), by Types 2025 & 2033
- Figure 23: South America LPWAN Modules Revenue (undefined), by Country 2025 & 2033
- Figure 24: South America LPWAN Modules Volume (K), by Country 2025 & 2033
- Figure 25: South America LPWAN Modules Revenue Share (%), by Country 2025 & 2033
- Figure 26: South America LPWAN Modules Volume Share (%), by Country 2025 & 2033
- Figure 27: Europe LPWAN Modules Revenue (undefined), by Application 2025 & 2033
- Figure 28: Europe LPWAN Modules Volume (K), by Application 2025 & 2033
- Figure 29: Europe LPWAN Modules Revenue Share (%), by Application 2025 & 2033
- Figure 30: Europe LPWAN Modules Volume Share (%), by Application 2025 & 2033
- Figure 31: Europe LPWAN Modules Revenue (undefined), by Types 2025 & 2033
- Figure 32: Europe LPWAN Modules Volume (K), by Types 2025 & 2033
- Figure 33: Europe LPWAN Modules Revenue Share (%), by Types 2025 & 2033
- Figure 34: Europe LPWAN Modules Volume Share (%), by Types 2025 & 2033
- Figure 35: Europe LPWAN Modules Revenue (undefined), by Country 2025 & 2033
- Figure 36: Europe LPWAN Modules Volume (K), by Country 2025 & 2033
- Figure 37: Europe LPWAN Modules Revenue Share (%), by Country 2025 & 2033
- Figure 38: Europe LPWAN Modules Volume Share (%), by Country 2025 & 2033
- Figure 39: Middle East & Africa LPWAN Modules Revenue (undefined), by Application 2025 & 2033
- Figure 40: Middle East & Africa LPWAN Modules Volume (K), by Application 2025 & 2033
- Figure 41: Middle East & Africa LPWAN Modules Revenue Share (%), by Application 2025 & 2033
- Figure 42: Middle East & Africa LPWAN Modules Volume Share (%), by Application 2025 & 2033
- Figure 43: Middle East & Africa LPWAN Modules Revenue (undefined), by Types 2025 & 2033
- Figure 44: Middle East & Africa LPWAN Modules Volume (K), by Types 2025 & 2033
- Figure 45: Middle East & Africa LPWAN Modules Revenue Share (%), by Types 2025 & 2033
- Figure 46: Middle East & Africa LPWAN Modules Volume Share (%), by Types 2025 & 2033
- Figure 47: Middle East & Africa LPWAN Modules Revenue (undefined), by Country 2025 & 2033
- Figure 48: Middle East & Africa LPWAN Modules Volume (K), by Country 2025 & 2033
- Figure 49: Middle East & Africa LPWAN Modules Revenue Share (%), by Country 2025 & 2033
- Figure 50: Middle East & Africa LPWAN Modules Volume Share (%), by Country 2025 & 2033
- Figure 51: Asia Pacific LPWAN Modules Revenue (undefined), by Application 2025 & 2033
- Figure 52: Asia Pacific LPWAN Modules Volume (K), by Application 2025 & 2033
- Figure 53: Asia Pacific LPWAN Modules Revenue Share (%), by Application 2025 & 2033
- Figure 54: Asia Pacific LPWAN Modules Volume Share (%), by Application 2025 & 2033
- Figure 55: Asia Pacific LPWAN Modules Revenue (undefined), by Types 2025 & 2033
- Figure 56: Asia Pacific LPWAN Modules Volume (K), by Types 2025 & 2033
- Figure 57: Asia Pacific LPWAN Modules Revenue Share (%), by Types 2025 & 2033
- Figure 58: Asia Pacific LPWAN Modules Volume Share (%), by Types 2025 & 2033
- Figure 59: Asia Pacific LPWAN Modules Revenue (undefined), by Country 2025 & 2033
- Figure 60: Asia Pacific LPWAN Modules Volume (K), by Country 2025 & 2033
- Figure 61: Asia Pacific LPWAN Modules Revenue Share (%), by Country 2025 & 2033
- Figure 62: Asia Pacific LPWAN Modules Volume Share (%), by Country 2025 & 2033
List of Tables
- Table 1: Global LPWAN Modules Revenue undefined Forecast, by Application 2020 & 2033
- Table 2: Global LPWAN Modules Volume K Forecast, by Application 2020 & 2033
- Table 3: Global LPWAN Modules Revenue undefined Forecast, by Types 2020 & 2033
- Table 4: Global LPWAN Modules Volume K Forecast, by Types 2020 & 2033
- Table 5: Global LPWAN Modules Revenue undefined Forecast, by Region 2020 & 2033
- Table 6: Global LPWAN Modules Volume K Forecast, by Region 2020 & 2033
- Table 7: Global LPWAN Modules Revenue undefined Forecast, by Application 2020 & 2033
- Table 8: Global LPWAN Modules Volume K Forecast, by Application 2020 & 2033
- Table 9: Global LPWAN Modules Revenue undefined Forecast, by Types 2020 & 2033
- Table 10: Global LPWAN Modules Volume K Forecast, by Types 2020 & 2033
- Table 11: Global LPWAN Modules Revenue undefined Forecast, by Country 2020 & 2033
- Table 12: Global LPWAN Modules Volume K Forecast, by Country 2020 & 2033
- Table 13: United States LPWAN Modules Revenue (undefined) Forecast, by Application 2020 & 2033
- Table 14: United States LPWAN Modules Volume (K) Forecast, by Application 2020 & 2033
- Table 15: Canada LPWAN Modules Revenue (undefined) Forecast, by Application 2020 & 2033
- Table 16: Canada LPWAN Modules Volume (K) Forecast, by Application 2020 & 2033
- Table 17: Mexico LPWAN Modules Revenue (undefined) Forecast, by Application 2020 & 2033
- Table 18: Mexico LPWAN Modules Volume (K) Forecast, by Application 2020 & 2033
- Table 19: Global LPWAN Modules Revenue undefined Forecast, by Application 2020 & 2033
- Table 20: Global LPWAN Modules Volume K Forecast, by Application 2020 & 2033
- Table 21: Global LPWAN Modules Revenue undefined Forecast, by Types 2020 & 2033
- Table 22: Global LPWAN Modules Volume K Forecast, by Types 2020 & 2033
- Table 23: Global LPWAN Modules Revenue undefined Forecast, by Country 2020 & 2033
- Table 24: Global LPWAN Modules Volume K Forecast, by Country 2020 & 2033
- Table 25: Brazil LPWAN Modules Revenue (undefined) Forecast, by Application 2020 & 2033
- Table 26: Brazil LPWAN Modules Volume (K) Forecast, by Application 2020 & 2033
- Table 27: Argentina LPWAN Modules Revenue (undefined) Forecast, by Application 2020 & 2033
- Table 28: Argentina LPWAN Modules Volume (K) Forecast, by Application 2020 & 2033
- Table 29: Rest of South America LPWAN Modules Revenue (undefined) Forecast, by Application 2020 & 2033
- Table 30: Rest of South America LPWAN Modules Volume (K) Forecast, by Application 2020 & 2033
- Table 31: Global LPWAN Modules Revenue undefined Forecast, by Application 2020 & 2033
- Table 32: Global LPWAN Modules Volume K Forecast, by Application 2020 & 2033
- Table 33: Global LPWAN Modules Revenue undefined Forecast, by Types 2020 & 2033
- Table 34: Global LPWAN Modules Volume K Forecast, by Types 2020 & 2033
- Table 35: Global LPWAN Modules Revenue undefined Forecast, by Country 2020 & 2033
- Table 36: Global LPWAN Modules Volume K Forecast, by Country 2020 & 2033
- Table 37: United Kingdom LPWAN Modules Revenue (undefined) Forecast, by Application 2020 & 2033
- Table 38: United Kingdom LPWAN Modules Volume (K) Forecast, by Application 2020 & 2033
- Table 39: Germany LPWAN Modules Revenue (undefined) Forecast, by Application 2020 & 2033
- Table 40: Germany LPWAN Modules Volume (K) Forecast, by Application 2020 & 2033
- Table 41: France LPWAN Modules Revenue (undefined) Forecast, by Application 2020 & 2033
- Table 42: France LPWAN Modules Volume (K) Forecast, by Application 2020 & 2033
- Table 43: Italy LPWAN Modules Revenue (undefined) Forecast, by Application 2020 & 2033
- Table 44: Italy LPWAN Modules Volume (K) Forecast, by Application 2020 & 2033
- Table 45: Spain LPWAN Modules Revenue (undefined) Forecast, by Application 2020 & 2033
- Table 46: Spain LPWAN Modules Volume (K) Forecast, by Application 2020 & 2033
- Table 47: Russia LPWAN Modules Revenue (undefined) Forecast, by Application 2020 & 2033
- Table 48: Russia LPWAN Modules Volume (K) Forecast, by Application 2020 & 2033
- Table 49: Benelux LPWAN Modules Revenue (undefined) Forecast, by Application 2020 & 2033
- Table 50: Benelux LPWAN Modules Volume (K) Forecast, by Application 2020 & 2033
- Table 51: Nordics LPWAN Modules Revenue (undefined) Forecast, by Application 2020 & 2033
- Table 52: Nordics LPWAN Modules Volume (K) Forecast, by Application 2020 & 2033
- Table 53: Rest of Europe LPWAN Modules Revenue (undefined) Forecast, by Application 2020 & 2033
- Table 54: Rest of Europe LPWAN Modules Volume (K) Forecast, by Application 2020 & 2033
- Table 55: Global LPWAN Modules Revenue undefined Forecast, by Application 2020 & 2033
- Table 56: Global LPWAN Modules Volume K Forecast, by Application 2020 & 2033
- Table 57: Global LPWAN Modules Revenue undefined Forecast, by Types 2020 & 2033
- Table 58: Global LPWAN Modules Volume K Forecast, by Types 2020 & 2033
- Table 59: Global LPWAN Modules Revenue undefined Forecast, by Country 2020 & 2033
- Table 60: Global LPWAN Modules Volume K Forecast, by Country 2020 & 2033
- Table 61: Turkey LPWAN Modules Revenue (undefined) Forecast, by Application 2020 & 2033
- Table 62: Turkey LPWAN Modules Volume (K) Forecast, by Application 2020 & 2033
- Table 63: Israel LPWAN Modules Revenue (undefined) Forecast, by Application 2020 & 2033
- Table 64: Israel LPWAN Modules Volume (K) Forecast, by Application 2020 & 2033
- Table 65: GCC LPWAN Modules Revenue (undefined) Forecast, by Application 2020 & 2033
- Table 66: GCC LPWAN Modules Volume (K) Forecast, by Application 2020 & 2033
- Table 67: North Africa LPWAN Modules Revenue (undefined) Forecast, by Application 2020 & 2033
- Table 68: North Africa LPWAN Modules Volume (K) Forecast, by Application 2020 & 2033
- Table 69: South Africa LPWAN Modules Revenue (undefined) Forecast, by Application 2020 & 2033
- Table 70: South Africa LPWAN Modules Volume (K) Forecast, by Application 2020 & 2033
- Table 71: Rest of Middle East & Africa LPWAN Modules Revenue (undefined) Forecast, by Application 2020 & 2033
- Table 72: Rest of Middle East & Africa LPWAN Modules Volume (K) Forecast, by Application 2020 & 2033
- Table 73: Global LPWAN Modules Revenue undefined Forecast, by Application 2020 & 2033
- Table 74: Global LPWAN Modules Volume K Forecast, by Application 2020 & 2033
- Table 75: Global LPWAN Modules Revenue undefined Forecast, by Types 2020 & 2033
- Table 76: Global LPWAN Modules Volume K Forecast, by Types 2020 & 2033
- Table 77: Global LPWAN Modules Revenue undefined Forecast, by Country 2020 & 2033
- Table 78: Global LPWAN Modules Volume K Forecast, by Country 2020 & 2033
- Table 79: China LPWAN Modules Revenue (undefined) Forecast, by Application 2020 & 2033
- Table 80: China LPWAN Modules Volume (K) Forecast, by Application 2020 & 2033
- Table 81: India LPWAN Modules Revenue (undefined) Forecast, by Application 2020 & 2033
- Table 82: India LPWAN Modules Volume (K) Forecast, by Application 2020 & 2033
- Table 83: Japan LPWAN Modules Revenue (undefined) Forecast, by Application 2020 & 2033
- Table 84: Japan LPWAN Modules Volume (K) Forecast, by Application 2020 & 2033
- Table 85: South Korea LPWAN Modules Revenue (undefined) Forecast, by Application 2020 & 2033
- Table 86: South Korea LPWAN Modules Volume (K) Forecast, by Application 2020 & 2033
- Table 87: ASEAN LPWAN Modules Revenue (undefined) Forecast, by Application 2020 & 2033
- Table 88: ASEAN LPWAN Modules Volume (K) Forecast, by Application 2020 & 2033
- Table 89: Oceania LPWAN Modules Revenue (undefined) Forecast, by Application 2020 & 2033
- Table 90: Oceania LPWAN Modules Volume (K) Forecast, by Application 2020 & 2033
- Table 91: Rest of Asia Pacific LPWAN Modules Revenue (undefined) Forecast, by Application 2020 & 2033
- Table 92: Rest of Asia Pacific LPWAN Modules Volume (K) Forecast, by Application 2020 & 2033
Frequently Asked Questions
1. What is the projected Compound Annual Growth Rate (CAGR) of the LPWAN Modules?
The projected CAGR is approximately 38.7%.
2. Which companies are prominent players in the LPWAN Modules?
Key companies in the market include Semtech (Sierra Wireless), Telit Cinterion, Thales, Sequans Communications SA, Cavli Wireless, Murata, Quectel Wireless Solutions, SIMCom Wireless Solutions (Sunsea AIoT Technology), Sony, SJI CO., LTD., TOPPAN Inc., Fibocom Wirelessinc, MeiG Smart Technology.
3. What are the main segments of the LPWAN Modules?
The market segments include Application, Types.
4. Can you provide details about the market size?
The market size is estimated to be USD XXX N/A as of 2022.
5. What are some drivers contributing to market growth?
N/A
6. What are the notable trends driving market growth?
N/A
7. Are there any restraints impacting market growth?
N/A
8. Can you provide examples of recent developments in the market?
N/A
9. What pricing options are available for accessing the report?
Pricing options include single-user, multi-user, and enterprise licenses priced at USD 3950.00, USD 5925.00, and USD 7900.00 respectively.
10. Is the market size provided in terms of value or volume?
The market size is provided in terms of value, measured in N/A and volume, measured in K.
11. Are there any specific market keywords associated with the report?
Yes, the market keyword associated with the report is "LPWAN Modules," which aids in identifying and referencing the specific market segment covered.
12. How do I determine which pricing option suits my needs best?
The pricing options vary based on user requirements and access needs. Individual users may opt for single-user licenses, while businesses requiring broader access may choose multi-user or enterprise licenses for cost-effective access to the report.
13. Are there any additional resources or data provided in the LPWAN Modules report?
While the report offers comprehensive insights, it's advisable to review the specific contents or supplementary materials provided to ascertain if additional resources or data are available.
14. How can I stay updated on further developments or reports in the LPWAN Modules?
To stay informed about further developments, trends, and reports in the LPWAN Modules, consider subscribing to industry newsletters, following relevant companies and organizations, or regularly checking reputable industry news sources and publications.
Methodology
Step 1 - Identification of Relevant Samples Size from Population Database


Step 2 - Approaches for Defining Global Market Size (Value, Volume* & Price*)

Note*: In applicable scenarios
Step 3 - Data Sources
Primary Research
- Web Analytics
- Survey Reports
- Research Institute
- Latest Research Reports
- Opinion Leaders
Secondary Research
- Annual Reports
- White Paper
- Latest Press Release
- Industry Association
- Paid Database
- Investor Presentations

Step 4 - Data Triangulation
Involves using different sources of information in order to increase the validity of a study
These sources are likely to be stakeholders in a program - participants, other researchers, program staff, other community members, and so on.
Then we put all data in single framework & apply various statistical tools to find out the dynamic on the market.
During the analysis stage, feedback from the stakeholder groups would be compared to determine areas of agreement as well as areas of divergence

