Key Insights
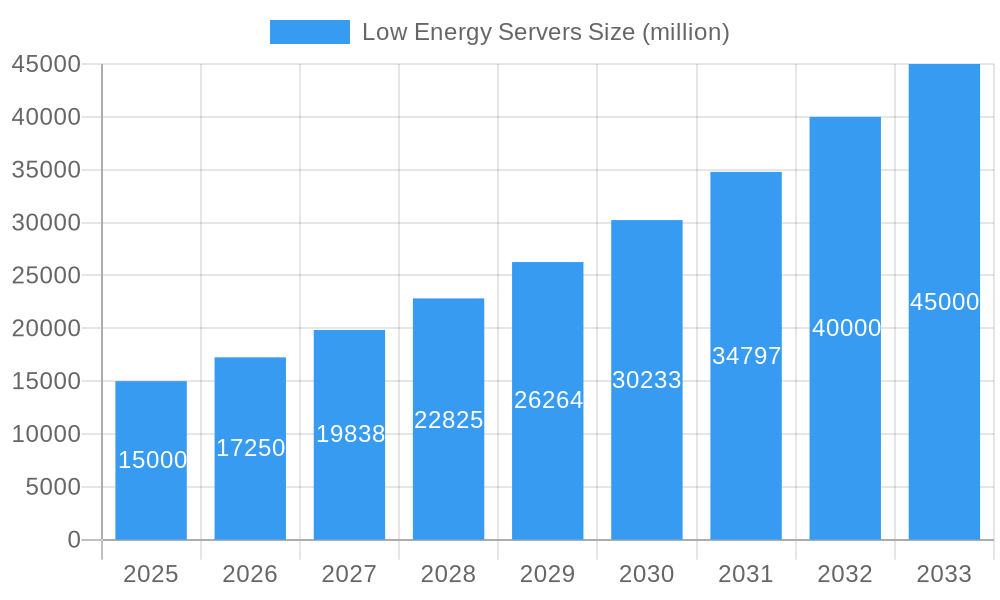
The low-energy server market is experiencing robust growth, driven by increasing demand for energy-efficient data centers and a heightened focus on sustainability within the IT sector. The market's compound annual growth rate (CAGR) is estimated at 15% between 2025 and 2033, projecting significant expansion from an estimated $15 billion market size in 2025 to approximately $45 billion by 2033. Key drivers include the rising adoption of cloud computing, edge computing, and the Internet of Things (IoT), all of which necessitate energy-optimized infrastructure to maintain operational efficiency and reduce carbon footprint. Furthermore, stringent government regulations aimed at reducing carbon emissions are further bolstering the adoption of low-energy servers. Major players like Dell, Hewlett Packard, Lenovo, and Super Micro are actively investing in research and development to enhance server energy efficiency, resulting in innovative cooling technologies and optimized hardware designs. Market segmentation includes variations in server type (rack, blade, tower), processing power, and storage capacity, catering to diverse customer needs and application requirements.
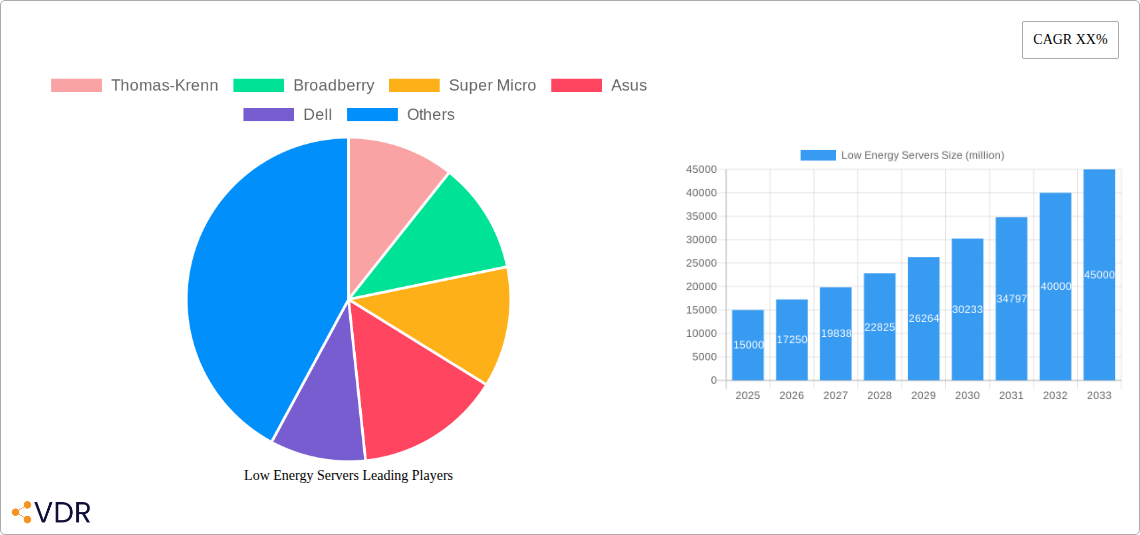
Low Energy Servers Market Size (In Billion)
However, the market faces certain restraints. The initial high cost of implementing low-energy server solutions can be a barrier to entry for some businesses, especially smaller enterprises. The complexity involved in transitioning to new, energy-efficient infrastructure can also be a challenge. Furthermore, the market’s growth is somewhat dependent on advancements in energy-efficient hardware components and the continued development of innovative cooling technologies. Despite these challenges, the long-term outlook for the low-energy server market remains positive, driven by a confluence of technological advancements, environmental concerns, and regulatory pressures. The market will likely witness continued innovation in areas like server virtualization, ARM-based processors, and improved power management systems.
Low Energy Servers Company Market Share
Low Energy Servers Market Report: 2019-2033
This comprehensive report provides an in-depth analysis of the low energy servers market, encompassing market dynamics, growth trends, regional segmentation, product landscape, key players, and future outlook. The study period covers 2019-2033, with 2025 as the base and estimated year. The report is essential for industry professionals, investors, and strategic decision-makers seeking to understand and capitalize on opportunities within this rapidly evolving sector. The parent market is the broader server market, while the child market focuses specifically on low-energy consumption server solutions.
Low Energy Servers Market Dynamics & Structure
The low-energy server market is characterized by increasing concentration among leading vendors, driven by technological advancements and economies of scale. Market concentration is estimated at xx% in 2025, with the top 5 players holding approximately xx% of the market share. Regulatory frameworks promoting energy efficiency, such as [mention specific regulations if available], are significant drivers. Competitive substitutes include virtualized servers and cloud computing solutions, however, the demand for on-premise solutions with lower energy footprints continues to drive growth. M&A activity within the sector is expected to remain moderate, with an estimated xx million deals during the forecast period (2025-2033), primarily focused on consolidating market share and expanding product portfolios. End-user demographics are primarily large enterprises and data centers seeking to reduce operational costs and carbon footprints.
- Market Concentration: xx% in 2025, top 5 players holding xx%
- M&A Activity (2025-2033): Estimated xx million deals
- Key Innovation Drivers: Energy-efficient processors, improved cooling systems, virtualization technologies.
- Innovation Barriers: High R&D costs, complexity of integrating new technologies.
- Regulatory Frameworks: [mention specific examples of regulations if available]
Low Energy Servers Growth Trends & Insights
The global low-energy server market is poised for substantial growth, driven by increasing data center deployments, rising energy costs, and growing environmental concerns. The market size reached xx million units in 2024 and is projected to reach xx million units by 2033, exhibiting a CAGR of xx% during the forecast period. This growth is fueled by rising adoption rates among cloud providers and enterprises seeking to optimize energy consumption and reduce their carbon footprint. Technological disruptions, such as the introduction of ARM-based servers and advancements in cooling technologies, are further accelerating market expansion. Consumer behavior shifts towards sustainability and responsible technology adoption are also contributing factors. Market penetration in key regions is expected to increase significantly, particularly in [mention specific regions].
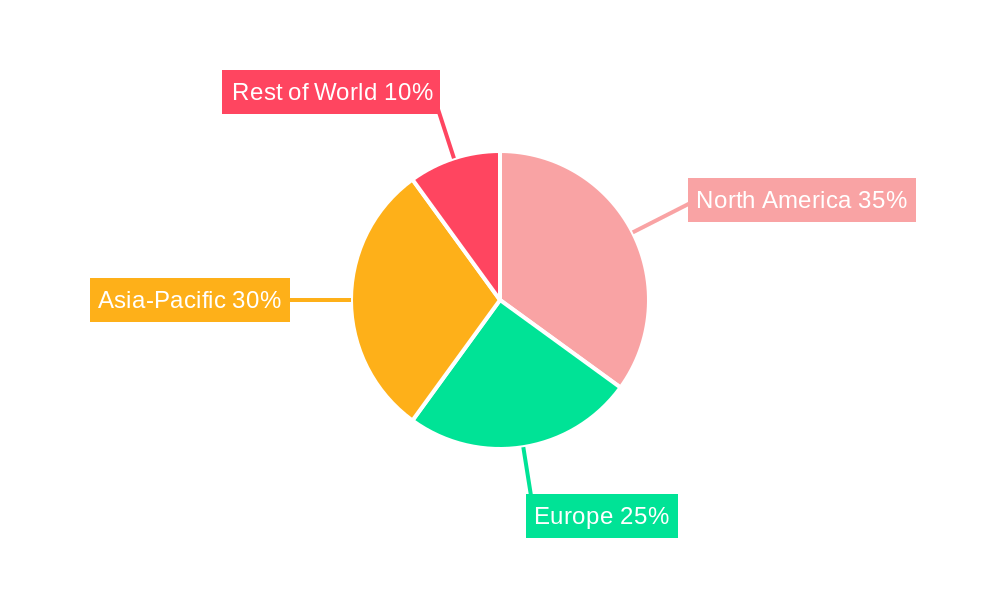
Dominant Regions, Countries, or Segments in Low Energy Servers
North America currently holds the largest market share in the low-energy server market, driven by the high concentration of data centers and strong adoption of cloud computing. However, the Asia-Pacific region is expected to witness the fastest growth during the forecast period, fueled by rapid economic expansion, increasing investments in data infrastructure, and government initiatives promoting energy efficiency. Europe is also exhibiting substantial growth, owing to stringent environmental regulations and rising demand for sustainable IT solutions.
- North America: High data center density, strong cloud adoption.
- Asia-Pacific: Rapid economic growth, increasing data infrastructure investments.
- Europe: Stringent environmental regulations, demand for sustainable IT.
- Key Growth Drivers: Government incentives for energy efficiency, increasing data center construction.
Low Energy Servers Product Landscape
Low-energy servers are characterized by advanced energy-efficient processors, optimized cooling systems, and intelligent power management features. Key product innovations include ARM-based servers, serverless computing platforms, and edge computing solutions optimized for low power consumption. These servers are utilized across a range of applications, including cloud computing, high-performance computing, and enterprise data centers. Performance metrics like watts per teraflop (W/TFlop) are crucial indicators for assessing energy efficiency. Unique selling propositions often center around reduced operational costs, minimized environmental impact, and improved performance per watt.
Key Drivers, Barriers & Challenges in Low Energy Servers
Key Drivers:
- Growing demand for energy-efficient data centers.
- Rising energy costs.
- Stringent environmental regulations.
- Advancements in energy-efficient processor technologies.
Challenges & Restraints:
- High initial investment costs for new technologies.
- Complexity of integrating new energy-efficient components.
- Potential supply chain disruptions impacting component availability.
- Competition from traditional server vendors.
Emerging Opportunities in Low Energy Servers
Emerging opportunities include the growth of edge computing, expansion into untapped markets (e.g., developing economies), and the increasing demand for serverless computing platforms. Innovative applications like AI and machine learning are driving further demand for optimized low-energy servers. Evolving consumer preferences for sustainable and environmentally friendly solutions present a significant opportunity for growth in the sector.
Growth Accelerators in the Low Energy Servers Industry
Technological breakthroughs in processor architecture, cooling solutions, and power management are key growth accelerators. Strategic partnerships between server manufacturers and technology providers are driving innovation and expansion. Market expansion strategies, including targeting new geographic regions and expanding into niche application areas, also contribute to long-term growth.
Key Players Shaping the Low Energy Servers Market
Notable Milestones in Low Energy Servers Sector
- 2021-Q3: Introduction of [Example: New ARM-based server with xx% improved energy efficiency by Company X].
- 2022-Q1: [Example: Partnership between Company Y and Company Z to develop advanced cooling solutions for low-energy servers].
- 2023-Q4: [Example: Launch of a new generation of energy-efficient processors by Company A].
- (Add more milestones with specific years/months and impact details)
In-Depth Low Energy Servers Market Outlook
The low-energy server market is projected to experience strong growth in the coming years, driven by a convergence of technological advancements, increasing environmental awareness, and the continuous expansion of the data center landscape. Strategic opportunities for market players include investing in R&D for next-generation energy-efficient technologies, expanding into new geographic markets, and focusing on strategic partnerships to enhance market penetration and product innovation. The future of low energy servers lies in the development of highly efficient and sustainable solutions that meet the growing demands of the digital age.
Low Energy Servers Segmentation
-
1. Application
- 1.1. Commercial
- 1.2. Industrial
- 1.3. Others
-
2. Types
- 2.1. Conventional
- 2.2. Compact
Low Energy Servers Segmentation By Geography
-
1. North America
- 1.1. United States
- 1.2. Canada
- 1.3. Mexico
-
2. South America
- 2.1. Brazil
- 2.2. Argentina
- 2.3. Rest of South America
-
3. Europe
- 3.1. United Kingdom
- 3.2. Germany
- 3.3. France
- 3.4. Italy
- 3.5. Spain
- 3.6. Russia
- 3.7. Benelux
- 3.8. Nordics
- 3.9. Rest of Europe
-
4. Middle East & Africa
- 4.1. Turkey
- 4.2. Israel
- 4.3. GCC
- 4.4. North Africa
- 4.5. South Africa
- 4.6. Rest of Middle East & Africa
-
5. Asia Pacific
- 5.1. China
- 5.2. India
- 5.3. Japan
- 5.4. South Korea
- 5.5. ASEAN
- 5.6. Oceania
- 5.7. Rest of Asia Pacific
Low Energy Servers Regional Market Share
Geographic Coverage of Low Energy Servers
Low Energy Servers REPORT HIGHLIGHTS
| Aspects | Details |
|---|---|
| Study Period | 2020-2034 |
| Base Year | 2025 |
| Estimated Year | 2026 |
| Forecast Period | 2026-2034 |
| Historical Period | 2020-2025 |
| Growth Rate | CAGR of 7.94% from 2020-2034 |
| Segmentation |
|
Table of Contents
- 1. Introduction
- 1.1. Research Scope
- 1.2. Market Segmentation
- 1.3. Research Objective
- 1.4. Definitions and Assumptions
- 2. Executive Summary
- 2.1. Market Snapshot
- 3. Market Dynamics
- 3.1. Market Drivers
- 3.2. Market Restrains
- 3.3. Market Trends
- 3.4. Market Opportunities
- 4. Market Factor Analysis
- 4.1. Porters Five Forces
- 4.1.1. Bargaining Power of Suppliers
- 4.1.2. Bargaining Power of Buyers
- 4.1.3. Threat of New Entrants
- 4.1.4. Threat of Substitutes
- 4.1.5. Competitive Rivalry
- 4.2. PESTEL analysis
- 4.3. BCG Analysis
- 4.3.1. Stars (High Growth, High Market Share)
- 4.3.2. Cash Cows (Low Growth, High Market Share)
- 4.3.3. Question Mark (High Growth, Low Market Share)
- 4.3.4. Dogs (Low Growth, Low Market Share)
- 4.4. Ansoff Matrix Analysis
- 4.5. Supply Chain Analysis
- 4.6. Regulatory Landscape
- 4.7. Current Market Potential and Opportunity Assessment (TAM–SAM–SOM Framework)
- 4.8. VDR Analyst Note
- 4.1. Porters Five Forces
- 5. Market Analysis, Insights and Forecast 2021-2033
- 5.1. Market Analysis, Insights and Forecast - by Application
- 5.1.1. Commercial
- 5.1.2. Industrial
- 5.1.3. Others
- 5.2. Market Analysis, Insights and Forecast - by Types
- 5.2.1. Conventional
- 5.2.2. Compact
- 5.3. Market Analysis, Insights and Forecast - by Region
- 5.3.1. North America
- 5.3.2. South America
- 5.3.3. Europe
- 5.3.4. Middle East & Africa
- 5.3.5. Asia Pacific
- 5.1. Market Analysis, Insights and Forecast - by Application
- 6. Global Low Energy Servers Analysis, Insights and Forecast, 2021-2033
- 6.1. Market Analysis, Insights and Forecast - by Application
- 6.1.1. Commercial
- 6.1.2. Industrial
- 6.1.3. Others
- 6.2. Market Analysis, Insights and Forecast - by Types
- 6.2.1. Conventional
- 6.2.2. Compact
- 6.1. Market Analysis, Insights and Forecast - by Application
- 7. North America Low Energy Servers Analysis, Insights and Forecast, 2021-2033
- 7.1. Market Analysis, Insights and Forecast - by Application
- 7.1.1. Commercial
- 7.1.2. Industrial
- 7.1.3. Others
- 7.2. Market Analysis, Insights and Forecast - by Types
- 7.2.1. Conventional
- 7.2.2. Compact
- 7.1. Market Analysis, Insights and Forecast - by Application
- 8. South America Low Energy Servers Analysis, Insights and Forecast, 2021-2033
- 8.1. Market Analysis, Insights and Forecast - by Application
- 8.1.1. Commercial
- 8.1.2. Industrial
- 8.1.3. Others
- 8.2. Market Analysis, Insights and Forecast - by Types
- 8.2.1. Conventional
- 8.2.2. Compact
- 8.1. Market Analysis, Insights and Forecast - by Application
- 9. Europe Low Energy Servers Analysis, Insights and Forecast, 2021-2033
- 9.1. Market Analysis, Insights and Forecast - by Application
- 9.1.1. Commercial
- 9.1.2. Industrial
- 9.1.3. Others
- 9.2. Market Analysis, Insights and Forecast - by Types
- 9.2.1. Conventional
- 9.2.2. Compact
- 9.1. Market Analysis, Insights and Forecast - by Application
- 10. Middle East & Africa Low Energy Servers Analysis, Insights and Forecast, 2021-2033
- 10.1. Market Analysis, Insights and Forecast - by Application
- 10.1.1. Commercial
- 10.1.2. Industrial
- 10.1.3. Others
- 10.2. Market Analysis, Insights and Forecast - by Types
- 10.2.1. Conventional
- 10.2.2. Compact
- 10.1. Market Analysis, Insights and Forecast - by Application
- 11. Asia Pacific Low Energy Servers Analysis, Insights and Forecast, 2021-2033
- 11.1. Market Analysis, Insights and Forecast - by Application
- 11.1.1. Commercial
- 11.1.2. Industrial
- 11.1.3. Others
- 11.2. Market Analysis, Insights and Forecast - by Types
- 11.2.1. Conventional
- 11.2.2. Compact
- 11.1. Market Analysis, Insights and Forecast - by Application
- 12. Competitive Analysis
- 12.1. Company Profiles
- 12.1.1 Thomas-Krenn
- 12.1.1.1. Company Overview
- 12.1.1.2. Products
- 12.1.1.3. Company Financials
- 12.1.1.4. SWOT Analysis
- 12.1.2 Broadberry
- 12.1.2.1. Company Overview
- 12.1.2.2. Products
- 12.1.2.3. Company Financials
- 12.1.2.4. SWOT Analysis
- 12.1.3 Super Micro
- 12.1.3.1. Company Overview
- 12.1.3.2. Products
- 12.1.3.3. Company Financials
- 12.1.3.4. SWOT Analysis
- 12.1.4 Asus
- 12.1.4.1. Company Overview
- 12.1.4.2. Products
- 12.1.4.3. Company Financials
- 12.1.4.4. SWOT Analysis
- 12.1.5 Dell
- 12.1.5.1. Company Overview
- 12.1.5.2. Products
- 12.1.5.3. Company Financials
- 12.1.5.4. SWOT Analysis
- 12.1.6 Hewlett Packard
- 12.1.6.1. Company Overview
- 12.1.6.2. Products
- 12.1.6.3. Company Financials
- 12.1.6.4. SWOT Analysis
- 12.1.7 Lenovo
- 12.1.7.1. Company Overview
- 12.1.7.2. Products
- 12.1.7.3. Company Financials
- 12.1.7.4. SWOT Analysis
- 12.1.8 QNAP
- 12.1.8.1. Company Overview
- 12.1.8.2. Products
- 12.1.8.3. Company Financials
- 12.1.8.4. SWOT Analysis
- 12.1.9 Fujitsu
- 12.1.9.1. Company Overview
- 12.1.9.2. Products
- 12.1.9.3. Company Financials
- 12.1.9.4. SWOT Analysis
- 12.1.1 Thomas-Krenn
- 12.2. Market Entropy
- 12.2.1 Company's Key Areas Served
- 12.2.2 Recent Developments
- 12.3. Company Market Share Analysis 2025
- 12.3.1 Top 5 Companies Market Share Analysis
- 12.3.2 Top 3 Companies Market Share Analysis
- 12.4. List of Potential Customers
- 13. Research Methodology
List of Figures
- Figure 1: Global Low Energy Servers Revenue Breakdown (undefined, %) by Region 2025 & 2033
- Figure 2: North America Low Energy Servers Revenue (undefined), by Application 2025 & 2033
- Figure 3: North America Low Energy Servers Revenue Share (%), by Application 2025 & 2033
- Figure 4: North America Low Energy Servers Revenue (undefined), by Types 2025 & 2033
- Figure 5: North America Low Energy Servers Revenue Share (%), by Types 2025 & 2033
- Figure 6: North America Low Energy Servers Revenue (undefined), by Country 2025 & 2033
- Figure 7: North America Low Energy Servers Revenue Share (%), by Country 2025 & 2033
- Figure 8: South America Low Energy Servers Revenue (undefined), by Application 2025 & 2033
- Figure 9: South America Low Energy Servers Revenue Share (%), by Application 2025 & 2033
- Figure 10: South America Low Energy Servers Revenue (undefined), by Types 2025 & 2033
- Figure 11: South America Low Energy Servers Revenue Share (%), by Types 2025 & 2033
- Figure 12: South America Low Energy Servers Revenue (undefined), by Country 2025 & 2033
- Figure 13: South America Low Energy Servers Revenue Share (%), by Country 2025 & 2033
- Figure 14: Europe Low Energy Servers Revenue (undefined), by Application 2025 & 2033
- Figure 15: Europe Low Energy Servers Revenue Share (%), by Application 2025 & 2033
- Figure 16: Europe Low Energy Servers Revenue (undefined), by Types 2025 & 2033
- Figure 17: Europe Low Energy Servers Revenue Share (%), by Types 2025 & 2033
- Figure 18: Europe Low Energy Servers Revenue (undefined), by Country 2025 & 2033
- Figure 19: Europe Low Energy Servers Revenue Share (%), by Country 2025 & 2033
- Figure 20: Middle East & Africa Low Energy Servers Revenue (undefined), by Application 2025 & 2033
- Figure 21: Middle East & Africa Low Energy Servers Revenue Share (%), by Application 2025 & 2033
- Figure 22: Middle East & Africa Low Energy Servers Revenue (undefined), by Types 2025 & 2033
- Figure 23: Middle East & Africa Low Energy Servers Revenue Share (%), by Types 2025 & 2033
- Figure 24: Middle East & Africa Low Energy Servers Revenue (undefined), by Country 2025 & 2033
- Figure 25: Middle East & Africa Low Energy Servers Revenue Share (%), by Country 2025 & 2033
- Figure 26: Asia Pacific Low Energy Servers Revenue (undefined), by Application 2025 & 2033
- Figure 27: Asia Pacific Low Energy Servers Revenue Share (%), by Application 2025 & 2033
- Figure 28: Asia Pacific Low Energy Servers Revenue (undefined), by Types 2025 & 2033
- Figure 29: Asia Pacific Low Energy Servers Revenue Share (%), by Types 2025 & 2033
- Figure 30: Asia Pacific Low Energy Servers Revenue (undefined), by Country 2025 & 2033
- Figure 31: Asia Pacific Low Energy Servers Revenue Share (%), by Country 2025 & 2033
List of Tables
- Table 1: Global Low Energy Servers Revenue undefined Forecast, by Application 2020 & 2033
- Table 2: Global Low Energy Servers Revenue undefined Forecast, by Types 2020 & 2033
- Table 3: Global Low Energy Servers Revenue undefined Forecast, by Region 2020 & 2033
- Table 4: Global Low Energy Servers Revenue undefined Forecast, by Application 2020 & 2033
- Table 5: Global Low Energy Servers Revenue undefined Forecast, by Types 2020 & 2033
- Table 6: Global Low Energy Servers Revenue undefined Forecast, by Country 2020 & 2033
- Table 7: United States Low Energy Servers Revenue (undefined) Forecast, by Application 2020 & 2033
- Table 8: Canada Low Energy Servers Revenue (undefined) Forecast, by Application 2020 & 2033
- Table 9: Mexico Low Energy Servers Revenue (undefined) Forecast, by Application 2020 & 2033
- Table 10: Global Low Energy Servers Revenue undefined Forecast, by Application 2020 & 2033
- Table 11: Global Low Energy Servers Revenue undefined Forecast, by Types 2020 & 2033
- Table 12: Global Low Energy Servers Revenue undefined Forecast, by Country 2020 & 2033
- Table 13: Brazil Low Energy Servers Revenue (undefined) Forecast, by Application 2020 & 2033
- Table 14: Argentina Low Energy Servers Revenue (undefined) Forecast, by Application 2020 & 2033
- Table 15: Rest of South America Low Energy Servers Revenue (undefined) Forecast, by Application 2020 & 2033
- Table 16: Global Low Energy Servers Revenue undefined Forecast, by Application 2020 & 2033
- Table 17: Global Low Energy Servers Revenue undefined Forecast, by Types 2020 & 2033
- Table 18: Global Low Energy Servers Revenue undefined Forecast, by Country 2020 & 2033
- Table 19: United Kingdom Low Energy Servers Revenue (undefined) Forecast, by Application 2020 & 2033
- Table 20: Germany Low Energy Servers Revenue (undefined) Forecast, by Application 2020 & 2033
- Table 21: France Low Energy Servers Revenue (undefined) Forecast, by Application 2020 & 2033
- Table 22: Italy Low Energy Servers Revenue (undefined) Forecast, by Application 2020 & 2033
- Table 23: Spain Low Energy Servers Revenue (undefined) Forecast, by Application 2020 & 2033
- Table 24: Russia Low Energy Servers Revenue (undefined) Forecast, by Application 2020 & 2033
- Table 25: Benelux Low Energy Servers Revenue (undefined) Forecast, by Application 2020 & 2033
- Table 26: Nordics Low Energy Servers Revenue (undefined) Forecast, by Application 2020 & 2033
- Table 27: Rest of Europe Low Energy Servers Revenue (undefined) Forecast, by Application 2020 & 2033
- Table 28: Global Low Energy Servers Revenue undefined Forecast, by Application 2020 & 2033
- Table 29: Global Low Energy Servers Revenue undefined Forecast, by Types 2020 & 2033
- Table 30: Global Low Energy Servers Revenue undefined Forecast, by Country 2020 & 2033
- Table 31: Turkey Low Energy Servers Revenue (undefined) Forecast, by Application 2020 & 2033
- Table 32: Israel Low Energy Servers Revenue (undefined) Forecast, by Application 2020 & 2033
- Table 33: GCC Low Energy Servers Revenue (undefined) Forecast, by Application 2020 & 2033
- Table 34: North Africa Low Energy Servers Revenue (undefined) Forecast, by Application 2020 & 2033
- Table 35: South Africa Low Energy Servers Revenue (undefined) Forecast, by Application 2020 & 2033
- Table 36: Rest of Middle East & Africa Low Energy Servers Revenue (undefined) Forecast, by Application 2020 & 2033
- Table 37: Global Low Energy Servers Revenue undefined Forecast, by Application 2020 & 2033
- Table 38: Global Low Energy Servers Revenue undefined Forecast, by Types 2020 & 2033
- Table 39: Global Low Energy Servers Revenue undefined Forecast, by Country 2020 & 2033
- Table 40: China Low Energy Servers Revenue (undefined) Forecast, by Application 2020 & 2033
- Table 41: India Low Energy Servers Revenue (undefined) Forecast, by Application 2020 & 2033
- Table 42: Japan Low Energy Servers Revenue (undefined) Forecast, by Application 2020 & 2033
- Table 43: South Korea Low Energy Servers Revenue (undefined) Forecast, by Application 2020 & 2033
- Table 44: ASEAN Low Energy Servers Revenue (undefined) Forecast, by Application 2020 & 2033
- Table 45: Oceania Low Energy Servers Revenue (undefined) Forecast, by Application 2020 & 2033
- Table 46: Rest of Asia Pacific Low Energy Servers Revenue (undefined) Forecast, by Application 2020 & 2033
Frequently Asked Questions
1. What is the projected Compound Annual Growth Rate (CAGR) of the Low Energy Servers?
The projected CAGR is approximately 7.94%.
2. Which companies are prominent players in the Low Energy Servers?
Key companies in the market include Thomas-Krenn, Broadberry, Super Micro, Asus, Dell, Hewlett Packard, Lenovo, QNAP, Fujitsu.
3. What are the main segments of the Low Energy Servers?
The market segments include Application, Types.
4. Can you provide details about the market size?
The market size is estimated to be USD XXX N/A as of 2022.
5. What are some drivers contributing to market growth?
N/A
6. What are the notable trends driving market growth?
N/A
7. Are there any restraints impacting market growth?
N/A
8. Can you provide examples of recent developments in the market?
N/A
9. What pricing options are available for accessing the report?
Pricing options include single-user, multi-user, and enterprise licenses priced at USD 4900.00, USD 7350.00, and USD 9800.00 respectively.
10. Is the market size provided in terms of value or volume?
The market size is provided in terms of value, measured in N/A.
11. Are there any specific market keywords associated with the report?
Yes, the market keyword associated with the report is "Low Energy Servers," which aids in identifying and referencing the specific market segment covered.
12. How do I determine which pricing option suits my needs best?
The pricing options vary based on user requirements and access needs. Individual users may opt for single-user licenses, while businesses requiring broader access may choose multi-user or enterprise licenses for cost-effective access to the report.
13. Are there any additional resources or data provided in the Low Energy Servers report?
While the report offers comprehensive insights, it's advisable to review the specific contents or supplementary materials provided to ascertain if additional resources or data are available.
14. How can I stay updated on further developments or reports in the Low Energy Servers?
To stay informed about further developments, trends, and reports in the Low Energy Servers, consider subscribing to industry newsletters, following relevant companies and organizations, or regularly checking reputable industry news sources and publications.
Methodology
Step 1 - Identification of Relevant Samples Size from Population Database


Step 2 - Approaches for Defining Global Market Size (Value, Volume* & Price*)

Note*: In applicable scenarios
Step 3 - Data Sources
Primary Research
- Web Analytics
- Survey Reports
- Research Institute
- Latest Research Reports
- Opinion Leaders
Secondary Research
- Annual Reports
- White Paper
- Latest Press Release
- Industry Association
- Paid Database
- Investor Presentations

Step 4 - Data Triangulation
Involves using different sources of information in order to increase the validity of a study
These sources are likely to be stakeholders in a program - participants, other researchers, program staff, other community members, and so on.
Then we put all data in single framework & apply various statistical tools to find out the dynamic on the market.
During the analysis stage, feedback from the stakeholder groups would be compared to determine areas of agreement as well as areas of divergence

