

Key Insights
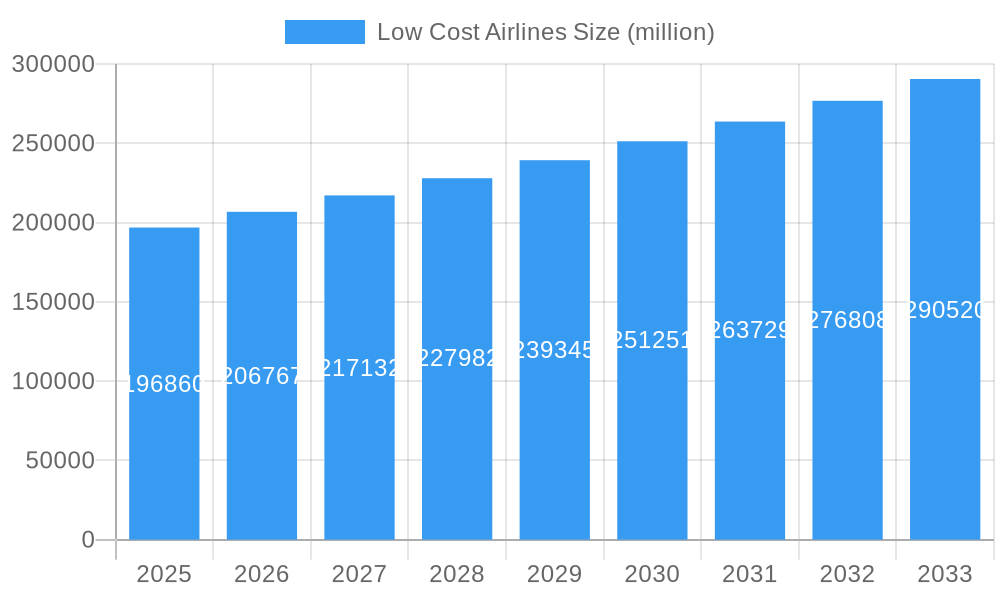
The low-cost airline market, valued at $196,860 million in 2025, is projected to experience robust growth, driven by increasing affordability, rising disposable incomes in emerging economies, and a growing preference for budget-friendly travel among millennials and Gen Z. Key players like Ryanair, AirAsia, and EasyJet are leveraging technological advancements to optimize operations, enhance customer experience through personalized offerings, and expand their route networks to tap into underserved markets. The market's expansion is further fueled by the increasing adoption of ancillary revenue streams, such as baggage fees and in-flight purchases, which contribute significantly to airline profitability. However, challenges remain, including fluctuating fuel prices, intense competition, and the potential impact of geopolitical instability on travel demand. Strategic alliances, mergers and acquisitions, and a focus on sustainable aviation practices are expected to shape the industry's future landscape.
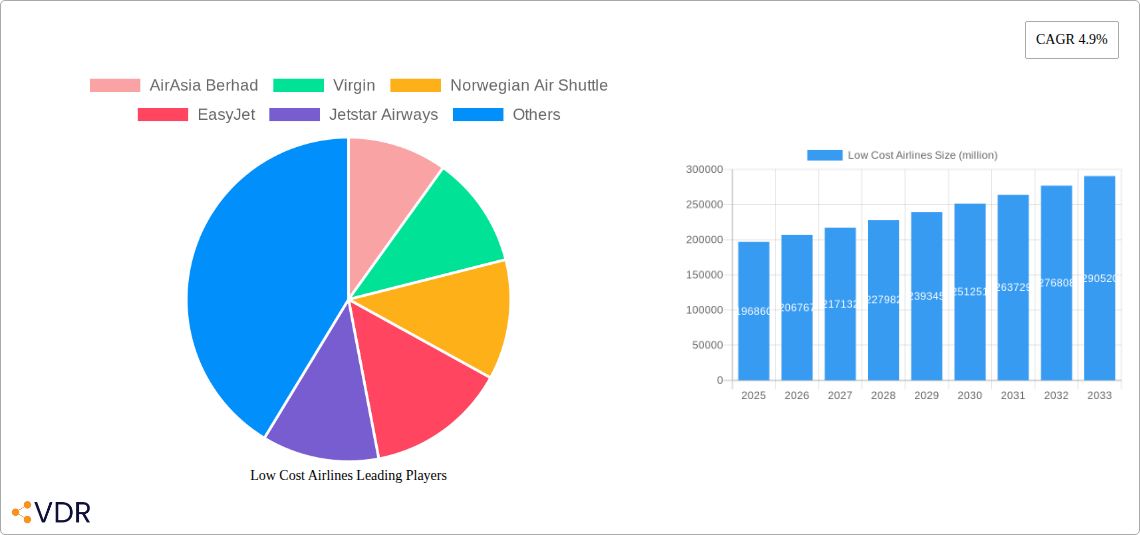
Low Cost Airlines Market Size (In Billion)
Despite potential headwinds, the market's projected CAGR of 4.9% from 2025 to 2033 suggests a significant upward trajectory. This sustained growth will be influenced by factors such as the continuous expansion of the middle class in developing nations, further technological innovations leading to cost reductions, and the evolving preferences of consumers seeking flexible and affordable travel options. Airlines are responding to these trends by investing in fuel-efficient aircraft, streamlining their operational processes, and enhancing their digital platforms to improve customer engagement and loyalty. The competitive dynamics will continue to intensify, necessitating strategic partnerships and innovative business models to ensure long-term success and market share.
Low Cost Airlines Company Market Share
Low-Cost Airlines Market Report: 2019-2033
This comprehensive report provides an in-depth analysis of the low-cost airline market, encompassing market dynamics, growth trends, regional dominance, product landscape, and key player strategies from 2019 to 2033. The study meticulously examines the evolution of this dynamic sector, offering invaluable insights for industry professionals, investors, and strategic decision-makers. With a base year of 2025 and a forecast period extending to 2033, this report leverages extensive data analysis to illuminate the future trajectory of the low-cost airline industry. The parent market is the broader airline industry, and the child market is the budget or no-frills airline sector.
Study Period: 2019–2033 Base Year: 2025 Estimated Year: 2025 Forecast Period: 2025–2033 Historical Period: 2019–2024
Low Cost Airlines Market Dynamics & Structure
This section analyzes the competitive landscape of the low-cost airline market, encompassing market concentration, technological innovation, regulatory frameworks, and competitive dynamics. The analysis incorporates quantitative data, such as market share percentages and M&A deal volumes (in millions of USD), alongside qualitative assessments of innovation barriers and market structures.
Market Concentration: The market exhibits a moderately concentrated structure, with the top 10 players accounting for approximately xx% of the global market share in 2024. Ryanair, Southwest (not explicitly listed but a major player), and AirAsia held significant shares. Increased consolidation is expected through mergers and acquisitions.
Technological Innovation: Technological advancements in areas such as fleet optimization, revenue management systems, and digitalization of customer services are key drivers of efficiency and profitability. However, high implementation costs and the need for skilled personnel pose barriers to innovation for smaller players.
Regulatory Frameworks: Varying regulatory environments across different regions impact operational costs and market access. Stringent safety regulations and environmental concerns are significant factors.
Competitive Product Substitutes: High-speed rail networks and other modes of transportation represent competitive substitutes, particularly for shorter routes. This requires airlines to offer compelling value propositions and competitive pricing.
End-User Demographics: The primary end-user demographic consists of budget-conscious travelers, including leisure travelers and price-sensitive business travelers. Changes in demographics and travel preferences influence market demand.
M&A Trends: The low-cost airline sector has witnessed significant M&A activity in recent years, driven by a need for expansion, economies of scale, and network consolidation. The total deal value for M&A activities in the historical period was approximately xx million.
Low Cost Airlines Growth Trends & Insights
This section examines the historical and projected growth of the low-cost airline market. Utilizing advanced analytical techniques, the report provides a comprehensive overview of market size evolution, adoption rates, technological disruptions, and consumer behavior shifts, incorporating metrics like Compound Annual Growth Rate (CAGR) and market penetration. The market experienced a CAGR of xx% during 2019-2024 and is projected to reach xx million by 2033, with a CAGR of xx% during the forecast period. Key factors driving growth include rising disposable incomes in emerging markets, increasing affordability of air travel, and the expansion of low-cost carrier networks. The report further delves into the impact of technological disruptions, such as the rise of mobile booking platforms and ancillary revenue streams, on market growth. Consumer behavior shifts towards increased price sensitivity and demand for personalized travel experiences are also analyzed.
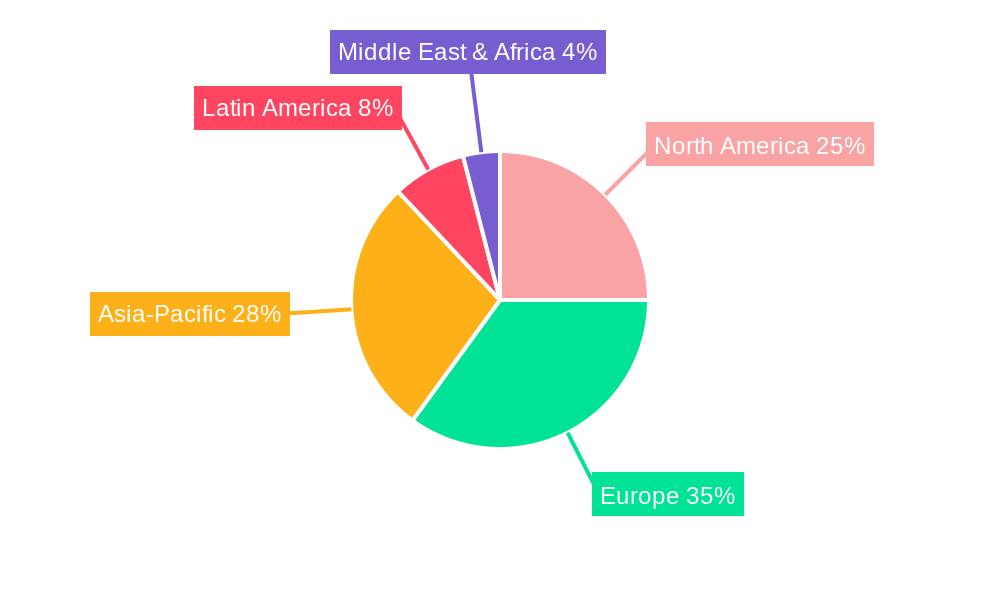
Dominant Regions, Countries, or Segments in Low Cost Airlines
This section identifies the leading regions and countries driving market growth. A detailed analysis of market share and growth potential highlights the dominant players and their competitive strategies. Key drivers, such as economic policies, infrastructure development, and tourism growth, are identified.
Asia-Pacific: This region dominates the market due to rapid economic growth, increasing middle-class populations, and expanding tourism. AirAsia Berhad and Jetstar Airways are key contributors.
Europe: Strong competition and mature markets characterize this region, with Ryanair Holdings and EasyJet leading the way.
North America: The market exhibits moderate growth due to factors such as well-established networks and competitive pricing. WestJet Airlines plays a major role.
Other Regions: Latin America (Azul Linhas Areas Brasileiras) and the Middle East (Air Arabia PJSC) show promise for future expansion.
Low Cost Airlines Product Landscape
The low-cost airline product landscape is characterized by a focus on cost efficiency and operational optimization. This involves strategies like point-to-point routing, efficient fleet management, and a streamlined customer service model. Technological advancements, such as dynamic pricing algorithms and improved mobile applications, enhance operational efficiency and the customer experience. Unique selling propositions include competitive pricing, ease of booking, and a growing range of ancillary services.
Key Drivers, Barriers & Challenges in Low Cost Airlines
Key Drivers:
- Rising disposable incomes: Increased affordability of air travel fuels demand.
- Technological advancements: Streamlined operations and enhanced customer experiences drive efficiency and growth.
- Government support: Favorable policies and infrastructure development boost market expansion.
Key Barriers and Challenges:
- Fuel price volatility: Fluctuations in fuel prices significantly impact profitability.
- Intense competition: The market is highly competitive, putting pressure on pricing and margins. A price war could severely impact profitability.
- Regulatory hurdles: Varying regulations across regions create operational complexities.
- Supply chain disruptions: Disruptions impact operational efficiency and increase costs.
Emerging Opportunities in Low Cost Airlines
- Untapped markets: Expanding into underserved regions offers significant growth potential.
- Ancillary revenue streams: Diversifying revenue sources through add-on services enhances profitability.
- Sustainable aviation: Adopting environmentally friendly practices can attract environmentally conscious consumers.
Growth Accelerators in the Low Cost Airlines Industry
Technological advancements in areas such as aircraft fuel efficiency and digitalization, coupled with strategic partnerships to expand network reach and enhance customer service offerings, are driving long-term growth. Moreover, expansion into new markets, particularly in developing economies with growing middle classes, presents substantial opportunities.
Key Players Shaping the Low Cost Airlines Market
Notable Milestones in Low Cost Airlines Sector
- 2020: The COVID-19 pandemic significantly impacted the industry, leading to widespread flight cancellations and financial distress.
- 2022: Several airlines reported a strong recovery in passenger numbers, although fuel prices remained high.
- 2023: Increased focus on sustainable aviation practices and technological investments to improve operational efficiency.
In-Depth Low Cost Airlines Market Outlook
The low-cost airline market is poised for continued growth, driven by ongoing technological advancements, strategic expansions into new markets, and a growing focus on sustainability. The market's future potential is significant, particularly in developing economies and underserved regions. Opportunities exist for airlines to leverage innovative business models and technological solutions to enhance efficiency, customer satisfaction, and profitability.
Low Cost Airlines Segmentation
-
1. Application
- 1.1. Online
- 1.2. Travel Agency
- 1.3. Others
-
2. Type
- 2.1. Leisure Travel
- 2.2. VFR
- 2.3. Business Travel
- 2.4. Others
Low Cost Airlines Segmentation By Geography
-
1. North America
- 1.1. United States
- 1.2. Canada
- 1.3. Mexico
-
2. South America
- 2.1. Brazil
- 2.2. Argentina
- 2.3. Rest of South America
-
3. Europe
- 3.1. United Kingdom
- 3.2. Germany
- 3.3. France
- 3.4. Italy
- 3.5. Spain
- 3.6. Russia
- 3.7. Benelux
- 3.8. Nordics
- 3.9. Rest of Europe
-
4. Middle East & Africa
- 4.1. Turkey
- 4.2. Israel
- 4.3. GCC
- 4.4. North Africa
- 4.5. South Africa
- 4.6. Rest of Middle East & Africa
-
5. Asia Pacific
- 5.1. China
- 5.2. India
- 5.3. Japan
- 5.4. South Korea
- 5.5. ASEAN
- 5.6. Oceania
- 5.7. Rest of Asia Pacific
Low Cost Airlines Regional Market Share
Geographic Coverage of Low Cost Airlines
Low Cost Airlines REPORT HIGHLIGHTS
| Aspects | Details |
|---|---|
| Study Period | 2020-2034 |
| Base Year | 2025 |
| Estimated Year | 2026 |
| Forecast Period | 2026-2034 |
| Historical Period | 2020-2025 |
| Growth Rate | CAGR of 7.29% from 2020-2034 |
| Segmentation |
|
Table of Contents
- 1. Introduction
- 1.1. Research Scope
- 1.2. Market Segmentation
- 1.3. Research Methodology
- 1.4. Definitions and Assumptions
- 2. Executive Summary
- 2.1. Introduction
- 3. Market Dynamics
- 3.1. Introduction
- 3.2. Market Drivers
- 3.3. Market Restrains
- 3.4. Market Trends
- 4. Market Factor Analysis
- 4.1. Porters Five Forces
- 4.2. Supply/Value Chain
- 4.3. PESTEL analysis
- 4.4. Market Entropy
- 4.5. Patent/Trademark Analysis
- 5. Global Low Cost Airlines Analysis, Insights and Forecast, 2020-2032
- 5.1. Market Analysis, Insights and Forecast - by Application
- 5.1.1. Online
- 5.1.2. Travel Agency
- 5.1.3. Others
- 5.2. Market Analysis, Insights and Forecast - by Type
- 5.2.1. Leisure Travel
- 5.2.2. VFR
- 5.2.3. Business Travel
- 5.2.4. Others
- 5.3. Market Analysis, Insights and Forecast - by Region
- 5.3.1. North America
- 5.3.2. South America
- 5.3.3. Europe
- 5.3.4. Middle East & Africa
- 5.3.5. Asia Pacific
- 5.1. Market Analysis, Insights and Forecast - by Application
- 6. North America Low Cost Airlines Analysis, Insights and Forecast, 2020-2032
- 6.1. Market Analysis, Insights and Forecast - by Application
- 6.1.1. Online
- 6.1.2. Travel Agency
- 6.1.3. Others
- 6.2. Market Analysis, Insights and Forecast - by Type
- 6.2.1. Leisure Travel
- 6.2.2. VFR
- 6.2.3. Business Travel
- 6.2.4. Others
- 6.1. Market Analysis, Insights and Forecast - by Application
- 7. South America Low Cost Airlines Analysis, Insights and Forecast, 2020-2032
- 7.1. Market Analysis, Insights and Forecast - by Application
- 7.1.1. Online
- 7.1.2. Travel Agency
- 7.1.3. Others
- 7.2. Market Analysis, Insights and Forecast - by Type
- 7.2.1. Leisure Travel
- 7.2.2. VFR
- 7.2.3. Business Travel
- 7.2.4. Others
- 7.1. Market Analysis, Insights and Forecast - by Application
- 8. Europe Low Cost Airlines Analysis, Insights and Forecast, 2020-2032
- 8.1. Market Analysis, Insights and Forecast - by Application
- 8.1.1. Online
- 8.1.2. Travel Agency
- 8.1.3. Others
- 8.2. Market Analysis, Insights and Forecast - by Type
- 8.2.1. Leisure Travel
- 8.2.2. VFR
- 8.2.3. Business Travel
- 8.2.4. Others
- 8.1. Market Analysis, Insights and Forecast - by Application
- 9. Middle East & Africa Low Cost Airlines Analysis, Insights and Forecast, 2020-2032
- 9.1. Market Analysis, Insights and Forecast - by Application
- 9.1.1. Online
- 9.1.2. Travel Agency
- 9.1.3. Others
- 9.2. Market Analysis, Insights and Forecast - by Type
- 9.2.1. Leisure Travel
- 9.2.2. VFR
- 9.2.3. Business Travel
- 9.2.4. Others
- 9.1. Market Analysis, Insights and Forecast - by Application
- 10. Asia Pacific Low Cost Airlines Analysis, Insights and Forecast, 2020-2032
- 10.1. Market Analysis, Insights and Forecast - by Application
- 10.1.1. Online
- 10.1.2. Travel Agency
- 10.1.3. Others
- 10.2. Market Analysis, Insights and Forecast - by Type
- 10.2.1. Leisure Travel
- 10.2.2. VFR
- 10.2.3. Business Travel
- 10.2.4. Others
- 10.1. Market Analysis, Insights and Forecast - by Application
- 11. Competitive Analysis
- 11.1. Global Market Share Analysis 2025
- 11.2. Company Profiles
- 11.2.1 AirAsia Berhad
- 11.2.1.1. Overview
- 11.2.1.2. Products
- 11.2.1.3. SWOT Analysis
- 11.2.1.4. Recent Developments
- 11.2.1.5. Financials (Based on Availability)
- 11.2.2 Virgin
- 11.2.2.1. Overview
- 11.2.2.2. Products
- 11.2.2.3. SWOT Analysis
- 11.2.2.4. Recent Developments
- 11.2.2.5. Financials (Based on Availability)
- 11.2.3 Norwegian Air Shuttle
- 11.2.3.1. Overview
- 11.2.3.2. Products
- 11.2.3.3. SWOT Analysis
- 11.2.3.4. Recent Developments
- 11.2.3.5. Financials (Based on Availability)
- 11.2.4 EasyJet
- 11.2.4.1. Overview
- 11.2.4.2. Products
- 11.2.4.3. SWOT Analysis
- 11.2.4.4. Recent Developments
- 11.2.4.5. Financials (Based on Availability)
- 11.2.5 Jetstar Airways
- 11.2.5.1. Overview
- 11.2.5.2. Products
- 11.2.5.3. SWOT Analysis
- 11.2.5.4. Recent Developments
- 11.2.5.5. Financials (Based on Availability)
- 11.2.6 WestJet Airlines
- 11.2.6.1. Overview
- 11.2.6.2. Products
- 11.2.6.3. SWOT Analysis
- 11.2.6.4. Recent Developments
- 11.2.6.5. Financials (Based on Availability)
- 11.2.7 Indigo
- 11.2.7.1. Overview
- 11.2.7.2. Products
- 11.2.7.3. SWOT Analysis
- 11.2.7.4. Recent Developments
- 11.2.7.5. Financials (Based on Availability)
- 11.2.8 Azul Linhas Areas Brasileiras
- 11.2.8.1. Overview
- 11.2.8.2. Products
- 11.2.8.3. SWOT Analysis
- 11.2.8.4. Recent Developments
- 11.2.8.5. Financials (Based on Availability)
- 11.2.9 Ryanair Holdings
- 11.2.9.1. Overview
- 11.2.9.2. Products
- 11.2.9.3. SWOT Analysis
- 11.2.9.4. Recent Developments
- 11.2.9.5. Financials (Based on Availability)
- 11.2.10 Air Arabia PJSC
- 11.2.10.1. Overview
- 11.2.10.2. Products
- 11.2.10.3. SWOT Analysis
- 11.2.10.4. Recent Developments
- 11.2.10.5. Financials (Based on Availability)
- 11.2.1 AirAsia Berhad
List of Figures
- Figure 1: Global Low Cost Airlines Revenue Breakdown (undefined, %) by Region 2025 & 2033
- Figure 2: North America Low Cost Airlines Revenue (undefined), by Application 2025 & 2033
- Figure 3: North America Low Cost Airlines Revenue Share (%), by Application 2025 & 2033
- Figure 4: North America Low Cost Airlines Revenue (undefined), by Type 2025 & 2033
- Figure 5: North America Low Cost Airlines Revenue Share (%), by Type 2025 & 2033
- Figure 6: North America Low Cost Airlines Revenue (undefined), by Country 2025 & 2033
- Figure 7: North America Low Cost Airlines Revenue Share (%), by Country 2025 & 2033
- Figure 8: South America Low Cost Airlines Revenue (undefined), by Application 2025 & 2033
- Figure 9: South America Low Cost Airlines Revenue Share (%), by Application 2025 & 2033
- Figure 10: South America Low Cost Airlines Revenue (undefined), by Type 2025 & 2033
- Figure 11: South America Low Cost Airlines Revenue Share (%), by Type 2025 & 2033
- Figure 12: South America Low Cost Airlines Revenue (undefined), by Country 2025 & 2033
- Figure 13: South America Low Cost Airlines Revenue Share (%), by Country 2025 & 2033
- Figure 14: Europe Low Cost Airlines Revenue (undefined), by Application 2025 & 2033
- Figure 15: Europe Low Cost Airlines Revenue Share (%), by Application 2025 & 2033
- Figure 16: Europe Low Cost Airlines Revenue (undefined), by Type 2025 & 2033
- Figure 17: Europe Low Cost Airlines Revenue Share (%), by Type 2025 & 2033
- Figure 18: Europe Low Cost Airlines Revenue (undefined), by Country 2025 & 2033
- Figure 19: Europe Low Cost Airlines Revenue Share (%), by Country 2025 & 2033
- Figure 20: Middle East & Africa Low Cost Airlines Revenue (undefined), by Application 2025 & 2033
- Figure 21: Middle East & Africa Low Cost Airlines Revenue Share (%), by Application 2025 & 2033
- Figure 22: Middle East & Africa Low Cost Airlines Revenue (undefined), by Type 2025 & 2033
- Figure 23: Middle East & Africa Low Cost Airlines Revenue Share (%), by Type 2025 & 2033
- Figure 24: Middle East & Africa Low Cost Airlines Revenue (undefined), by Country 2025 & 2033
- Figure 25: Middle East & Africa Low Cost Airlines Revenue Share (%), by Country 2025 & 2033
- Figure 26: Asia Pacific Low Cost Airlines Revenue (undefined), by Application 2025 & 2033
- Figure 27: Asia Pacific Low Cost Airlines Revenue Share (%), by Application 2025 & 2033
- Figure 28: Asia Pacific Low Cost Airlines Revenue (undefined), by Type 2025 & 2033
- Figure 29: Asia Pacific Low Cost Airlines Revenue Share (%), by Type 2025 & 2033
- Figure 30: Asia Pacific Low Cost Airlines Revenue (undefined), by Country 2025 & 2033
- Figure 31: Asia Pacific Low Cost Airlines Revenue Share (%), by Country 2025 & 2033
List of Tables
- Table 1: Global Low Cost Airlines Revenue undefined Forecast, by Application 2020 & 2033
- Table 2: Global Low Cost Airlines Revenue undefined Forecast, by Type 2020 & 2033
- Table 3: Global Low Cost Airlines Revenue undefined Forecast, by Region 2020 & 2033
- Table 4: Global Low Cost Airlines Revenue undefined Forecast, by Application 2020 & 2033
- Table 5: Global Low Cost Airlines Revenue undefined Forecast, by Type 2020 & 2033
- Table 6: Global Low Cost Airlines Revenue undefined Forecast, by Country 2020 & 2033
- Table 7: United States Low Cost Airlines Revenue (undefined) Forecast, by Application 2020 & 2033
- Table 8: Canada Low Cost Airlines Revenue (undefined) Forecast, by Application 2020 & 2033
- Table 9: Mexico Low Cost Airlines Revenue (undefined) Forecast, by Application 2020 & 2033
- Table 10: Global Low Cost Airlines Revenue undefined Forecast, by Application 2020 & 2033
- Table 11: Global Low Cost Airlines Revenue undefined Forecast, by Type 2020 & 2033
- Table 12: Global Low Cost Airlines Revenue undefined Forecast, by Country 2020 & 2033
- Table 13: Brazil Low Cost Airlines Revenue (undefined) Forecast, by Application 2020 & 2033
- Table 14: Argentina Low Cost Airlines Revenue (undefined) Forecast, by Application 2020 & 2033
- Table 15: Rest of South America Low Cost Airlines Revenue (undefined) Forecast, by Application 2020 & 2033
- Table 16: Global Low Cost Airlines Revenue undefined Forecast, by Application 2020 & 2033
- Table 17: Global Low Cost Airlines Revenue undefined Forecast, by Type 2020 & 2033
- Table 18: Global Low Cost Airlines Revenue undefined Forecast, by Country 2020 & 2033
- Table 19: United Kingdom Low Cost Airlines Revenue (undefined) Forecast, by Application 2020 & 2033
- Table 20: Germany Low Cost Airlines Revenue (undefined) Forecast, by Application 2020 & 2033
- Table 21: France Low Cost Airlines Revenue (undefined) Forecast, by Application 2020 & 2033
- Table 22: Italy Low Cost Airlines Revenue (undefined) Forecast, by Application 2020 & 2033
- Table 23: Spain Low Cost Airlines Revenue (undefined) Forecast, by Application 2020 & 2033
- Table 24: Russia Low Cost Airlines Revenue (undefined) Forecast, by Application 2020 & 2033
- Table 25: Benelux Low Cost Airlines Revenue (undefined) Forecast, by Application 2020 & 2033
- Table 26: Nordics Low Cost Airlines Revenue (undefined) Forecast, by Application 2020 & 2033
- Table 27: Rest of Europe Low Cost Airlines Revenue (undefined) Forecast, by Application 2020 & 2033
- Table 28: Global Low Cost Airlines Revenue undefined Forecast, by Application 2020 & 2033
- Table 29: Global Low Cost Airlines Revenue undefined Forecast, by Type 2020 & 2033
- Table 30: Global Low Cost Airlines Revenue undefined Forecast, by Country 2020 & 2033
- Table 31: Turkey Low Cost Airlines Revenue (undefined) Forecast, by Application 2020 & 2033
- Table 32: Israel Low Cost Airlines Revenue (undefined) Forecast, by Application 2020 & 2033
- Table 33: GCC Low Cost Airlines Revenue (undefined) Forecast, by Application 2020 & 2033
- Table 34: North Africa Low Cost Airlines Revenue (undefined) Forecast, by Application 2020 & 2033
- Table 35: South Africa Low Cost Airlines Revenue (undefined) Forecast, by Application 2020 & 2033
- Table 36: Rest of Middle East & Africa Low Cost Airlines Revenue (undefined) Forecast, by Application 2020 & 2033
- Table 37: Global Low Cost Airlines Revenue undefined Forecast, by Application 2020 & 2033
- Table 38: Global Low Cost Airlines Revenue undefined Forecast, by Type 2020 & 2033
- Table 39: Global Low Cost Airlines Revenue undefined Forecast, by Country 2020 & 2033
- Table 40: China Low Cost Airlines Revenue (undefined) Forecast, by Application 2020 & 2033
- Table 41: India Low Cost Airlines Revenue (undefined) Forecast, by Application 2020 & 2033
- Table 42: Japan Low Cost Airlines Revenue (undefined) Forecast, by Application 2020 & 2033
- Table 43: South Korea Low Cost Airlines Revenue (undefined) Forecast, by Application 2020 & 2033
- Table 44: ASEAN Low Cost Airlines Revenue (undefined) Forecast, by Application 2020 & 2033
- Table 45: Oceania Low Cost Airlines Revenue (undefined) Forecast, by Application 2020 & 2033
- Table 46: Rest of Asia Pacific Low Cost Airlines Revenue (undefined) Forecast, by Application 2020 & 2033
Frequently Asked Questions
1. What is the projected Compound Annual Growth Rate (CAGR) of the Low Cost Airlines?
The projected CAGR is approximately 7.29%.
2. Which companies are prominent players in the Low Cost Airlines?
Key companies in the market include AirAsia Berhad, Virgin, Norwegian Air Shuttle, EasyJet, Jetstar Airways, WestJet Airlines, Indigo, Azul Linhas Areas Brasileiras, Ryanair Holdings, Air Arabia PJSC.
3. What are the main segments of the Low Cost Airlines?
The market segments include Application, Type.
4. Can you provide details about the market size?
The market size is estimated to be USD XXX N/A as of 2022.
5. What are some drivers contributing to market growth?
N/A
6. What are the notable trends driving market growth?
N/A
7. Are there any restraints impacting market growth?
N/A
8. Can you provide examples of recent developments in the market?
N/A
9. What pricing options are available for accessing the report?
Pricing options include single-user, multi-user, and enterprise licenses priced at USD 2900.00, USD 4350.00, and USD 5800.00 respectively.
10. Is the market size provided in terms of value or volume?
The market size is provided in terms of value, measured in N/A.
11. Are there any specific market keywords associated with the report?
Yes, the market keyword associated with the report is "Low Cost Airlines," which aids in identifying and referencing the specific market segment covered.
12. How do I determine which pricing option suits my needs best?
The pricing options vary based on user requirements and access needs. Individual users may opt for single-user licenses, while businesses requiring broader access may choose multi-user or enterprise licenses for cost-effective access to the report.
13. Are there any additional resources or data provided in the Low Cost Airlines report?
While the report offers comprehensive insights, it's advisable to review the specific contents or supplementary materials provided to ascertain if additional resources or data are available.
14. How can I stay updated on further developments or reports in the Low Cost Airlines?
To stay informed about further developments, trends, and reports in the Low Cost Airlines, consider subscribing to industry newsletters, following relevant companies and organizations, or regularly checking reputable industry news sources and publications.
Methodology
Step 1 - Identification of Relevant Samples Size from Population Database


Step 2 - Approaches for Defining Global Market Size (Value, Volume* & Price*)

Note*: In applicable scenarios
Step 3 - Data Sources
Primary Research
- Web Analytics
- Survey Reports
- Research Institute
- Latest Research Reports
- Opinion Leaders
Secondary Research
- Annual Reports
- White Paper
- Latest Press Release
- Industry Association
- Paid Database
- Investor Presentations

Step 4 - Data Triangulation
Involves using different sources of information in order to increase the validity of a study
These sources are likely to be stakeholders in a program - participants, other researchers, program staff, other community members, and so on.
Then we put all data in single framework & apply various statistical tools to find out the dynamic on the market.
During the analysis stage, feedback from the stakeholder groups would be compared to determine areas of agreement as well as areas of divergence