Key Insights
The Local Area Network (LAN) Access Switches market is experiencing robust growth, driven by the increasing adoption of cloud computing, the proliferation of Internet of Things (IoT) devices, and the expanding need for high-bandwidth connectivity across various sectors. The market, estimated at $15 billion in 2025, is projected to maintain a healthy Compound Annual Growth Rate (CAGR) of 7% from 2025 to 2033, reaching approximately $25 billion by the end of the forecast period. This expansion is fueled by several key trends: the shift towards higher-speed Ethernet technologies like 10 Gigabit Ethernet and 40 Gigabit Ethernet, the rising demand for managed and smart switches offering enhanced security and network management capabilities, and the increasing adoption of software-defined networking (SDN) solutions for greater network agility and scalability. Key players like Cisco, Huawei, and Arista Networks are driving innovation and competition, while smaller players are focusing on niche markets and specialized applications.
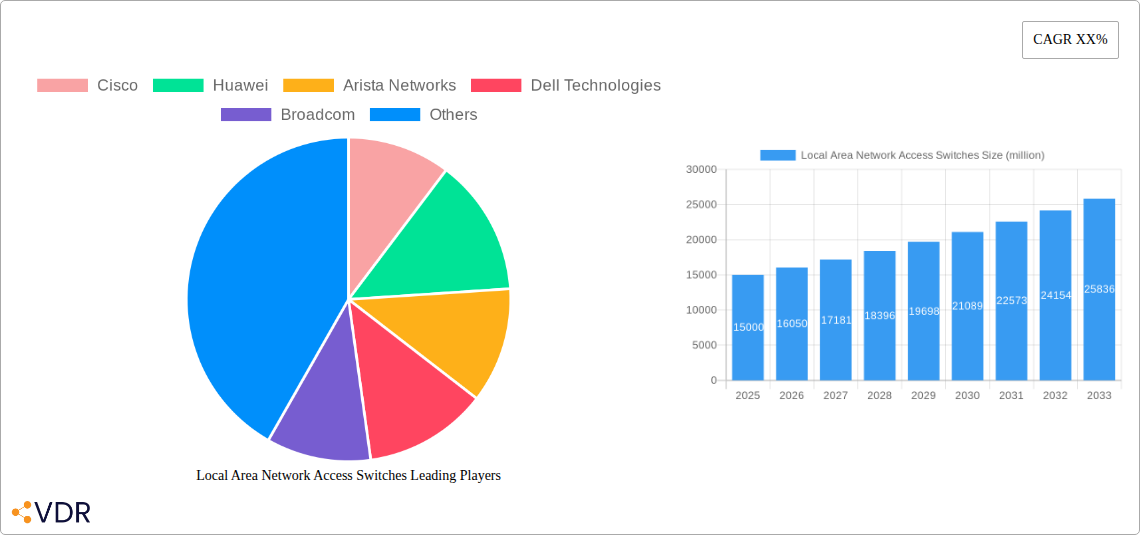
Local Area Network Access Switches Market Size (In Billion)
However, the market faces certain restraints. Fluctuations in raw material costs, intense competition, and potential supply chain disruptions can impact market growth. The increasing complexity of network management and the need for skilled personnel to deploy and maintain these systems also pose challenges. Despite these restraints, the long-term outlook for the LAN Access Switches market remains positive, primarily driven by sustained demand from enterprise networks, data centers, and small and medium-sized businesses (SMBs) seeking to upgrade their network infrastructure to support evolving business needs and digital transformation initiatives. The market is segmented by various factors including switch type (managed, unmanaged), port speed (1GbE, 10GbE, 40GbE), and application (enterprise, SMB, data center). Geographic expansion, particularly in developing economies, presents significant growth opportunities.

Local Area Network Access Switches Company Market Share
Local Area Network Access Switches Market Report: 2019-2033
This comprehensive report provides an in-depth analysis of the Local Area Network (LAN) Access Switches market, encompassing market dynamics, growth trends, regional analysis, product landscape, key players, and future outlook. The study covers the period from 2019 to 2033, with 2025 serving as the base and estimated year. The report offers crucial insights for industry professionals, investors, and strategic decision-makers seeking to navigate this rapidly evolving market. The parent market is the networking equipment market, and the child market is the LAN access switches market. The total addressable market (TAM) in 2025 is estimated at xx million units.
Data Disclaimer: While every effort has been made to ensure accuracy, some figures may be estimations based on industry trends and expert analysis.
Local Area Network Access Switches Market Dynamics & Structure
This section analyzes the competitive landscape, technological advancements, regulatory influences, and market trends within the LAN Access Switches market. The market is characterized by a moderate level of concentration, with a few major players holding significant market share. Technological innovation, driven by increasing demand for higher bandwidth and enhanced security features, is a key driver. Regulatory frameworks, particularly concerning data privacy and network security, significantly impact market dynamics. The emergence of software-defined networking (SDN) and network function virtualization (NFV) presents both opportunities and challenges for existing players. Mergers and acquisitions (M&A) activity has been moderate, with strategic alliances shaping the competitive landscape.
- Market Concentration: The top 5 players hold approximately 60% market share in 2025.
- Technological Innovation: Key drivers include 10 Gigabit Ethernet, 40 Gigabit Ethernet, and advancements in Power over Ethernet (PoE).
- Regulatory Frameworks: Compliance with GDPR, CCPA, and other data protection regulations is paramount.
- M&A Activity: xx M&A deals were recorded between 2019-2024, with a predicted xx deals for 2025-2033.
- Competitive Substitutes: Wireless LAN technologies (Wi-Fi) pose a competitive threat in certain segments.
Local Area Network Access Switches Growth Trends & Insights
The global LAN Access Switches market experienced robust growth between 2019 and 2024, driven by factors such as increasing network infrastructure deployment across various sectors (enterprise, data centers, and SMBs). The market is projected to maintain a Compound Annual Growth Rate (CAGR) of xx% during the forecast period (2025-2033), reaching an estimated xx million units by 2033. This growth is fueled by the rising adoption of cloud computing, the Internet of Things (IoT), and the increasing demand for high-speed, reliable network connectivity. Technological disruptions, particularly the shift towards SDN and NFV, are reshaping the market landscape. Consumer behavior is shifting towards managed services and cloud-based solutions, impacting the demand for different switch types. Market penetration in developing economies remains relatively low, representing a significant growth opportunity.
Dominant Regions, Countries, or Segments in Local Area Network Access Switches
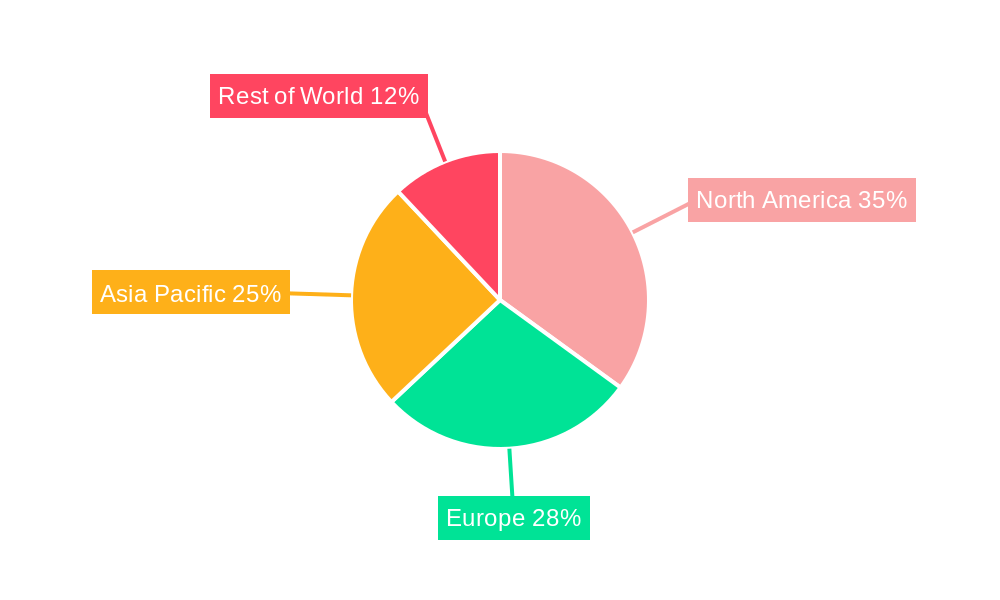
North America and Western Europe currently dominate the LAN Access Switches market, owing to high levels of technological adoption and advanced infrastructure. However, the Asia-Pacific region is expected to witness the fastest growth during the forecast period, driven by substantial investments in IT infrastructure, expanding digital economy and government initiatives promoting digitalization. The enterprise segment currently holds the largest market share, followed by the data center and SMB segments.
- Key Drivers in Asia-Pacific: Rapid urbanization, rising disposable incomes, and government investments in digital infrastructure.
- Dominance Factors in North America: Established IT infrastructure, high technological adoption rates, and strong presence of major players.
- Growth Potential in Emerging Markets: Significant untapped potential in developing economies due to increasing internet penetration and digitalization initiatives. Market share projections: North America (xx%), Asia-Pacific (xx%), Europe (xx%), Rest of the World (xx%).
Local Area Network Access Switches Product Landscape
The LAN Access Switches market offers a diverse range of products, from basic unmanaged switches to advanced managed switches with intelligent features like PoE, quality of service (QoS), and security capabilities. Recent product innovations include the integration of artificial intelligence (AI) for enhanced network management and automation. Key performance metrics include switching capacity, port density, power consumption, and security features. Unique selling propositions often revolve around ease of management, scalability, and enhanced security capabilities. Technological advancements are focused on increasing bandwidth, improving power efficiency, and enhancing network security.
Key Drivers, Barriers & Challenges in Local Area Network Access Switches
Key Drivers:
- Increasing demand for high-bandwidth applications.
- Growing adoption of cloud computing and IoT.
- Investments in network infrastructure upgrades.
Key Challenges & Restraints:
- Intense competition from established and emerging players.
- Supply chain disruptions impacting component availability and costs. A xx% increase in component costs was observed in 2022.
- Regulatory complexities related to data privacy and cybersecurity.
Emerging Opportunities in Local Area Network Access Switches
- Growing demand for high-speed access switches in 5G network deployments.
- Expansion into the Industrial IoT (IIoT) market.
- Increased adoption of Software-Defined Networking (SDN) and Network Function Virtualization (NFV).
Growth Accelerators in the Local Area Network Access Switches Industry
Technological breakthroughs, particularly in areas like AI-powered network management and higher-speed Ethernet technologies, are key growth accelerators. Strategic partnerships between switch vendors and cloud service providers are further fueling market expansion. Market expansion strategies focusing on emerging markets and untapped segments present significant growth opportunities.
Key Players Shaping the Local Area Network Access Switches Market
- Cisco
- Huawei
- Arista Networks
- Dell Technologies
- Broadcom
- DASAN Network Solutions
- ubiQuoss
- Dayou Plus
- Piolink
- Samji Electronics
- D-Link
- TP-Link
- HFR
- Soltech Infonet
- Syscable Korea
- Tellion, Inc
- Handreamnet
Notable Milestones in Local Area Network Access Switches Sector
- 2020: Introduction of 800 Gigabit Ethernet switches by multiple vendors.
- 2022: Several significant M&A deals consolidated market share among key players.
- 2023: Widespread adoption of AI-based network management solutions.
- 2024: Increased focus on sustainable and energy-efficient switches.
In-Depth Local Area Network Access Switches Market Outlook
The LAN Access Switches market is poised for continued growth driven by ongoing technological advancements, expanding network infrastructure, and increasing demand for high-speed connectivity. Strategic investments in R&D, strategic partnerships, and expansion into new markets will be crucial for success. The market presents significant opportunities for both established and emerging players, with a focus on innovation and addressing the evolving needs of businesses and consumers.
Local Area Network Access Switches Segmentation
-
1. Application
- 1.1. Enterprise
- 1.2. Park
- 1.3. Industrial
- 1.4. Data Center
- 1.5. Others
-
2. Types
- 2.1. Fixed Managed
- 2.2. Fixed Unmanaged
- 2.3. Modular Switches
Local Area Network Access Switches Segmentation By Geography
-
1. North America
- 1.1. United States
- 1.2. Canada
- 1.3. Mexico
-
2. South America
- 2.1. Brazil
- 2.2. Argentina
- 2.3. Rest of South America
-
3. Europe
- 3.1. United Kingdom
- 3.2. Germany
- 3.3. France
- 3.4. Italy
- 3.5. Spain
- 3.6. Russia
- 3.7. Benelux
- 3.8. Nordics
- 3.9. Rest of Europe
-
4. Middle East & Africa
- 4.1. Turkey
- 4.2. Israel
- 4.3. GCC
- 4.4. North Africa
- 4.5. South Africa
- 4.6. Rest of Middle East & Africa
-
5. Asia Pacific
- 5.1. China
- 5.2. India
- 5.3. Japan
- 5.4. South Korea
- 5.5. ASEAN
- 5.6. Oceania
- 5.7. Rest of Asia Pacific
Local Area Network Access Switches Regional Market Share
Geographic Coverage of Local Area Network Access Switches
Local Area Network Access Switches REPORT HIGHLIGHTS
| Aspects | Details |
|---|---|
| Study Period | 2020-2034 |
| Base Year | 2025 |
| Estimated Year | 2026 |
| Forecast Period | 2026-2034 |
| Historical Period | 2020-2025 |
| Growth Rate | CAGR of 6.5% from 2020-2034 |
| Segmentation |
|
Table of Contents
- 1. Introduction
- 1.1. Research Scope
- 1.2. Market Segmentation
- 1.3. Research Objective
- 1.4. Definitions and Assumptions
- 2. Executive Summary
- 2.1. Market Snapshot
- 3. Market Dynamics
- 3.1. Market Drivers
- 3.2. Market Restrains
- 3.3. Market Trends
- 3.4. Market Opportunities
- 4. Market Factor Analysis
- 4.1. Porters Five Forces
- 4.1.1. Bargaining Power of Suppliers
- 4.1.2. Bargaining Power of Buyers
- 4.1.3. Threat of New Entrants
- 4.1.4. Threat of Substitutes
- 4.1.5. Competitive Rivalry
- 4.2. PESTEL analysis
- 4.3. BCG Analysis
- 4.3.1. Stars (High Growth, High Market Share)
- 4.3.2. Cash Cows (Low Growth, High Market Share)
- 4.3.3. Question Mark (High Growth, Low Market Share)
- 4.3.4. Dogs (Low Growth, Low Market Share)
- 4.4. Ansoff Matrix Analysis
- 4.5. Supply Chain Analysis
- 4.6. Regulatory Landscape
- 4.7. Current Market Potential and Opportunity Assessment (TAM–SAM–SOM Framework)
- 4.8. VDR Analyst Note
- 4.1. Porters Five Forces
- 5. Market Analysis, Insights and Forecast 2021-2033
- 5.1. Market Analysis, Insights and Forecast - by Application
- 5.1.1. Enterprise
- 5.1.2. Park
- 5.1.3. Industrial
- 5.1.4. Data Center
- 5.1.5. Others
- 5.2. Market Analysis, Insights and Forecast - by Types
- 5.2.1. Fixed Managed
- 5.2.2. Fixed Unmanaged
- 5.2.3. Modular Switches
- 5.3. Market Analysis, Insights and Forecast - by Region
- 5.3.1. North America
- 5.3.2. South America
- 5.3.3. Europe
- 5.3.4. Middle East & Africa
- 5.3.5. Asia Pacific
- 5.1. Market Analysis, Insights and Forecast - by Application
- 6. Global Local Area Network Access Switches Analysis, Insights and Forecast, 2021-2033
- 6.1. Market Analysis, Insights and Forecast - by Application
- 6.1.1. Enterprise
- 6.1.2. Park
- 6.1.3. Industrial
- 6.1.4. Data Center
- 6.1.5. Others
- 6.2. Market Analysis, Insights and Forecast - by Types
- 6.2.1. Fixed Managed
- 6.2.2. Fixed Unmanaged
- 6.2.3. Modular Switches
- 6.1. Market Analysis, Insights and Forecast - by Application
- 7. North America Local Area Network Access Switches Analysis, Insights and Forecast, 2021-2033
- 7.1. Market Analysis, Insights and Forecast - by Application
- 7.1.1. Enterprise
- 7.1.2. Park
- 7.1.3. Industrial
- 7.1.4. Data Center
- 7.1.5. Others
- 7.2. Market Analysis, Insights and Forecast - by Types
- 7.2.1. Fixed Managed
- 7.2.2. Fixed Unmanaged
- 7.2.3. Modular Switches
- 7.1. Market Analysis, Insights and Forecast - by Application
- 8. South America Local Area Network Access Switches Analysis, Insights and Forecast, 2021-2033
- 8.1. Market Analysis, Insights and Forecast - by Application
- 8.1.1. Enterprise
- 8.1.2. Park
- 8.1.3. Industrial
- 8.1.4. Data Center
- 8.1.5. Others
- 8.2. Market Analysis, Insights and Forecast - by Types
- 8.2.1. Fixed Managed
- 8.2.2. Fixed Unmanaged
- 8.2.3. Modular Switches
- 8.1. Market Analysis, Insights and Forecast - by Application
- 9. Europe Local Area Network Access Switches Analysis, Insights and Forecast, 2021-2033
- 9.1. Market Analysis, Insights and Forecast - by Application
- 9.1.1. Enterprise
- 9.1.2. Park
- 9.1.3. Industrial
- 9.1.4. Data Center
- 9.1.5. Others
- 9.2. Market Analysis, Insights and Forecast - by Types
- 9.2.1. Fixed Managed
- 9.2.2. Fixed Unmanaged
- 9.2.3. Modular Switches
- 9.1. Market Analysis, Insights and Forecast - by Application
- 10. Middle East & Africa Local Area Network Access Switches Analysis, Insights and Forecast, 2021-2033
- 10.1. Market Analysis, Insights and Forecast - by Application
- 10.1.1. Enterprise
- 10.1.2. Park
- 10.1.3. Industrial
- 10.1.4. Data Center
- 10.1.5. Others
- 10.2. Market Analysis, Insights and Forecast - by Types
- 10.2.1. Fixed Managed
- 10.2.2. Fixed Unmanaged
- 10.2.3. Modular Switches
- 10.1. Market Analysis, Insights and Forecast - by Application
- 11. Asia Pacific Local Area Network Access Switches Analysis, Insights and Forecast, 2021-2033
- 11.1. Market Analysis, Insights and Forecast - by Application
- 11.1.1. Enterprise
- 11.1.2. Park
- 11.1.3. Industrial
- 11.1.4. Data Center
- 11.1.5. Others
- 11.2. Market Analysis, Insights and Forecast - by Types
- 11.2.1. Fixed Managed
- 11.2.2. Fixed Unmanaged
- 11.2.3. Modular Switches
- 11.1. Market Analysis, Insights and Forecast - by Application
- 12. Competitive Analysis
- 12.1. Company Profiles
- 12.1.1 Cisco
- 12.1.1.1. Company Overview
- 12.1.1.2. Products
- 12.1.1.3. Company Financials
- 12.1.1.4. SWOT Analysis
- 12.1.2 Huawei
- 12.1.2.1. Company Overview
- 12.1.2.2. Products
- 12.1.2.3. Company Financials
- 12.1.2.4. SWOT Analysis
- 12.1.3 Arista Networks
- 12.1.3.1. Company Overview
- 12.1.3.2. Products
- 12.1.3.3. Company Financials
- 12.1.3.4. SWOT Analysis
- 12.1.4 Dell Technologies
- 12.1.4.1. Company Overview
- 12.1.4.2. Products
- 12.1.4.3. Company Financials
- 12.1.4.4. SWOT Analysis
- 12.1.5 Broadcom
- 12.1.5.1. Company Overview
- 12.1.5.2. Products
- 12.1.5.3. Company Financials
- 12.1.5.4. SWOT Analysis
- 12.1.6 DASAN Network Solutions
- 12.1.6.1. Company Overview
- 12.1.6.2. Products
- 12.1.6.3. Company Financials
- 12.1.6.4. SWOT Analysis
- 12.1.7 ubiQuoss
- 12.1.7.1. Company Overview
- 12.1.7.2. Products
- 12.1.7.3. Company Financials
- 12.1.7.4. SWOT Analysis
- 12.1.8 Dayou Plus
- 12.1.8.1. Company Overview
- 12.1.8.2. Products
- 12.1.8.3. Company Financials
- 12.1.8.4. SWOT Analysis
- 12.1.9 Piolink
- 12.1.9.1. Company Overview
- 12.1.9.2. Products
- 12.1.9.3. Company Financials
- 12.1.9.4. SWOT Analysis
- 12.1.10 Samji Electronics
- 12.1.10.1. Company Overview
- 12.1.10.2. Products
- 12.1.10.3. Company Financials
- 12.1.10.4. SWOT Analysis
- 12.1.11 D-Link
- 12.1.11.1. Company Overview
- 12.1.11.2. Products
- 12.1.11.3. Company Financials
- 12.1.11.4. SWOT Analysis
- 12.1.12 TP-Link
- 12.1.12.1. Company Overview
- 12.1.12.2. Products
- 12.1.12.3. Company Financials
- 12.1.12.4. SWOT Analysis
- 12.1.13 HFR
- 12.1.13.1. Company Overview
- 12.1.13.2. Products
- 12.1.13.3. Company Financials
- 12.1.13.4. SWOT Analysis
- 12.1.14 Soltech Infonet
- 12.1.14.1. Company Overview
- 12.1.14.2. Products
- 12.1.14.3. Company Financials
- 12.1.14.4. SWOT Analysis
- 12.1.15 Syscable Korea
- 12.1.15.1. Company Overview
- 12.1.15.2. Products
- 12.1.15.3. Company Financials
- 12.1.15.4. SWOT Analysis
- 12.1.16 Tellion
- 12.1.16.1. Company Overview
- 12.1.16.2. Products
- 12.1.16.3. Company Financials
- 12.1.16.4. SWOT Analysis
- 12.1.17 Inc
- 12.1.17.1. Company Overview
- 12.1.17.2. Products
- 12.1.17.3. Company Financials
- 12.1.17.4. SWOT Analysis
- 12.1.18 Handreamnet
- 12.1.18.1. Company Overview
- 12.1.18.2. Products
- 12.1.18.3. Company Financials
- 12.1.18.4. SWOT Analysis
- 12.1.1 Cisco
- 12.2. Market Entropy
- 12.2.1 Company's Key Areas Served
- 12.2.2 Recent Developments
- 12.3. Company Market Share Analysis 2025
- 12.3.1 Top 5 Companies Market Share Analysis
- 12.3.2 Top 3 Companies Market Share Analysis
- 12.4. List of Potential Customers
- 13. Research Methodology
List of Figures
- Figure 1: Global Local Area Network Access Switches Revenue Breakdown (undefined, %) by Region 2025 & 2033
- Figure 2: North America Local Area Network Access Switches Revenue (undefined), by Application 2025 & 2033
- Figure 3: North America Local Area Network Access Switches Revenue Share (%), by Application 2025 & 2033
- Figure 4: North America Local Area Network Access Switches Revenue (undefined), by Types 2025 & 2033
- Figure 5: North America Local Area Network Access Switches Revenue Share (%), by Types 2025 & 2033
- Figure 6: North America Local Area Network Access Switches Revenue (undefined), by Country 2025 & 2033
- Figure 7: North America Local Area Network Access Switches Revenue Share (%), by Country 2025 & 2033
- Figure 8: South America Local Area Network Access Switches Revenue (undefined), by Application 2025 & 2033
- Figure 9: South America Local Area Network Access Switches Revenue Share (%), by Application 2025 & 2033
- Figure 10: South America Local Area Network Access Switches Revenue (undefined), by Types 2025 & 2033
- Figure 11: South America Local Area Network Access Switches Revenue Share (%), by Types 2025 & 2033
- Figure 12: South America Local Area Network Access Switches Revenue (undefined), by Country 2025 & 2033
- Figure 13: South America Local Area Network Access Switches Revenue Share (%), by Country 2025 & 2033
- Figure 14: Europe Local Area Network Access Switches Revenue (undefined), by Application 2025 & 2033
- Figure 15: Europe Local Area Network Access Switches Revenue Share (%), by Application 2025 & 2033
- Figure 16: Europe Local Area Network Access Switches Revenue (undefined), by Types 2025 & 2033
- Figure 17: Europe Local Area Network Access Switches Revenue Share (%), by Types 2025 & 2033
- Figure 18: Europe Local Area Network Access Switches Revenue (undefined), by Country 2025 & 2033
- Figure 19: Europe Local Area Network Access Switches Revenue Share (%), by Country 2025 & 2033
- Figure 20: Middle East & Africa Local Area Network Access Switches Revenue (undefined), by Application 2025 & 2033
- Figure 21: Middle East & Africa Local Area Network Access Switches Revenue Share (%), by Application 2025 & 2033
- Figure 22: Middle East & Africa Local Area Network Access Switches Revenue (undefined), by Types 2025 & 2033
- Figure 23: Middle East & Africa Local Area Network Access Switches Revenue Share (%), by Types 2025 & 2033
- Figure 24: Middle East & Africa Local Area Network Access Switches Revenue (undefined), by Country 2025 & 2033
- Figure 25: Middle East & Africa Local Area Network Access Switches Revenue Share (%), by Country 2025 & 2033
- Figure 26: Asia Pacific Local Area Network Access Switches Revenue (undefined), by Application 2025 & 2033
- Figure 27: Asia Pacific Local Area Network Access Switches Revenue Share (%), by Application 2025 & 2033
- Figure 28: Asia Pacific Local Area Network Access Switches Revenue (undefined), by Types 2025 & 2033
- Figure 29: Asia Pacific Local Area Network Access Switches Revenue Share (%), by Types 2025 & 2033
- Figure 30: Asia Pacific Local Area Network Access Switches Revenue (undefined), by Country 2025 & 2033
- Figure 31: Asia Pacific Local Area Network Access Switches Revenue Share (%), by Country 2025 & 2033
List of Tables
- Table 1: Global Local Area Network Access Switches Revenue undefined Forecast, by Application 2020 & 2033
- Table 2: Global Local Area Network Access Switches Revenue undefined Forecast, by Types 2020 & 2033
- Table 3: Global Local Area Network Access Switches Revenue undefined Forecast, by Region 2020 & 2033
- Table 4: Global Local Area Network Access Switches Revenue undefined Forecast, by Application 2020 & 2033
- Table 5: Global Local Area Network Access Switches Revenue undefined Forecast, by Types 2020 & 2033
- Table 6: Global Local Area Network Access Switches Revenue undefined Forecast, by Country 2020 & 2033
- Table 7: United States Local Area Network Access Switches Revenue (undefined) Forecast, by Application 2020 & 2033
- Table 8: Canada Local Area Network Access Switches Revenue (undefined) Forecast, by Application 2020 & 2033
- Table 9: Mexico Local Area Network Access Switches Revenue (undefined) Forecast, by Application 2020 & 2033
- Table 10: Global Local Area Network Access Switches Revenue undefined Forecast, by Application 2020 & 2033
- Table 11: Global Local Area Network Access Switches Revenue undefined Forecast, by Types 2020 & 2033
- Table 12: Global Local Area Network Access Switches Revenue undefined Forecast, by Country 2020 & 2033
- Table 13: Brazil Local Area Network Access Switches Revenue (undefined) Forecast, by Application 2020 & 2033
- Table 14: Argentina Local Area Network Access Switches Revenue (undefined) Forecast, by Application 2020 & 2033
- Table 15: Rest of South America Local Area Network Access Switches Revenue (undefined) Forecast, by Application 2020 & 2033
- Table 16: Global Local Area Network Access Switches Revenue undefined Forecast, by Application 2020 & 2033
- Table 17: Global Local Area Network Access Switches Revenue undefined Forecast, by Types 2020 & 2033
- Table 18: Global Local Area Network Access Switches Revenue undefined Forecast, by Country 2020 & 2033
- Table 19: United Kingdom Local Area Network Access Switches Revenue (undefined) Forecast, by Application 2020 & 2033
- Table 20: Germany Local Area Network Access Switches Revenue (undefined) Forecast, by Application 2020 & 2033
- Table 21: France Local Area Network Access Switches Revenue (undefined) Forecast, by Application 2020 & 2033
- Table 22: Italy Local Area Network Access Switches Revenue (undefined) Forecast, by Application 2020 & 2033
- Table 23: Spain Local Area Network Access Switches Revenue (undefined) Forecast, by Application 2020 & 2033
- Table 24: Russia Local Area Network Access Switches Revenue (undefined) Forecast, by Application 2020 & 2033
- Table 25: Benelux Local Area Network Access Switches Revenue (undefined) Forecast, by Application 2020 & 2033
- Table 26: Nordics Local Area Network Access Switches Revenue (undefined) Forecast, by Application 2020 & 2033
- Table 27: Rest of Europe Local Area Network Access Switches Revenue (undefined) Forecast, by Application 2020 & 2033
- Table 28: Global Local Area Network Access Switches Revenue undefined Forecast, by Application 2020 & 2033
- Table 29: Global Local Area Network Access Switches Revenue undefined Forecast, by Types 2020 & 2033
- Table 30: Global Local Area Network Access Switches Revenue undefined Forecast, by Country 2020 & 2033
- Table 31: Turkey Local Area Network Access Switches Revenue (undefined) Forecast, by Application 2020 & 2033
- Table 32: Israel Local Area Network Access Switches Revenue (undefined) Forecast, by Application 2020 & 2033
- Table 33: GCC Local Area Network Access Switches Revenue (undefined) Forecast, by Application 2020 & 2033
- Table 34: North Africa Local Area Network Access Switches Revenue (undefined) Forecast, by Application 2020 & 2033
- Table 35: South Africa Local Area Network Access Switches Revenue (undefined) Forecast, by Application 2020 & 2033
- Table 36: Rest of Middle East & Africa Local Area Network Access Switches Revenue (undefined) Forecast, by Application 2020 & 2033
- Table 37: Global Local Area Network Access Switches Revenue undefined Forecast, by Application 2020 & 2033
- Table 38: Global Local Area Network Access Switches Revenue undefined Forecast, by Types 2020 & 2033
- Table 39: Global Local Area Network Access Switches Revenue undefined Forecast, by Country 2020 & 2033
- Table 40: China Local Area Network Access Switches Revenue (undefined) Forecast, by Application 2020 & 2033
- Table 41: India Local Area Network Access Switches Revenue (undefined) Forecast, by Application 2020 & 2033
- Table 42: Japan Local Area Network Access Switches Revenue (undefined) Forecast, by Application 2020 & 2033
- Table 43: South Korea Local Area Network Access Switches Revenue (undefined) Forecast, by Application 2020 & 2033
- Table 44: ASEAN Local Area Network Access Switches Revenue (undefined) Forecast, by Application 2020 & 2033
- Table 45: Oceania Local Area Network Access Switches Revenue (undefined) Forecast, by Application 2020 & 2033
- Table 46: Rest of Asia Pacific Local Area Network Access Switches Revenue (undefined) Forecast, by Application 2020 & 2033
Frequently Asked Questions
1. What is the projected Compound Annual Growth Rate (CAGR) of the Local Area Network Access Switches?
The projected CAGR is approximately 6.5%.
2. Which companies are prominent players in the Local Area Network Access Switches?
Key companies in the market include Cisco, Huawei, Arista Networks, Dell Technologies, Broadcom, DASAN Network Solutions, ubiQuoss, Dayou Plus, Piolink, Samji Electronics, D-Link, TP-Link, HFR, Soltech Infonet, Syscable Korea, Tellion, Inc, Handreamnet.
3. What are the main segments of the Local Area Network Access Switches?
The market segments include Application, Types.
4. Can you provide details about the market size?
The market size is estimated to be USD XXX N/A as of 2022.
5. What are some drivers contributing to market growth?
N/A
6. What are the notable trends driving market growth?
N/A
7. Are there any restraints impacting market growth?
N/A
8. Can you provide examples of recent developments in the market?
N/A
9. What pricing options are available for accessing the report?
Pricing options include single-user, multi-user, and enterprise licenses priced at USD 2900.00, USD 4350.00, and USD 5800.00 respectively.
10. Is the market size provided in terms of value or volume?
The market size is provided in terms of value, measured in N/A.
11. Are there any specific market keywords associated with the report?
Yes, the market keyword associated with the report is "Local Area Network Access Switches," which aids in identifying and referencing the specific market segment covered.
12. How do I determine which pricing option suits my needs best?
The pricing options vary based on user requirements and access needs. Individual users may opt for single-user licenses, while businesses requiring broader access may choose multi-user or enterprise licenses for cost-effective access to the report.
13. Are there any additional resources or data provided in the Local Area Network Access Switches report?
While the report offers comprehensive insights, it's advisable to review the specific contents or supplementary materials provided to ascertain if additional resources or data are available.
14. How can I stay updated on further developments or reports in the Local Area Network Access Switches?
To stay informed about further developments, trends, and reports in the Local Area Network Access Switches, consider subscribing to industry newsletters, following relevant companies and organizations, or regularly checking reputable industry news sources and publications.
Methodology
Step 1 - Identification of Relevant Samples Size from Population Database


Step 2 - Approaches for Defining Global Market Size (Value, Volume* & Price*)

Note*: In applicable scenarios
Step 3 - Data Sources
Primary Research
- Web Analytics
- Survey Reports
- Research Institute
- Latest Research Reports
- Opinion Leaders
Secondary Research
- Annual Reports
- White Paper
- Latest Press Release
- Industry Association
- Paid Database
- Investor Presentations

Step 4 - Data Triangulation
Involves using different sources of information in order to increase the validity of a study
These sources are likely to be stakeholders in a program - participants, other researchers, program staff, other community members, and so on.
Then we put all data in single framework & apply various statistical tools to find out the dynamic on the market.
During the analysis stage, feedback from the stakeholder groups would be compared to determine areas of agreement as well as areas of divergence

