Key Insights
The load balancer router market is experiencing robust growth, driven by the increasing demand for high-availability and high-performance networking solutions across various sectors. The surge in cloud adoption, the proliferation of IoT devices, and the expanding need for bandwidth-intensive applications like video streaming and online gaming are key factors fueling this expansion. Businesses are increasingly relying on load balancing routers to ensure optimal network performance, minimize downtime, and enhance user experience. The market is witnessing a shift towards software-defined networking (SDN) and network function virtualization (NFV) technologies, offering greater flexibility and scalability compared to traditional hardware-based solutions. Furthermore, the integration of advanced features like application-aware load balancing and security enhancements is driving premium pricing and higher market value. Leading vendors such as TP-Link, Cisco, and Huawei are actively investing in research and development to introduce innovative products with improved features and enhanced capabilities.
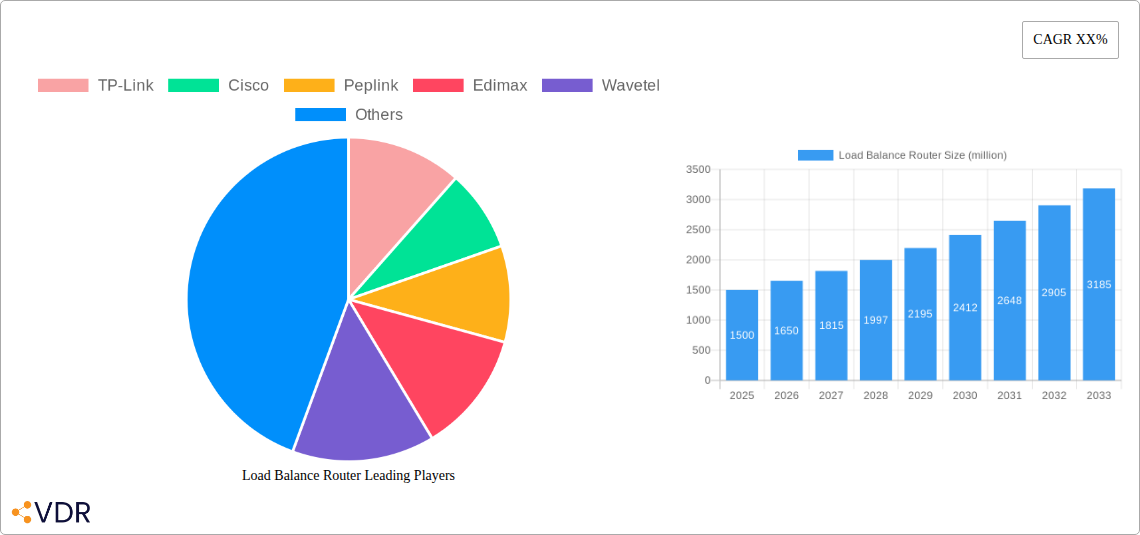
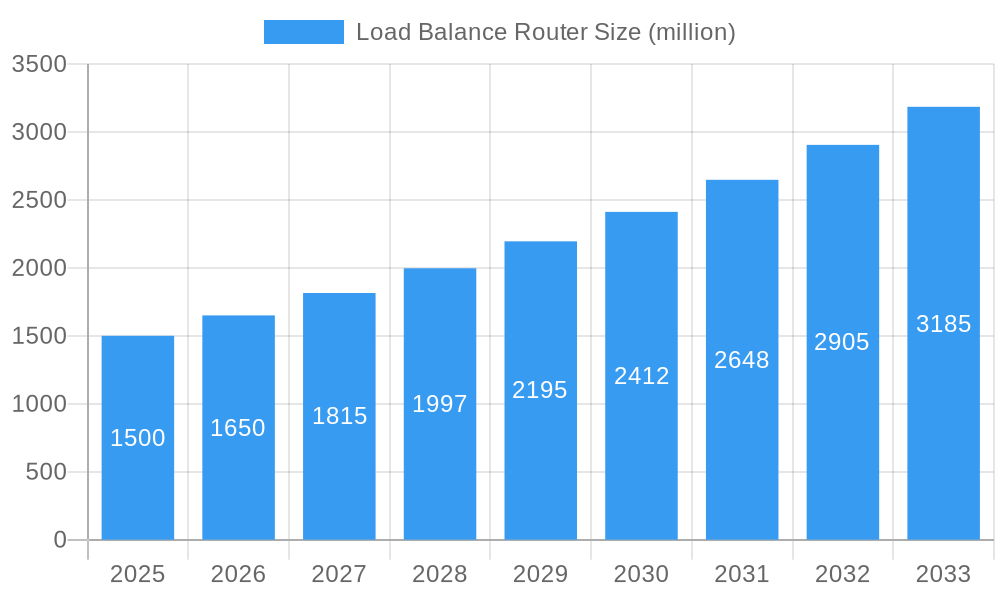
Load Balance Router Market Size (In Billion)
Despite the positive growth trajectory, the market faces certain challenges. High initial investment costs associated with implementing load balancing solutions can be a barrier to entry for small and medium-sized enterprises (SMEs). Furthermore, the complexity of configuring and managing these systems can pose a hurdle for organizations lacking the necessary technical expertise. However, the emergence of cloud-based load balancing services and managed services offerings is gradually mitigating these concerns, making load balancing solutions more accessible to a wider range of users. The competitive landscape is marked by both established players and emerging vendors, leading to continuous innovation and price competition, benefiting end-users. Looking forward, the market is projected to witness sustained growth, with the adoption of 5G and the expansion of edge computing further driving demand in the coming years.
Load Balance Router Company Market Share
Load Balance Router Market Report: 2019-2033
This comprehensive report provides a detailed analysis of the Load Balance Router market, encompassing market dynamics, growth trends, regional dominance, product landscape, key players, and future outlook. The study period spans from 2019 to 2033, with 2025 serving as the base and estimated year. The forecast period extends from 2025 to 2033, and the historical period covers 2019-2024. The report caters to industry professionals, investors, and businesses seeking in-depth insights into this rapidly evolving market segment. The parent market is Networking Equipment and the child market is Load Balancing Solutions.
Load Balance Router Market Dynamics & Structure
The Load Balance Router market, valued at $xx million in 2024, is characterized by a moderately concentrated landscape with key players like TP-Link, Cisco, Peplink, and Huawei holding significant market share. Technological innovation, driven by advancements in software-defined networking (SDN) and network function virtualization (NFV), is a primary growth driver. However, regulatory compliance and the emergence of competitive technologies such as cloud-based load balancing solutions pose challenges.
- Market Concentration: The top 5 players hold approximately xx% of the market share in 2024.
- Technological Innovation: Advancements in SDN and NFV are driving adoption of intelligent load balancing features.
- Regulatory Frameworks: Compliance with data privacy regulations influences market dynamics.
- Competitive Substitutes: Cloud-based load balancing is emerging as a key competitor.
- End-User Demographics: Growth is driven by increasing demand from data centers, enterprises, and telecom providers.
- M&A Trends: The number of M&A deals in the load balancing sector between 2019-2024 averaged xx per year, with a total market value of $xx million.
Load Balance Router Growth Trends & Insights
The Load Balance Router market exhibited a CAGR of xx% during the historical period (2019-2024), reaching a value of $xx million in 2024. This growth is attributed to factors such as the increasing adoption of cloud computing, the rise of IoT devices, and the expanding demand for high-bandwidth applications. Market penetration in key sectors like data centers and enterprises remains relatively high, while opportunities exist in expanding adoption within smaller businesses and the residential sector. Technological disruptions, such as the integration of AI and machine learning for intelligent load balancing, are further fueling market expansion. Consumer behavior shifts toward higher bandwidth needs and enhanced network reliability are driving demand for sophisticated load balancing solutions. The forecast period projects a CAGR of xx% from 2025-2033.
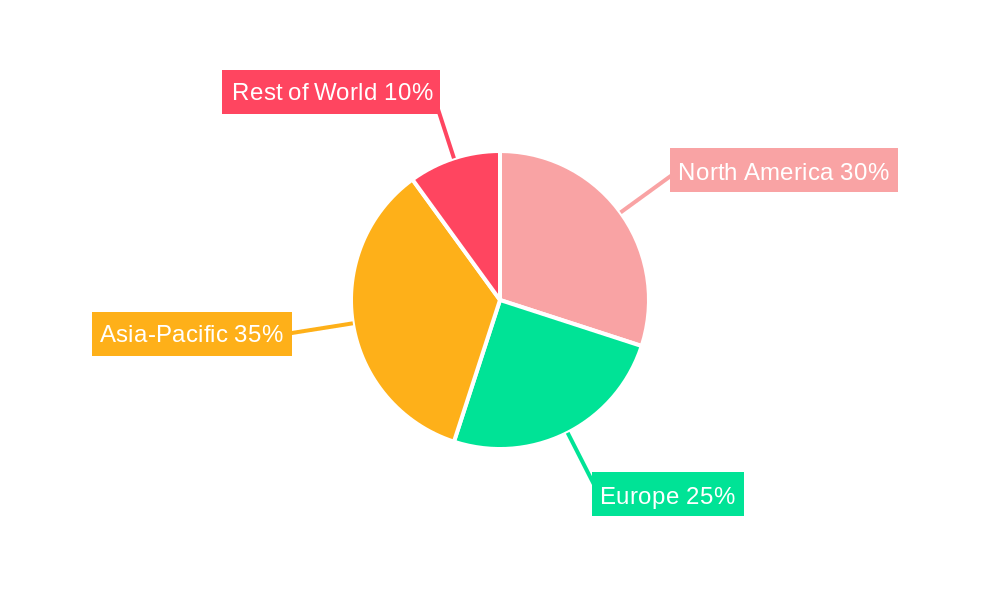
Dominant Regions, Countries, or Segments in Load Balance Router
North America currently holds the largest market share in the Load Balance Router market, driven by strong technological advancements, robust infrastructure, and high adoption rates in the enterprise and data center sectors. Asia-Pacific is a rapidly growing region, witnessing increasing demand from developing economies.
- North America: High adoption rates, advanced infrastructure, and significant investments in data centers drive market dominance.
- Asia-Pacific: Rapid economic growth, increasing internet penetration, and rising demand for high-bandwidth applications fuel strong growth.
- Europe: Steady growth driven by increasing digitalization across various industries.
Load Balance Router Product Landscape
Load Balance routers are evolving beyond basic load distribution, incorporating advanced features like application-level load balancing, content delivery network (CDN) integration, and sophisticated traffic management algorithms. These improvements enhance network performance, availability, and security. Unique selling propositions include advanced QoS capabilities, granular control over traffic flow, and seamless integration with existing network infrastructure.
Key Drivers, Barriers & Challenges in Load Balance Router
Key Drivers:
- The burgeoning adoption of cloud computing and the growth of data centers are key drivers.
- The rise of IoT devices and the increasing need for high-bandwidth applications fuel market demand.
- Advancements in SDN and NFV technologies create new opportunities for load balancing solutions.
Challenges:
- The competitive landscape, with both established players and emerging cloud-based solutions, presents a significant challenge. This rivalry impacts pricing and profit margins.
- Supply chain disruptions caused by geopolitical factors or component shortages can impact product availability and prices.
- Regulatory compliance and data security concerns can increase development costs and complexity.
Emerging Opportunities in Load Balance Router
- The expanding 5G network infrastructure presents significant opportunities for advanced load balancing solutions.
- The integration of AI and machine learning for intelligent load balancing opens avenues for innovation.
- Untapped markets in developing economies offer considerable growth potential.
Growth Accelerators in the Load Balance Router Industry
Strategic partnerships between load balancer manufacturers and cloud providers are accelerating market growth. Technological advancements, particularly in AI-powered solutions and edge computing, further fuel expansion. Expanding into new markets, especially in developing economies, presents considerable growth opportunities.
Notable Milestones in Load Balance Router Sector
- 2020: Several major vendors launched new load balancing routers with enhanced AI capabilities.
- 2022: A significant merger between two key players in the market reshaped the competitive landscape.
- 2023: The introduction of several new open-source load balancing solutions.
In-Depth Load Balance Router Market Outlook
The Load Balance Router market is poised for robust growth over the next decade, driven by increasing demand from various sectors. Strategic investments in R&D, innovative product development, and expansion into new markets will be crucial for success. The integration of AI and machine learning presents significant opportunities for enhanced performance, efficiency, and scalability.
Load Balance Router Segmentation
-
1. Application
- 1.1. Telecom Operators
- 1.2. Enterprise
- 1.3. Government
- 1.4. Other
-
2. Types
- 2.1. Dual WAN Load Balance Router
- 2.2. Quad WAN Load Balance Router
- 2.3. Eight WAN Load Balance Router
- 2.4. Other
Load Balance Router Segmentation By Geography
-
1. North America
- 1.1. United States
- 1.2. Canada
- 1.3. Mexico
-
2. South America
- 2.1. Brazil
- 2.2. Argentina
- 2.3. Rest of South America
-
3. Europe
- 3.1. United Kingdom
- 3.2. Germany
- 3.3. France
- 3.4. Italy
- 3.5. Spain
- 3.6. Russia
- 3.7. Benelux
- 3.8. Nordics
- 3.9. Rest of Europe
-
4. Middle East & Africa
- 4.1. Turkey
- 4.2. Israel
- 4.3. GCC
- 4.4. North Africa
- 4.5. South Africa
- 4.6. Rest of Middle East & Africa
-
5. Asia Pacific
- 5.1. China
- 5.2. India
- 5.3. Japan
- 5.4. South Korea
- 5.5. ASEAN
- 5.6. Oceania
- 5.7. Rest of Asia Pacific
Load Balance Router Regional Market Share
Geographic Coverage of Load Balance Router
Load Balance Router REPORT HIGHLIGHTS
| Aspects | Details |
|---|---|
| Study Period | 2020-2034 |
| Base Year | 2025 |
| Estimated Year | 2026 |
| Forecast Period | 2026-2034 |
| Historical Period | 2020-2025 |
| Growth Rate | CAGR of 6.34% from 2020-2034 |
| Segmentation |
|
Table of Contents
- 1. Introduction
- 1.1. Research Scope
- 1.2. Market Segmentation
- 1.3. Research Objective
- 1.4. Definitions and Assumptions
- 2. Executive Summary
- 2.1. Market Snapshot
- 3. Market Dynamics
- 3.1. Market Drivers
- 3.2. Market Restrains
- 3.3. Market Trends
- 3.4. Market Opportunities
- 4. Market Factor Analysis
- 4.1. Porters Five Forces
- 4.1.1. Bargaining Power of Suppliers
- 4.1.2. Bargaining Power of Buyers
- 4.1.3. Threat of New Entrants
- 4.1.4. Threat of Substitutes
- 4.1.5. Competitive Rivalry
- 4.2. PESTEL analysis
- 4.3. BCG Analysis
- 4.3.1. Stars (High Growth, High Market Share)
- 4.3.2. Cash Cows (Low Growth, High Market Share)
- 4.3.3. Question Mark (High Growth, Low Market Share)
- 4.3.4. Dogs (Low Growth, Low Market Share)
- 4.4. Ansoff Matrix Analysis
- 4.5. Supply Chain Analysis
- 4.6. Regulatory Landscape
- 4.7. Current Market Potential and Opportunity Assessment (TAM–SAM–SOM Framework)
- 4.8. VDR Analyst Note
- 4.1. Porters Five Forces
- 5. Market Analysis, Insights and Forecast 2021-2033
- 5.1. Market Analysis, Insights and Forecast - by Application
- 5.1.1. Telecom Operators
- 5.1.2. Enterprise
- 5.1.3. Government
- 5.1.4. Other
- 5.2. Market Analysis, Insights and Forecast - by Types
- 5.2.1. Dual WAN Load Balance Router
- 5.2.2. Quad WAN Load Balance Router
- 5.2.3. Eight WAN Load Balance Router
- 5.2.4. Other
- 5.3. Market Analysis, Insights and Forecast - by Region
- 5.3.1. North America
- 5.3.2. South America
- 5.3.3. Europe
- 5.3.4. Middle East & Africa
- 5.3.5. Asia Pacific
- 5.1. Market Analysis, Insights and Forecast - by Application
- 6. Global Load Balance Router Analysis, Insights and Forecast, 2021-2033
- 6.1. Market Analysis, Insights and Forecast - by Application
- 6.1.1. Telecom Operators
- 6.1.2. Enterprise
- 6.1.3. Government
- 6.1.4. Other
- 6.2. Market Analysis, Insights and Forecast - by Types
- 6.2.1. Dual WAN Load Balance Router
- 6.2.2. Quad WAN Load Balance Router
- 6.2.3. Eight WAN Load Balance Router
- 6.2.4. Other
- 6.1. Market Analysis, Insights and Forecast - by Application
- 7. North America Load Balance Router Analysis, Insights and Forecast, 2021-2033
- 7.1. Market Analysis, Insights and Forecast - by Application
- 7.1.1. Telecom Operators
- 7.1.2. Enterprise
- 7.1.3. Government
- 7.1.4. Other
- 7.2. Market Analysis, Insights and Forecast - by Types
- 7.2.1. Dual WAN Load Balance Router
- 7.2.2. Quad WAN Load Balance Router
- 7.2.3. Eight WAN Load Balance Router
- 7.2.4. Other
- 7.1. Market Analysis, Insights and Forecast - by Application
- 8. South America Load Balance Router Analysis, Insights and Forecast, 2021-2033
- 8.1. Market Analysis, Insights and Forecast - by Application
- 8.1.1. Telecom Operators
- 8.1.2. Enterprise
- 8.1.3. Government
- 8.1.4. Other
- 8.2. Market Analysis, Insights and Forecast - by Types
- 8.2.1. Dual WAN Load Balance Router
- 8.2.2. Quad WAN Load Balance Router
- 8.2.3. Eight WAN Load Balance Router
- 8.2.4. Other
- 8.1. Market Analysis, Insights and Forecast - by Application
- 9. Europe Load Balance Router Analysis, Insights and Forecast, 2021-2033
- 9.1. Market Analysis, Insights and Forecast - by Application
- 9.1.1. Telecom Operators
- 9.1.2. Enterprise
- 9.1.3. Government
- 9.1.4. Other
- 9.2. Market Analysis, Insights and Forecast - by Types
- 9.2.1. Dual WAN Load Balance Router
- 9.2.2. Quad WAN Load Balance Router
- 9.2.3. Eight WAN Load Balance Router
- 9.2.4. Other
- 9.1. Market Analysis, Insights and Forecast - by Application
- 10. Middle East & Africa Load Balance Router Analysis, Insights and Forecast, 2021-2033
- 10.1. Market Analysis, Insights and Forecast - by Application
- 10.1.1. Telecom Operators
- 10.1.2. Enterprise
- 10.1.3. Government
- 10.1.4. Other
- 10.2. Market Analysis, Insights and Forecast - by Types
- 10.2.1. Dual WAN Load Balance Router
- 10.2.2. Quad WAN Load Balance Router
- 10.2.3. Eight WAN Load Balance Router
- 10.2.4. Other
- 10.1. Market Analysis, Insights and Forecast - by Application
- 11. Asia Pacific Load Balance Router Analysis, Insights and Forecast, 2021-2033
- 11.1. Market Analysis, Insights and Forecast - by Application
- 11.1.1. Telecom Operators
- 11.1.2. Enterprise
- 11.1.3. Government
- 11.1.4. Other
- 11.2. Market Analysis, Insights and Forecast - by Types
- 11.2.1. Dual WAN Load Balance Router
- 11.2.2. Quad WAN Load Balance Router
- 11.2.3. Eight WAN Load Balance Router
- 11.2.4. Other
- 11.1. Market Analysis, Insights and Forecast - by Application
- 12. Competitive Analysis
- 12.1. Company Profiles
- 12.1.1 TP-Link
- 12.1.1.1. Company Overview
- 12.1.1.2. Products
- 12.1.1.3. Company Financials
- 12.1.1.4. SWOT Analysis
- 12.1.2 Cisco
- 12.1.2.1. Company Overview
- 12.1.2.2. Products
- 12.1.2.3. Company Financials
- 12.1.2.4. SWOT Analysis
- 12.1.3 Peplink
- 12.1.3.1. Company Overview
- 12.1.3.2. Products
- 12.1.3.3. Company Financials
- 12.1.3.4. SWOT Analysis
- 12.1.4 Edimax
- 12.1.4.1. Company Overview
- 12.1.4.2. Products
- 12.1.4.3. Company Financials
- 12.1.4.4. SWOT Analysis
- 12.1.5 Wavetel
- 12.1.5.1. Company Overview
- 12.1.5.2. Products
- 12.1.5.3. Company Financials
- 12.1.5.4. SWOT Analysis
- 12.1.6 Huawei
- 12.1.6.1. Company Overview
- 12.1.6.2. Products
- 12.1.6.3. Company Financials
- 12.1.6.4. SWOT Analysis
- 12.1.7 H3C
- 12.1.7.1. Company Overview
- 12.1.7.2. Products
- 12.1.7.3. Company Financials
- 12.1.7.4. SWOT Analysis
- 12.1.8 Fujian Star-net Communication
- 12.1.8.1. Company Overview
- 12.1.8.2. Products
- 12.1.8.3. Company Financials
- 12.1.8.4. SWOT Analysis
- 12.1.9 Tsinghua Unigroup
- 12.1.9.1. Company Overview
- 12.1.9.2. Products
- 12.1.9.3. Company Financials
- 12.1.9.4. SWOT Analysis
- 12.1.10 Beijing InHand Networks Technology
- 12.1.10.1. Company Overview
- 12.1.10.2. Products
- 12.1.10.3. Company Financials
- 12.1.10.4. SWOT Analysis
- 12.1.1 TP-Link
- 12.2. Market Entropy
- 12.2.1 Company's Key Areas Served
- 12.2.2 Recent Developments
- 12.3. Company Market Share Analysis 2025
- 12.3.1 Top 5 Companies Market Share Analysis
- 12.3.2 Top 3 Companies Market Share Analysis
- 12.4. List of Potential Customers
- 13. Research Methodology
List of Figures
- Figure 1: Global Load Balance Router Revenue Breakdown (undefined, %) by Region 2025 & 2033
- Figure 2: Global Load Balance Router Volume Breakdown (K, %) by Region 2025 & 2033
- Figure 3: North America Load Balance Router Revenue (undefined), by Application 2025 & 2033
- Figure 4: North America Load Balance Router Volume (K), by Application 2025 & 2033
- Figure 5: North America Load Balance Router Revenue Share (%), by Application 2025 & 2033
- Figure 6: North America Load Balance Router Volume Share (%), by Application 2025 & 2033
- Figure 7: North America Load Balance Router Revenue (undefined), by Types 2025 & 2033
- Figure 8: North America Load Balance Router Volume (K), by Types 2025 & 2033
- Figure 9: North America Load Balance Router Revenue Share (%), by Types 2025 & 2033
- Figure 10: North America Load Balance Router Volume Share (%), by Types 2025 & 2033
- Figure 11: North America Load Balance Router Revenue (undefined), by Country 2025 & 2033
- Figure 12: North America Load Balance Router Volume (K), by Country 2025 & 2033
- Figure 13: North America Load Balance Router Revenue Share (%), by Country 2025 & 2033
- Figure 14: North America Load Balance Router Volume Share (%), by Country 2025 & 2033
- Figure 15: South America Load Balance Router Revenue (undefined), by Application 2025 & 2033
- Figure 16: South America Load Balance Router Volume (K), by Application 2025 & 2033
- Figure 17: South America Load Balance Router Revenue Share (%), by Application 2025 & 2033
- Figure 18: South America Load Balance Router Volume Share (%), by Application 2025 & 2033
- Figure 19: South America Load Balance Router Revenue (undefined), by Types 2025 & 2033
- Figure 20: South America Load Balance Router Volume (K), by Types 2025 & 2033
- Figure 21: South America Load Balance Router Revenue Share (%), by Types 2025 & 2033
- Figure 22: South America Load Balance Router Volume Share (%), by Types 2025 & 2033
- Figure 23: South America Load Balance Router Revenue (undefined), by Country 2025 & 2033
- Figure 24: South America Load Balance Router Volume (K), by Country 2025 & 2033
- Figure 25: South America Load Balance Router Revenue Share (%), by Country 2025 & 2033
- Figure 26: South America Load Balance Router Volume Share (%), by Country 2025 & 2033
- Figure 27: Europe Load Balance Router Revenue (undefined), by Application 2025 & 2033
- Figure 28: Europe Load Balance Router Volume (K), by Application 2025 & 2033
- Figure 29: Europe Load Balance Router Revenue Share (%), by Application 2025 & 2033
- Figure 30: Europe Load Balance Router Volume Share (%), by Application 2025 & 2033
- Figure 31: Europe Load Balance Router Revenue (undefined), by Types 2025 & 2033
- Figure 32: Europe Load Balance Router Volume (K), by Types 2025 & 2033
- Figure 33: Europe Load Balance Router Revenue Share (%), by Types 2025 & 2033
- Figure 34: Europe Load Balance Router Volume Share (%), by Types 2025 & 2033
- Figure 35: Europe Load Balance Router Revenue (undefined), by Country 2025 & 2033
- Figure 36: Europe Load Balance Router Volume (K), by Country 2025 & 2033
- Figure 37: Europe Load Balance Router Revenue Share (%), by Country 2025 & 2033
- Figure 38: Europe Load Balance Router Volume Share (%), by Country 2025 & 2033
- Figure 39: Middle East & Africa Load Balance Router Revenue (undefined), by Application 2025 & 2033
- Figure 40: Middle East & Africa Load Balance Router Volume (K), by Application 2025 & 2033
- Figure 41: Middle East & Africa Load Balance Router Revenue Share (%), by Application 2025 & 2033
- Figure 42: Middle East & Africa Load Balance Router Volume Share (%), by Application 2025 & 2033
- Figure 43: Middle East & Africa Load Balance Router Revenue (undefined), by Types 2025 & 2033
- Figure 44: Middle East & Africa Load Balance Router Volume (K), by Types 2025 & 2033
- Figure 45: Middle East & Africa Load Balance Router Revenue Share (%), by Types 2025 & 2033
- Figure 46: Middle East & Africa Load Balance Router Volume Share (%), by Types 2025 & 2033
- Figure 47: Middle East & Africa Load Balance Router Revenue (undefined), by Country 2025 & 2033
- Figure 48: Middle East & Africa Load Balance Router Volume (K), by Country 2025 & 2033
- Figure 49: Middle East & Africa Load Balance Router Revenue Share (%), by Country 2025 & 2033
- Figure 50: Middle East & Africa Load Balance Router Volume Share (%), by Country 2025 & 2033
- Figure 51: Asia Pacific Load Balance Router Revenue (undefined), by Application 2025 & 2033
- Figure 52: Asia Pacific Load Balance Router Volume (K), by Application 2025 & 2033
- Figure 53: Asia Pacific Load Balance Router Revenue Share (%), by Application 2025 & 2033
- Figure 54: Asia Pacific Load Balance Router Volume Share (%), by Application 2025 & 2033
- Figure 55: Asia Pacific Load Balance Router Revenue (undefined), by Types 2025 & 2033
- Figure 56: Asia Pacific Load Balance Router Volume (K), by Types 2025 & 2033
- Figure 57: Asia Pacific Load Balance Router Revenue Share (%), by Types 2025 & 2033
- Figure 58: Asia Pacific Load Balance Router Volume Share (%), by Types 2025 & 2033
- Figure 59: Asia Pacific Load Balance Router Revenue (undefined), by Country 2025 & 2033
- Figure 60: Asia Pacific Load Balance Router Volume (K), by Country 2025 & 2033
- Figure 61: Asia Pacific Load Balance Router Revenue Share (%), by Country 2025 & 2033
- Figure 62: Asia Pacific Load Balance Router Volume Share (%), by Country 2025 & 2033
List of Tables
- Table 1: Global Load Balance Router Revenue undefined Forecast, by Application 2020 & 2033
- Table 2: Global Load Balance Router Volume K Forecast, by Application 2020 & 2033
- Table 3: Global Load Balance Router Revenue undefined Forecast, by Types 2020 & 2033
- Table 4: Global Load Balance Router Volume K Forecast, by Types 2020 & 2033
- Table 5: Global Load Balance Router Revenue undefined Forecast, by Region 2020 & 2033
- Table 6: Global Load Balance Router Volume K Forecast, by Region 2020 & 2033
- Table 7: Global Load Balance Router Revenue undefined Forecast, by Application 2020 & 2033
- Table 8: Global Load Balance Router Volume K Forecast, by Application 2020 & 2033
- Table 9: Global Load Balance Router Revenue undefined Forecast, by Types 2020 & 2033
- Table 10: Global Load Balance Router Volume K Forecast, by Types 2020 & 2033
- Table 11: Global Load Balance Router Revenue undefined Forecast, by Country 2020 & 2033
- Table 12: Global Load Balance Router Volume K Forecast, by Country 2020 & 2033
- Table 13: United States Load Balance Router Revenue (undefined) Forecast, by Application 2020 & 2033
- Table 14: United States Load Balance Router Volume (K) Forecast, by Application 2020 & 2033
- Table 15: Canada Load Balance Router Revenue (undefined) Forecast, by Application 2020 & 2033
- Table 16: Canada Load Balance Router Volume (K) Forecast, by Application 2020 & 2033
- Table 17: Mexico Load Balance Router Revenue (undefined) Forecast, by Application 2020 & 2033
- Table 18: Mexico Load Balance Router Volume (K) Forecast, by Application 2020 & 2033
- Table 19: Global Load Balance Router Revenue undefined Forecast, by Application 2020 & 2033
- Table 20: Global Load Balance Router Volume K Forecast, by Application 2020 & 2033
- Table 21: Global Load Balance Router Revenue undefined Forecast, by Types 2020 & 2033
- Table 22: Global Load Balance Router Volume K Forecast, by Types 2020 & 2033
- Table 23: Global Load Balance Router Revenue undefined Forecast, by Country 2020 & 2033
- Table 24: Global Load Balance Router Volume K Forecast, by Country 2020 & 2033
- Table 25: Brazil Load Balance Router Revenue (undefined) Forecast, by Application 2020 & 2033
- Table 26: Brazil Load Balance Router Volume (K) Forecast, by Application 2020 & 2033
- Table 27: Argentina Load Balance Router Revenue (undefined) Forecast, by Application 2020 & 2033
- Table 28: Argentina Load Balance Router Volume (K) Forecast, by Application 2020 & 2033
- Table 29: Rest of South America Load Balance Router Revenue (undefined) Forecast, by Application 2020 & 2033
- Table 30: Rest of South America Load Balance Router Volume (K) Forecast, by Application 2020 & 2033
- Table 31: Global Load Balance Router Revenue undefined Forecast, by Application 2020 & 2033
- Table 32: Global Load Balance Router Volume K Forecast, by Application 2020 & 2033
- Table 33: Global Load Balance Router Revenue undefined Forecast, by Types 2020 & 2033
- Table 34: Global Load Balance Router Volume K Forecast, by Types 2020 & 2033
- Table 35: Global Load Balance Router Revenue undefined Forecast, by Country 2020 & 2033
- Table 36: Global Load Balance Router Volume K Forecast, by Country 2020 & 2033
- Table 37: United Kingdom Load Balance Router Revenue (undefined) Forecast, by Application 2020 & 2033
- Table 38: United Kingdom Load Balance Router Volume (K) Forecast, by Application 2020 & 2033
- Table 39: Germany Load Balance Router Revenue (undefined) Forecast, by Application 2020 & 2033
- Table 40: Germany Load Balance Router Volume (K) Forecast, by Application 2020 & 2033
- Table 41: France Load Balance Router Revenue (undefined) Forecast, by Application 2020 & 2033
- Table 42: France Load Balance Router Volume (K) Forecast, by Application 2020 & 2033
- Table 43: Italy Load Balance Router Revenue (undefined) Forecast, by Application 2020 & 2033
- Table 44: Italy Load Balance Router Volume (K) Forecast, by Application 2020 & 2033
- Table 45: Spain Load Balance Router Revenue (undefined) Forecast, by Application 2020 & 2033
- Table 46: Spain Load Balance Router Volume (K) Forecast, by Application 2020 & 2033
- Table 47: Russia Load Balance Router Revenue (undefined) Forecast, by Application 2020 & 2033
- Table 48: Russia Load Balance Router Volume (K) Forecast, by Application 2020 & 2033
- Table 49: Benelux Load Balance Router Revenue (undefined) Forecast, by Application 2020 & 2033
- Table 50: Benelux Load Balance Router Volume (K) Forecast, by Application 2020 & 2033
- Table 51: Nordics Load Balance Router Revenue (undefined) Forecast, by Application 2020 & 2033
- Table 52: Nordics Load Balance Router Volume (K) Forecast, by Application 2020 & 2033
- Table 53: Rest of Europe Load Balance Router Revenue (undefined) Forecast, by Application 2020 & 2033
- Table 54: Rest of Europe Load Balance Router Volume (K) Forecast, by Application 2020 & 2033
- Table 55: Global Load Balance Router Revenue undefined Forecast, by Application 2020 & 2033
- Table 56: Global Load Balance Router Volume K Forecast, by Application 2020 & 2033
- Table 57: Global Load Balance Router Revenue undefined Forecast, by Types 2020 & 2033
- Table 58: Global Load Balance Router Volume K Forecast, by Types 2020 & 2033
- Table 59: Global Load Balance Router Revenue undefined Forecast, by Country 2020 & 2033
- Table 60: Global Load Balance Router Volume K Forecast, by Country 2020 & 2033
- Table 61: Turkey Load Balance Router Revenue (undefined) Forecast, by Application 2020 & 2033
- Table 62: Turkey Load Balance Router Volume (K) Forecast, by Application 2020 & 2033
- Table 63: Israel Load Balance Router Revenue (undefined) Forecast, by Application 2020 & 2033
- Table 64: Israel Load Balance Router Volume (K) Forecast, by Application 2020 & 2033
- Table 65: GCC Load Balance Router Revenue (undefined) Forecast, by Application 2020 & 2033
- Table 66: GCC Load Balance Router Volume (K) Forecast, by Application 2020 & 2033
- Table 67: North Africa Load Balance Router Revenue (undefined) Forecast, by Application 2020 & 2033
- Table 68: North Africa Load Balance Router Volume (K) Forecast, by Application 2020 & 2033
- Table 69: South Africa Load Balance Router Revenue (undefined) Forecast, by Application 2020 & 2033
- Table 70: South Africa Load Balance Router Volume (K) Forecast, by Application 2020 & 2033
- Table 71: Rest of Middle East & Africa Load Balance Router Revenue (undefined) Forecast, by Application 2020 & 2033
- Table 72: Rest of Middle East & Africa Load Balance Router Volume (K) Forecast, by Application 2020 & 2033
- Table 73: Global Load Balance Router Revenue undefined Forecast, by Application 2020 & 2033
- Table 74: Global Load Balance Router Volume K Forecast, by Application 2020 & 2033
- Table 75: Global Load Balance Router Revenue undefined Forecast, by Types 2020 & 2033
- Table 76: Global Load Balance Router Volume K Forecast, by Types 2020 & 2033
- Table 77: Global Load Balance Router Revenue undefined Forecast, by Country 2020 & 2033
- Table 78: Global Load Balance Router Volume K Forecast, by Country 2020 & 2033
- Table 79: China Load Balance Router Revenue (undefined) Forecast, by Application 2020 & 2033
- Table 80: China Load Balance Router Volume (K) Forecast, by Application 2020 & 2033
- Table 81: India Load Balance Router Revenue (undefined) Forecast, by Application 2020 & 2033
- Table 82: India Load Balance Router Volume (K) Forecast, by Application 2020 & 2033
- Table 83: Japan Load Balance Router Revenue (undefined) Forecast, by Application 2020 & 2033
- Table 84: Japan Load Balance Router Volume (K) Forecast, by Application 2020 & 2033
- Table 85: South Korea Load Balance Router Revenue (undefined) Forecast, by Application 2020 & 2033
- Table 86: South Korea Load Balance Router Volume (K) Forecast, by Application 2020 & 2033
- Table 87: ASEAN Load Balance Router Revenue (undefined) Forecast, by Application 2020 & 2033
- Table 88: ASEAN Load Balance Router Volume (K) Forecast, by Application 2020 & 2033
- Table 89: Oceania Load Balance Router Revenue (undefined) Forecast, by Application 2020 & 2033
- Table 90: Oceania Load Balance Router Volume (K) Forecast, by Application 2020 & 2033
- Table 91: Rest of Asia Pacific Load Balance Router Revenue (undefined) Forecast, by Application 2020 & 2033
- Table 92: Rest of Asia Pacific Load Balance Router Volume (K) Forecast, by Application 2020 & 2033
Frequently Asked Questions
1. What is the projected Compound Annual Growth Rate (CAGR) of the Load Balance Router?
The projected CAGR is approximately 6.34%.
2. Which companies are prominent players in the Load Balance Router?
Key companies in the market include TP-Link, Cisco, Peplink, Edimax, Wavetel, Huawei, H3C, Fujian Star-net Communication, Tsinghua Unigroup, Beijing InHand Networks Technology.
3. What are the main segments of the Load Balance Router?
The market segments include Application, Types.
4. Can you provide details about the market size?
The market size is estimated to be USD XXX N/A as of 2022.
5. What are some drivers contributing to market growth?
N/A
6. What are the notable trends driving market growth?
N/A
7. Are there any restraints impacting market growth?
N/A
8. Can you provide examples of recent developments in the market?
N/A
9. What pricing options are available for accessing the report?
Pricing options include single-user, multi-user, and enterprise licenses priced at USD 3950.00, USD 5925.00, and USD 7900.00 respectively.
10. Is the market size provided in terms of value or volume?
The market size is provided in terms of value, measured in N/A and volume, measured in K.
11. Are there any specific market keywords associated with the report?
Yes, the market keyword associated with the report is "Load Balance Router," which aids in identifying and referencing the specific market segment covered.
12. How do I determine which pricing option suits my needs best?
The pricing options vary based on user requirements and access needs. Individual users may opt for single-user licenses, while businesses requiring broader access may choose multi-user or enterprise licenses for cost-effective access to the report.
13. Are there any additional resources or data provided in the Load Balance Router report?
While the report offers comprehensive insights, it's advisable to review the specific contents or supplementary materials provided to ascertain if additional resources or data are available.
14. How can I stay updated on further developments or reports in the Load Balance Router?
To stay informed about further developments, trends, and reports in the Load Balance Router, consider subscribing to industry newsletters, following relevant companies and organizations, or regularly checking reputable industry news sources and publications.
Methodology
Step 1 - Identification of Relevant Samples Size from Population Database


Step 2 - Approaches for Defining Global Market Size (Value, Volume* & Price*)

Note*: In applicable scenarios
Step 3 - Data Sources
Primary Research
- Web Analytics
- Survey Reports
- Research Institute
- Latest Research Reports
- Opinion Leaders
Secondary Research
- Annual Reports
- White Paper
- Latest Press Release
- Industry Association
- Paid Database
- Investor Presentations

Step 4 - Data Triangulation
Involves using different sources of information in order to increase the validity of a study
These sources are likely to be stakeholders in a program - participants, other researchers, program staff, other community members, and so on.
Then we put all data in single framework & apply various statistical tools to find out the dynamic on the market.
During the analysis stage, feedback from the stakeholder groups would be compared to determine areas of agreement as well as areas of divergence

