

Key Insights
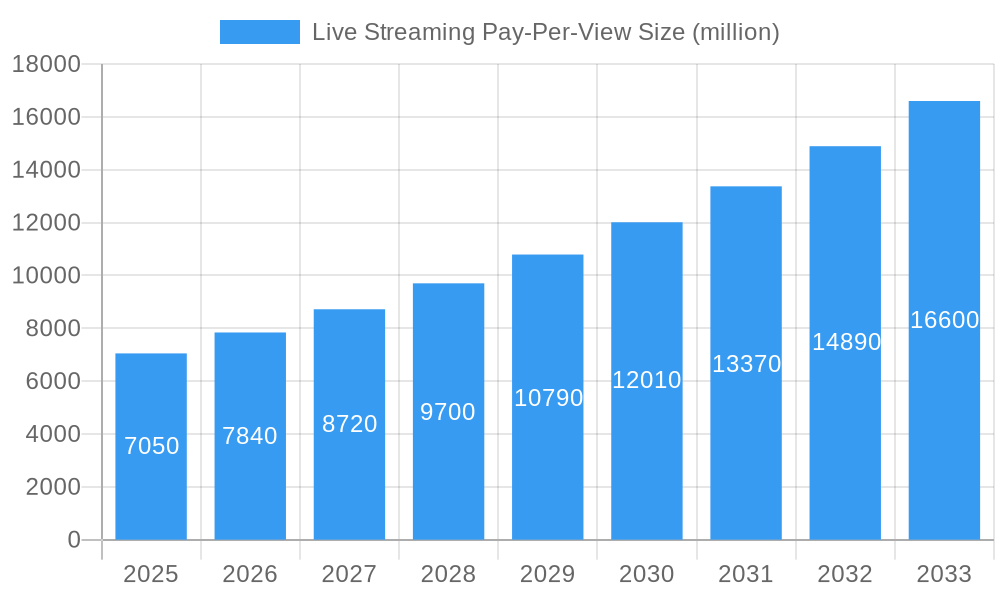
The Live Streaming Pay-Per-View (PPV) market is poised for substantial growth, projected to reach $7.05 billion in 2025, with a remarkable Compound Annual Growth Rate (CAGR) of 11.21% anticipated through 2033. This expansion is largely fueled by the escalating demand for premium, on-demand content across various sectors. The media and entertainment industry, in particular, is a significant driver, leveraging PPV models for major sporting events, exclusive movie premieres, and high-profile concerts. Educational institutions are also increasingly adopting PPV for specialized workshops, masterclasses, and virtual conferences, broadening the market's reach. Furthermore, the convenience and accessibility offered by cloud-based PPV solutions are significantly contributing to market penetration, allowing both content creators and consumers to engage seamlessly.
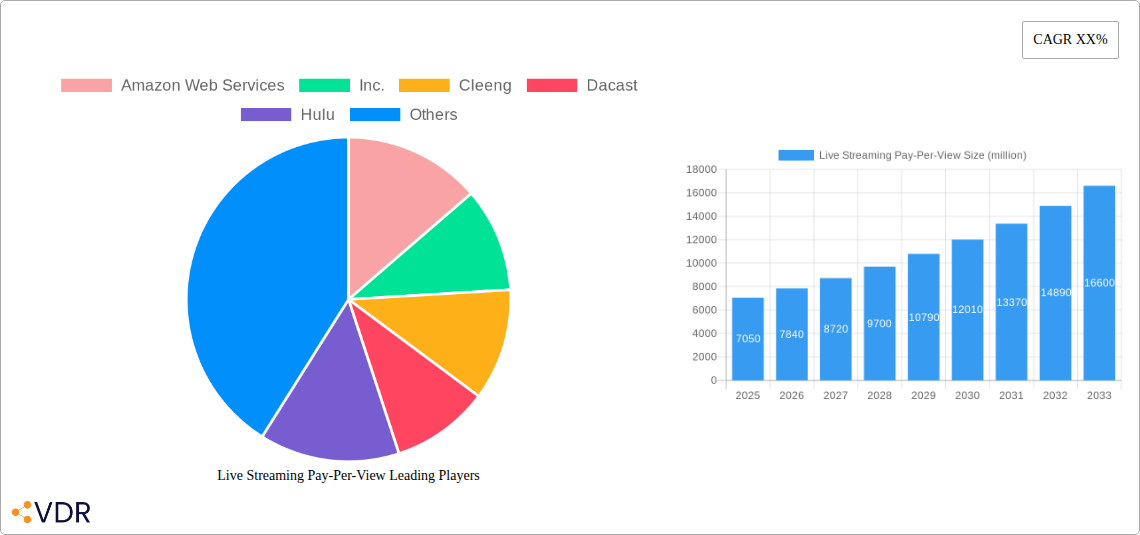
Live Streaming Pay-Per-View Market Size (In Billion)
Despite the robust growth trajectory, certain restraints could influence the market's pace. Piracy and unauthorized access remain persistent challenges, requiring robust digital rights management and security measures from service providers. The high cost of content acquisition for premium events and the need for significant investment in streaming infrastructure can also pose barriers to entry for smaller players. However, these challenges are being actively addressed through technological advancements and evolving business models. The market is witnessing a surge in innovation, with companies focusing on enhanced user experiences, interactive features, and flexible pricing strategies to capture a larger audience. The increasing adoption of high-definition and 4K streaming, coupled with the rise of mobile viewing, further underscores the dynamic and evolving nature of the Live Streaming PPV market.
Live Streaming Pay-Per-View Company Market Share
Live Streaming Pay-Per-View Market Report: Unlocking Global Revenue Streams
This comprehensive report delves into the dynamic Live Streaming Pay-Per-View (PPV) market, exploring its trajectory from 2019 to 2033. With the base year and estimated year at 2025, and a detailed forecast period of 2025–2033, this analysis provides actionable insights for industry stakeholders. Examining historical data from 2019–2024, we offer a deep understanding of market evolution, technological advancements, and emerging trends in this rapidly expanding sector. Discover the lucrative opportunities within the parent market of live streaming services and the child market of digital content monetization, identifying key growth drivers and strategic imperatives.
Live Streaming Pay-Per-View Market Dynamics & Structure
The Live Streaming Pay-Per-View market is characterized by a dynamic interplay of market concentration, rapid technological innovation, evolving regulatory frameworks, and the constant threat of competitive product substitutes. The industry is witnessing a strategic shift towards specialized platforms and integrated solutions, with key players like Amazon Web Services, Inc., Cleeng, Dacast, and Vimeo leading the charge in providing robust infrastructure and monetization tools. Technological innovation drivers include advancements in video encoding, CDN efficiency, and secure payment gateway integration, all crucial for delivering seamless PPV experiences. Regulatory frameworks, particularly concerning content rights and data privacy, are also shaping market operations. End-user demographics are increasingly diverse, with a growing demand for premium content across sports, media and entertainment, and educational sectors. Mergers and acquisitions (M&A) trends are evident as companies seek to expand their market reach, acquire new technologies, and consolidate their positions. For instance, strategic acquisitions of smaller technology providers by larger media conglomerates are becoming more prevalent, aiming to build comprehensive PPV ecosystems.
- Market Concentration: Moderate to high, with a few dominant players offering comprehensive solutions.
- Technological Innovation Drivers: 4K streaming, low-latency delivery, AI-powered content recommendation, robust DRM.
- Regulatory Frameworks: Content licensing agreements, regional broadcasting rights, GDPR and CCPA compliance.
- Competitive Product Substitutes: Subscription-based VOD services, free ad-supported streaming.
- End-User Demographics: Primarily younger, tech-savvy audiences, but expanding to broader demographics for niche content.
- M&A Trends: Consolidation for market share, acquisition of specialized technology firms, strategic alliances for content distribution.
Live Streaming Pay-Per-View Growth Trends & Insights
The Live Streaming Pay-Per-View market is poised for substantial growth, driven by a confluence of factors that are reshaping how audiences consume premium digital content. The global market size, projected to reach USD 75.8 billion by 2025, is expected to witness a robust Compound Annual Growth Rate (CAGR) of 18.5% from 2025 to 2033, culminating in an estimated USD 250.1 billion by 2033. This remarkable expansion is fueled by increasing internet penetration, the proliferation of smart devices, and a growing consumer appetite for immediate access to live events and exclusive digital experiences. Adoption rates for PPV models are skyrocketing across various segments, particularly within Sports (estimated at USD 30.2 billion by 2025, growing to USD 100.3 billion by 2033) and Media and Entertainment (estimated at USD 35.6 billion by 2025, growing to USD 125.4 billion by 2033).
Technological disruptions are at the forefront of this growth. The widespread adoption of cloud-based PPV solutions, projected to account for 70% of the market share by 2025 and reaching USD 52.7 billion, offers scalability, flexibility, and cost-efficiency for content providers. This contrasts with on-premises solutions, which are expected to grow at a slower pace, reaching USD 23.1 billion by 2025. Consumer behavior shifts are also playing a pivotal role. Audiences are increasingly willing to pay for high-quality, exclusive live content that they cannot access elsewhere, including major sporting events, concerts, theatrical performances, and premium educational courses. The convenience of PPV, allowing viewers to purchase access to specific events without long-term commitments, resonates strongly with modern consumption habits. Furthermore, the integration of advanced analytics and personalized content delivery is enhancing viewer engagement and driving repeat purchases, solidifying PPV as a sustainable revenue model for content creators and distributors. The market penetration of PPV services continues to rise, indicating a fundamental shift in the monetization landscape of digital media.
Dominant Regions, Countries, or Segments in Live Streaming Pay-Per-View
The Live Streaming Pay-Per-View market is experiencing significant growth, with North America emerging as the dominant region, driven by its mature digital infrastructure, high consumer disposable income, and established media and entertainment industry. The region's market share in 2025 is estimated at 40%, translating to a value of USD 30.3 billion, and is projected to reach USD 100.0 billion by 2033. Key drivers of this dominance include the prevalence of major sports leagues like the NFL, NBA, and MLB, which consistently leverage PPV for exclusive game broadcasts and special events. The United States, in particular, accounts for a substantial portion of this regional dominance, with its advanced internet penetration and widespread adoption of streaming technologies. Economic policies that support digital innovation and robust intellectual property rights protection further bolster the market's growth in North America.
Among the segments, Media and Entertainment is the largest contributor, with an estimated market size of USD 35.6 billion in 2025, and is projected to grow to USD 125.4 billion by 2033. This segment encompasses a wide array of content, including live concerts, movie premieres, award shows, and exclusive series launches, all of which are increasingly being monetized through PPV models. The Sports segment is a close second, valued at USD 30.2 billion in 2025 and expected to reach USD 100.3 billion by 2033. This growth is fueled by the global appeal of major sporting events like the Olympics, World Cup, and Formula 1 races, where PPV offers a crucial revenue stream for broadcasters and rights holders. The Education segment, while smaller, is also experiencing significant expansion, with PPV being utilized for premium online courses, workshops, and masterclasses, estimated at USD 7.2 billion in 2025 and projected to grow to USD 20.7 billion by 2033.
In terms of Types, Cloud-based PPV solutions are leading the charge, projected to reach USD 52.7 billion by 2025 and continuing their ascent. This dominance is attributed to the scalability, accessibility, and cost-effectiveness of cloud infrastructure, enabling content providers of all sizes to deploy PPV services efficiently. On-premises solutions, while still relevant for certain large enterprises with specific security or customization needs, are expected to grow at a more modest pace, reaching USD 23.1 billion by 2025. The synergy between these segments and types, supported by companies like Amazon Web Services, Inc., Cleeng, Dacast, and Vimeo, creates a fertile ground for continued market expansion and innovation in the global Live Streaming Pay-Per-View arena.
Live Streaming Pay-Per-View Product Landscape
The Live Streaming Pay-Per-View product landscape is defined by continuous innovation in video delivery, content security, and user experience. Products now feature advanced features such as ultra-low latency streaming, 4K and HDR support, and robust Digital Rights Management (DRM) to protect premium content. Monetization platforms are increasingly sophisticated, offering flexible pricing models, tiered access, and integrated payment gateways that support multiple currencies and payment methods. Companies like Vimeo and Dacast provide end-to-end solutions, enabling seamless content upload, live broadcasting, and secure PPV event management. Unique selling propositions often revolve around ease of integration, scalability, and the ability to create branded, immersive viewing experiences. Technological advancements are also focusing on AI-powered analytics to understand viewer behavior and optimize content delivery and pricing strategies for maximum revenue.
Key Drivers, Barriers & Challenges in Live Streaming Pay-Per-View
Key Drivers:
- Increasing Demand for Premium Live Content: Consumers are willing to pay for exclusive access to major sporting events, concerts, and unique entertainment experiences, driving PPV adoption.
- Technological Advancements: Improvements in internet speed, streaming quality (4K, HDR), and low-latency delivery enhance viewer experience and encourage paid access.
- Growth of Digital Monetization Strategies: Content creators and distributors are actively seeking diversified revenue streams beyond advertising and subscriptions.
- Proliferation of Smart Devices: Widespread availability of smartphones, smart TVs, and tablets makes accessing live PPV content more convenient for a broader audience.
- Scalability of Cloud Infrastructure: Cloud-based solutions offered by providers like Amazon Web Services, Inc. and Dacast enable efficient and cost-effective PPV deployment.
Barriers & Challenges:
- Content Piracy and Copyright Infringement: The ease of illegal distribution poses a significant threat, necessitating robust DRM and anti-piracy measures.
- High Infrastructure Costs for Content Providers: Setting up and maintaining high-quality streaming infrastructure can be capital-intensive, although cloud solutions mitigate this.
- Competition from Subscription Services: Established SVOD platforms offer vast libraries of content, posing a challenge to standalone PPV offerings.
- Regulatory Hurdles and Regional Licensing: Navigating complex international broadcasting rights and varying regional regulations can be challenging.
- User Experience Issues: Technical glitches, buffering, and payment processing errors can lead to customer dissatisfaction and churn.
Emerging Opportunities in Live Streaming Pay-Per-View
Emerging opportunities in the Live Streaming Pay-Per-View market are abundant, particularly in niche content areas and underserved markets. The rise of esports continues to present a significant growth avenue, with dedicated PPV models for tournaments and exclusive team content. Furthermore, the educational sector is increasingly adopting PPV for high-value online courses and specialized training programs, opening up a substantial market for expert-led content. There is also an opportunity to cater to independent artists and smaller event organizers who can leverage affordable PPV platforms to directly monetize their creations and performances. The integration of interactive features, such as live Q&A sessions, virtual meet-and-greets, and real-time fan engagement tools, presents a chance to enhance the PPV experience and drive higher conversion rates.
Growth Accelerators in the Live Streaming Pay-Per-View Industry
Several catalysts are accelerating growth in the Live Streaming Pay-Per-View industry. The ongoing digital transformation across all sectors is a primary driver, pushing businesses to explore new revenue models. Strategic partnerships between content providers and technology platforms, such as collaborations between media companies and cloud service providers like Amazon Web Services, Inc., are crucial for expanding reach and enhancing capabilities. Technological breakthroughs in areas like 5G deployment will enable even more seamless and high-quality live streaming experiences, further boosting consumer adoption. Market expansion strategies, including the penetration of emerging economies with growing internet access and a burgeoning middle class, represent significant long-term growth potential. The increasing demand for live, interactive content, fueled by a desire for shared experiences in a digitally connected world, is also a key growth accelerator.
Key Players Shaping the Live Streaming Pay-Per-View Market
- Amazon Web Services, Inc.
- Cleeng
- Dacast
- Hulu
- InPlayer Ltd.
- StreamingVideoProvider
- Muvi LLC
- Sky Group
- StreamGate Pty Ltd.
- Phando
- PrestoSports
- Vimeo
- Wowza Media Systems, LLC
Notable Milestones in Live Streaming Pay-Per-View Sector
- 2019: Increased adoption of 4K streaming for major sporting events, enhancing viewer experience.
- 2020: Surge in PPV for virtual concerts and online performances due to global event cancellations.
- 2021: Expansion of PPV for niche sports and e-sports tournaments, attracting dedicated fan bases.
- 2022: Enhanced integration of secure payment gateways and DRM solutions by platform providers.
- 2023: Growth of hybrid PPV models combining live access with on-demand replays.
- 2024: Increased use of AI for personalized content recommendations and dynamic pricing in PPV.
In-Depth Live Streaming Pay-Per-View Market Outlook
The Live Streaming Pay-Per-View market is poised for sustained and robust growth, driven by a confluence of technological innovation, evolving consumer behavior, and strategic market expansion. The future market potential is immense, with key growth accelerators including the widespread adoption of 5G, enabling higher quality and more accessible live streams, and the continued demand for exclusive, premium content across diverse verticals like sports, entertainment, and education. Strategic opportunities lie in developing more interactive and engaging PPV experiences, integrating advanced analytics to personalize offerings, and targeting emerging markets with growing digital access. Content providers and technology enablers that can adapt to these trends and offer flexible, secure, and user-friendly PPV solutions will be best positioned to capitalize on this dynamic and lucrative market.
Live Streaming Pay-Per-View Segmentation
-
1. Application
- 1.1. Sports
- 1.2. Media and Entertainment
- 1.3. Education
- 1.4. Others
-
2. Types
- 2.1. Cloud
- 2.2. On-Premises
Live Streaming Pay-Per-View Segmentation By Geography
-
1. North America
- 1.1. United States
- 1.2. Canada
- 1.3. Mexico
-
2. South America
- 2.1. Brazil
- 2.2. Argentina
- 2.3. Rest of South America
-
3. Europe
- 3.1. United Kingdom
- 3.2. Germany
- 3.3. France
- 3.4. Italy
- 3.5. Spain
- 3.6. Russia
- 3.7. Benelux
- 3.8. Nordics
- 3.9. Rest of Europe
-
4. Middle East & Africa
- 4.1. Turkey
- 4.2. Israel
- 4.3. GCC
- 4.4. North Africa
- 4.5. South Africa
- 4.6. Rest of Middle East & Africa
-
5. Asia Pacific
- 5.1. China
- 5.2. India
- 5.3. Japan
- 5.4. South Korea
- 5.5. ASEAN
- 5.6. Oceania
- 5.7. Rest of Asia Pacific
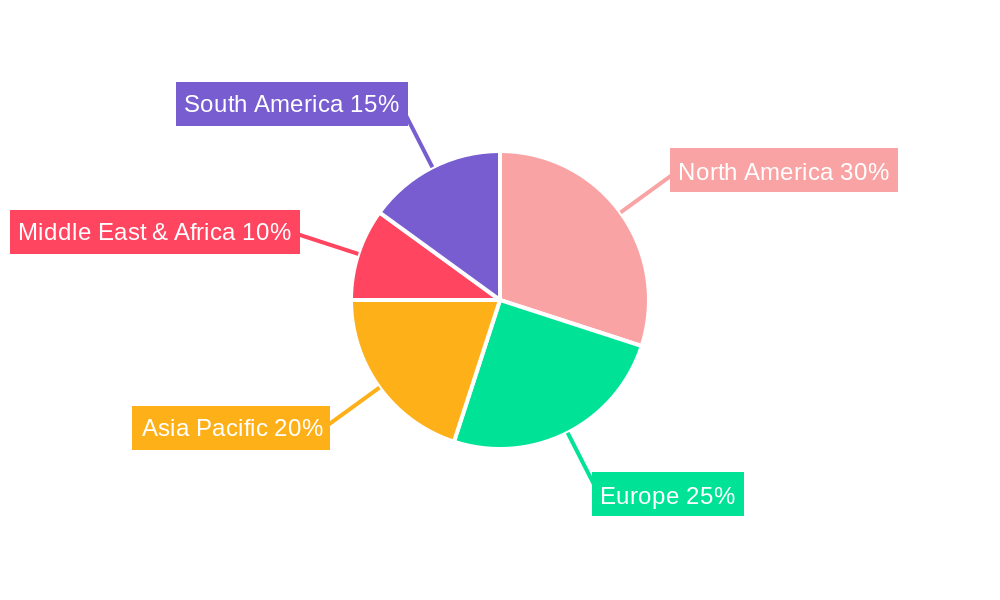
Live Streaming Pay-Per-View Regional Market Share
Geographic Coverage of Live Streaming Pay-Per-View
Live Streaming Pay-Per-View REPORT HIGHLIGHTS
| Aspects | Details |
|---|---|
| Study Period | 2020-2034 |
| Base Year | 2025 |
| Estimated Year | 2026 |
| Forecast Period | 2026-2034 |
| Historical Period | 2020-2025 |
| Growth Rate | CAGR of 11.21% from 2020-2034 |
| Segmentation |
|
Table of Contents
- 1. Introduction
- 1.1. Research Scope
- 1.2. Market Segmentation
- 1.3. Research Objective
- 1.4. Definitions and Assumptions
- 2. Executive Summary
- 2.1. Market Snapshot
- 3. Market Dynamics
- 3.1. Market Drivers
- 3.2. Market Restrains
- 3.3. Market Trends
- 3.4. Market Opportunities
- 4. Market Factor Analysis
- 4.1. Porters Five Forces
- 4.1.1. Bargaining Power of Suppliers
- 4.1.2. Bargaining Power of Buyers
- 4.1.3. Threat of New Entrants
- 4.1.4. Threat of Substitutes
- 4.1.5. Competitive Rivalry
- 4.2. PESTEL analysis
- 4.3. BCG Analysis
- 4.3.1. Stars (High Growth, High Market Share)
- 4.3.2. Cash Cows (Low Growth, High Market Share)
- 4.3.3. Question Mark (High Growth, Low Market Share)
- 4.3.4. Dogs (Low Growth, Low Market Share)
- 4.4. Ansoff Matrix Analysis
- 4.5. Supply Chain Analysis
- 4.6. Regulatory Landscape
- 4.7. Current Market Potential and Opportunity Assessment (TAM–SAM–SOM Framework)
- 4.8. VDR Analyst Note
- 4.1. Porters Five Forces
- 5. Market Analysis, Insights and Forecast 2021-2033
- 5.1. Market Analysis, Insights and Forecast - by Application
- 5.1.1. Sports
- 5.1.2. Media and Entertainment
- 5.1.3. Education
- 5.1.4. Others
- 5.2. Market Analysis, Insights and Forecast - by Types
- 5.2.1. Cloud
- 5.2.2. On-Premises
- 5.3. Market Analysis, Insights and Forecast - by Region
- 5.3.1. North America
- 5.3.2. South America
- 5.3.3. Europe
- 5.3.4. Middle East & Africa
- 5.3.5. Asia Pacific
- 5.1. Market Analysis, Insights and Forecast - by Application
- 6. Global Live Streaming Pay-Per-View Analysis, Insights and Forecast, 2021-2033
- 6.1. Market Analysis, Insights and Forecast - by Application
- 6.1.1. Sports
- 6.1.2. Media and Entertainment
- 6.1.3. Education
- 6.1.4. Others
- 6.2. Market Analysis, Insights and Forecast - by Types
- 6.2.1. Cloud
- 6.2.2. On-Premises
- 6.1. Market Analysis, Insights and Forecast - by Application
- 7. North America Live Streaming Pay-Per-View Analysis, Insights and Forecast, 2021-2033
- 7.1. Market Analysis, Insights and Forecast - by Application
- 7.1.1. Sports
- 7.1.2. Media and Entertainment
- 7.1.3. Education
- 7.1.4. Others
- 7.2. Market Analysis, Insights and Forecast - by Types
- 7.2.1. Cloud
- 7.2.2. On-Premises
- 7.1. Market Analysis, Insights and Forecast - by Application
- 8. South America Live Streaming Pay-Per-View Analysis, Insights and Forecast, 2021-2033
- 8.1. Market Analysis, Insights and Forecast - by Application
- 8.1.1. Sports
- 8.1.2. Media and Entertainment
- 8.1.3. Education
- 8.1.4. Others
- 8.2. Market Analysis, Insights and Forecast - by Types
- 8.2.1. Cloud
- 8.2.2. On-Premises
- 8.1. Market Analysis, Insights and Forecast - by Application
- 9. Europe Live Streaming Pay-Per-View Analysis, Insights and Forecast, 2021-2033
- 9.1. Market Analysis, Insights and Forecast - by Application
- 9.1.1. Sports
- 9.1.2. Media and Entertainment
- 9.1.3. Education
- 9.1.4. Others
- 9.2. Market Analysis, Insights and Forecast - by Types
- 9.2.1. Cloud
- 9.2.2. On-Premises
- 9.1. Market Analysis, Insights and Forecast - by Application
- 10. Middle East & Africa Live Streaming Pay-Per-View Analysis, Insights and Forecast, 2021-2033
- 10.1. Market Analysis, Insights and Forecast - by Application
- 10.1.1. Sports
- 10.1.2. Media and Entertainment
- 10.1.3. Education
- 10.1.4. Others
- 10.2. Market Analysis, Insights and Forecast - by Types
- 10.2.1. Cloud
- 10.2.2. On-Premises
- 10.1. Market Analysis, Insights and Forecast - by Application
- 11. Asia Pacific Live Streaming Pay-Per-View Analysis, Insights and Forecast, 2021-2033
- 11.1. Market Analysis, Insights and Forecast - by Application
- 11.1.1. Sports
- 11.1.2. Media and Entertainment
- 11.1.3. Education
- 11.1.4. Others
- 11.2. Market Analysis, Insights and Forecast - by Types
- 11.2.1. Cloud
- 11.2.2. On-Premises
- 11.1. Market Analysis, Insights and Forecast - by Application
- 12. Competitive Analysis
- 12.1. Company Profiles
- 12.1.1 Amazon Web Services
- 12.1.1.1. Company Overview
- 12.1.1.2. Products
- 12.1.1.3. Company Financials
- 12.1.1.4. SWOT Analysis
- 12.1.2 Inc.
- 12.1.2.1. Company Overview
- 12.1.2.2. Products
- 12.1.2.3. Company Financials
- 12.1.2.4. SWOT Analysis
- 12.1.3 Cleeng
- 12.1.3.1. Company Overview
- 12.1.3.2. Products
- 12.1.3.3. Company Financials
- 12.1.3.4. SWOT Analysis
- 12.1.4 Dacast
- 12.1.4.1. Company Overview
- 12.1.4.2. Products
- 12.1.4.3. Company Financials
- 12.1.4.4. SWOT Analysis
- 12.1.5 Hulu
- 12.1.5.1. Company Overview
- 12.1.5.2. Products
- 12.1.5.3. Company Financials
- 12.1.5.4. SWOT Analysis
- 12.1.6 InPlayer Ltd.
- 12.1.6.1. Company Overview
- 12.1.6.2. Products
- 12.1.6.3. Company Financials
- 12.1.6.4. SWOT Analysis
- 12.1.7 StreamingVideoProvider
- 12.1.7.1. Company Overview
- 12.1.7.2. Products
- 12.1.7.3. Company Financials
- 12.1.7.4. SWOT Analysis
- 12.1.8 Muvi LLC
- 12.1.8.1. Company Overview
- 12.1.8.2. Products
- 12.1.8.3. Company Financials
- 12.1.8.4. SWOT Analysis
- 12.1.9 Sky Group
- 12.1.9.1. Company Overview
- 12.1.9.2. Products
- 12.1.9.3. Company Financials
- 12.1.9.4. SWOT Analysis
- 12.1.10 StreamGate Pty Ltd.
- 12.1.10.1. Company Overview
- 12.1.10.2. Products
- 12.1.10.3. Company Financials
- 12.1.10.4. SWOT Analysis
- 12.1.11 Phando
- 12.1.11.1. Company Overview
- 12.1.11.2. Products
- 12.1.11.3. Company Financials
- 12.1.11.4. SWOT Analysis
- 12.1.12 PrestoSports
- 12.1.12.1. Company Overview
- 12.1.12.2. Products
- 12.1.12.3. Company Financials
- 12.1.12.4. SWOT Analysis
- 12.1.13 Vimeo
- 12.1.13.1. Company Overview
- 12.1.13.2. Products
- 12.1.13.3. Company Financials
- 12.1.13.4. SWOT Analysis
- 12.1.14 Wowza Media Systems
- 12.1.14.1. Company Overview
- 12.1.14.2. Products
- 12.1.14.3. Company Financials
- 12.1.14.4. SWOT Analysis
- 12.1.15 LLC
- 12.1.15.1. Company Overview
- 12.1.15.2. Products
- 12.1.15.3. Company Financials
- 12.1.15.4. SWOT Analysis
- 12.1.1 Amazon Web Services
- 12.2. Market Entropy
- 12.2.1 Company's Key Areas Served
- 12.2.2 Recent Developments
- 12.3. Company Market Share Analysis 2025
- 12.3.1 Top 5 Companies Market Share Analysis
- 12.3.2 Top 3 Companies Market Share Analysis
- 12.4. List of Potential Customers
- 13. Research Methodology
List of Figures
- Figure 1: Global Live Streaming Pay-Per-View Revenue Breakdown (undefined, %) by Region 2025 & 2033
- Figure 2: North America Live Streaming Pay-Per-View Revenue (undefined), by Application 2025 & 2033
- Figure 3: North America Live Streaming Pay-Per-View Revenue Share (%), by Application 2025 & 2033
- Figure 4: North America Live Streaming Pay-Per-View Revenue (undefined), by Types 2025 & 2033
- Figure 5: North America Live Streaming Pay-Per-View Revenue Share (%), by Types 2025 & 2033
- Figure 6: North America Live Streaming Pay-Per-View Revenue (undefined), by Country 2025 & 2033
- Figure 7: North America Live Streaming Pay-Per-View Revenue Share (%), by Country 2025 & 2033
- Figure 8: South America Live Streaming Pay-Per-View Revenue (undefined), by Application 2025 & 2033
- Figure 9: South America Live Streaming Pay-Per-View Revenue Share (%), by Application 2025 & 2033
- Figure 10: South America Live Streaming Pay-Per-View Revenue (undefined), by Types 2025 & 2033
- Figure 11: South America Live Streaming Pay-Per-View Revenue Share (%), by Types 2025 & 2033
- Figure 12: South America Live Streaming Pay-Per-View Revenue (undefined), by Country 2025 & 2033
- Figure 13: South America Live Streaming Pay-Per-View Revenue Share (%), by Country 2025 & 2033
- Figure 14: Europe Live Streaming Pay-Per-View Revenue (undefined), by Application 2025 & 2033
- Figure 15: Europe Live Streaming Pay-Per-View Revenue Share (%), by Application 2025 & 2033
- Figure 16: Europe Live Streaming Pay-Per-View Revenue (undefined), by Types 2025 & 2033
- Figure 17: Europe Live Streaming Pay-Per-View Revenue Share (%), by Types 2025 & 2033
- Figure 18: Europe Live Streaming Pay-Per-View Revenue (undefined), by Country 2025 & 2033
- Figure 19: Europe Live Streaming Pay-Per-View Revenue Share (%), by Country 2025 & 2033
- Figure 20: Middle East & Africa Live Streaming Pay-Per-View Revenue (undefined), by Application 2025 & 2033
- Figure 21: Middle East & Africa Live Streaming Pay-Per-View Revenue Share (%), by Application 2025 & 2033
- Figure 22: Middle East & Africa Live Streaming Pay-Per-View Revenue (undefined), by Types 2025 & 2033
- Figure 23: Middle East & Africa Live Streaming Pay-Per-View Revenue Share (%), by Types 2025 & 2033
- Figure 24: Middle East & Africa Live Streaming Pay-Per-View Revenue (undefined), by Country 2025 & 2033
- Figure 25: Middle East & Africa Live Streaming Pay-Per-View Revenue Share (%), by Country 2025 & 2033
- Figure 26: Asia Pacific Live Streaming Pay-Per-View Revenue (undefined), by Application 2025 & 2033
- Figure 27: Asia Pacific Live Streaming Pay-Per-View Revenue Share (%), by Application 2025 & 2033
- Figure 28: Asia Pacific Live Streaming Pay-Per-View Revenue (undefined), by Types 2025 & 2033
- Figure 29: Asia Pacific Live Streaming Pay-Per-View Revenue Share (%), by Types 2025 & 2033
- Figure 30: Asia Pacific Live Streaming Pay-Per-View Revenue (undefined), by Country 2025 & 2033
- Figure 31: Asia Pacific Live Streaming Pay-Per-View Revenue Share (%), by Country 2025 & 2033
List of Tables
- Table 1: Global Live Streaming Pay-Per-View Revenue undefined Forecast, by Application 2020 & 2033
- Table 2: Global Live Streaming Pay-Per-View Revenue undefined Forecast, by Types 2020 & 2033
- Table 3: Global Live Streaming Pay-Per-View Revenue undefined Forecast, by Region 2020 & 2033
- Table 4: Global Live Streaming Pay-Per-View Revenue undefined Forecast, by Application 2020 & 2033
- Table 5: Global Live Streaming Pay-Per-View Revenue undefined Forecast, by Types 2020 & 2033
- Table 6: Global Live Streaming Pay-Per-View Revenue undefined Forecast, by Country 2020 & 2033
- Table 7: United States Live Streaming Pay-Per-View Revenue (undefined) Forecast, by Application 2020 & 2033
- Table 8: Canada Live Streaming Pay-Per-View Revenue (undefined) Forecast, by Application 2020 & 2033
- Table 9: Mexico Live Streaming Pay-Per-View Revenue (undefined) Forecast, by Application 2020 & 2033
- Table 10: Global Live Streaming Pay-Per-View Revenue undefined Forecast, by Application 2020 & 2033
- Table 11: Global Live Streaming Pay-Per-View Revenue undefined Forecast, by Types 2020 & 2033
- Table 12: Global Live Streaming Pay-Per-View Revenue undefined Forecast, by Country 2020 & 2033
- Table 13: Brazil Live Streaming Pay-Per-View Revenue (undefined) Forecast, by Application 2020 & 2033
- Table 14: Argentina Live Streaming Pay-Per-View Revenue (undefined) Forecast, by Application 2020 & 2033
- Table 15: Rest of South America Live Streaming Pay-Per-View Revenue (undefined) Forecast, by Application 2020 & 2033
- Table 16: Global Live Streaming Pay-Per-View Revenue undefined Forecast, by Application 2020 & 2033
- Table 17: Global Live Streaming Pay-Per-View Revenue undefined Forecast, by Types 2020 & 2033
- Table 18: Global Live Streaming Pay-Per-View Revenue undefined Forecast, by Country 2020 & 2033
- Table 19: United Kingdom Live Streaming Pay-Per-View Revenue (undefined) Forecast, by Application 2020 & 2033
- Table 20: Germany Live Streaming Pay-Per-View Revenue (undefined) Forecast, by Application 2020 & 2033
- Table 21: France Live Streaming Pay-Per-View Revenue (undefined) Forecast, by Application 2020 & 2033
- Table 22: Italy Live Streaming Pay-Per-View Revenue (undefined) Forecast, by Application 2020 & 2033
- Table 23: Spain Live Streaming Pay-Per-View Revenue (undefined) Forecast, by Application 2020 & 2033
- Table 24: Russia Live Streaming Pay-Per-View Revenue (undefined) Forecast, by Application 2020 & 2033
- Table 25: Benelux Live Streaming Pay-Per-View Revenue (undefined) Forecast, by Application 2020 & 2033
- Table 26: Nordics Live Streaming Pay-Per-View Revenue (undefined) Forecast, by Application 2020 & 2033
- Table 27: Rest of Europe Live Streaming Pay-Per-View Revenue (undefined) Forecast, by Application 2020 & 2033
- Table 28: Global Live Streaming Pay-Per-View Revenue undefined Forecast, by Application 2020 & 2033
- Table 29: Global Live Streaming Pay-Per-View Revenue undefined Forecast, by Types 2020 & 2033
- Table 30: Global Live Streaming Pay-Per-View Revenue undefined Forecast, by Country 2020 & 2033
- Table 31: Turkey Live Streaming Pay-Per-View Revenue (undefined) Forecast, by Application 2020 & 2033
- Table 32: Israel Live Streaming Pay-Per-View Revenue (undefined) Forecast, by Application 2020 & 2033
- Table 33: GCC Live Streaming Pay-Per-View Revenue (undefined) Forecast, by Application 2020 & 2033
- Table 34: North Africa Live Streaming Pay-Per-View Revenue (undefined) Forecast, by Application 2020 & 2033
- Table 35: South Africa Live Streaming Pay-Per-View Revenue (undefined) Forecast, by Application 2020 & 2033
- Table 36: Rest of Middle East & Africa Live Streaming Pay-Per-View Revenue (undefined) Forecast, by Application 2020 & 2033
- Table 37: Global Live Streaming Pay-Per-View Revenue undefined Forecast, by Application 2020 & 2033
- Table 38: Global Live Streaming Pay-Per-View Revenue undefined Forecast, by Types 2020 & 2033
- Table 39: Global Live Streaming Pay-Per-View Revenue undefined Forecast, by Country 2020 & 2033
- Table 40: China Live Streaming Pay-Per-View Revenue (undefined) Forecast, by Application 2020 & 2033
- Table 41: India Live Streaming Pay-Per-View Revenue (undefined) Forecast, by Application 2020 & 2033
- Table 42: Japan Live Streaming Pay-Per-View Revenue (undefined) Forecast, by Application 2020 & 2033
- Table 43: South Korea Live Streaming Pay-Per-View Revenue (undefined) Forecast, by Application 2020 & 2033
- Table 44: ASEAN Live Streaming Pay-Per-View Revenue (undefined) Forecast, by Application 2020 & 2033
- Table 45: Oceania Live Streaming Pay-Per-View Revenue (undefined) Forecast, by Application 2020 & 2033
- Table 46: Rest of Asia Pacific Live Streaming Pay-Per-View Revenue (undefined) Forecast, by Application 2020 & 2033
Frequently Asked Questions
1. What is the projected Compound Annual Growth Rate (CAGR) of the Live Streaming Pay-Per-View?
The projected CAGR is approximately 11.21%.
2. Which companies are prominent players in the Live Streaming Pay-Per-View?
Key companies in the market include Amazon Web Services, Inc., Cleeng, Dacast, Hulu, InPlayer Ltd., StreamingVideoProvider, Muvi LLC, Sky Group, StreamGate Pty Ltd., Phando, PrestoSports, Vimeo, Wowza Media Systems, LLC.
3. What are the main segments of the Live Streaming Pay-Per-View?
The market segments include Application, Types.
4. Can you provide details about the market size?
The market size is estimated to be USD XXX N/A as of 2022.
5. What are some drivers contributing to market growth?
N/A
6. What are the notable trends driving market growth?
N/A
7. Are there any restraints impacting market growth?
N/A
8. Can you provide examples of recent developments in the market?
N/A
9. What pricing options are available for accessing the report?
Pricing options include single-user, multi-user, and enterprise licenses priced at USD 2900.00, USD 4350.00, and USD 5800.00 respectively.
10. Is the market size provided in terms of value or volume?
The market size is provided in terms of value, measured in N/A.
11. Are there any specific market keywords associated with the report?
Yes, the market keyword associated with the report is "Live Streaming Pay-Per-View," which aids in identifying and referencing the specific market segment covered.
12. How do I determine which pricing option suits my needs best?
The pricing options vary based on user requirements and access needs. Individual users may opt for single-user licenses, while businesses requiring broader access may choose multi-user or enterprise licenses for cost-effective access to the report.
13. Are there any additional resources or data provided in the Live Streaming Pay-Per-View report?
While the report offers comprehensive insights, it's advisable to review the specific contents or supplementary materials provided to ascertain if additional resources or data are available.
14. How can I stay updated on further developments or reports in the Live Streaming Pay-Per-View?
To stay informed about further developments, trends, and reports in the Live Streaming Pay-Per-View, consider subscribing to industry newsletters, following relevant companies and organizations, or regularly checking reputable industry news sources and publications.
Methodology
Step 1 - Identification of Relevant Samples Size from Population Database


Step 2 - Approaches for Defining Global Market Size (Value, Volume* & Price*)

Note*: In applicable scenarios
Step 3 - Data Sources
Primary Research
- Web Analytics
- Survey Reports
- Research Institute
- Latest Research Reports
- Opinion Leaders
Secondary Research
- Annual Reports
- White Paper
- Latest Press Release
- Industry Association
- Paid Database
- Investor Presentations

Step 4 - Data Triangulation
Involves using different sources of information in order to increase the validity of a study
These sources are likely to be stakeholders in a program - participants, other researchers, program staff, other community members, and so on.
Then we put all data in single framework & apply various statistical tools to find out the dynamic on the market.
During the analysis stage, feedback from the stakeholder groups would be compared to determine areas of agreement as well as areas of divergence