
Key Insights
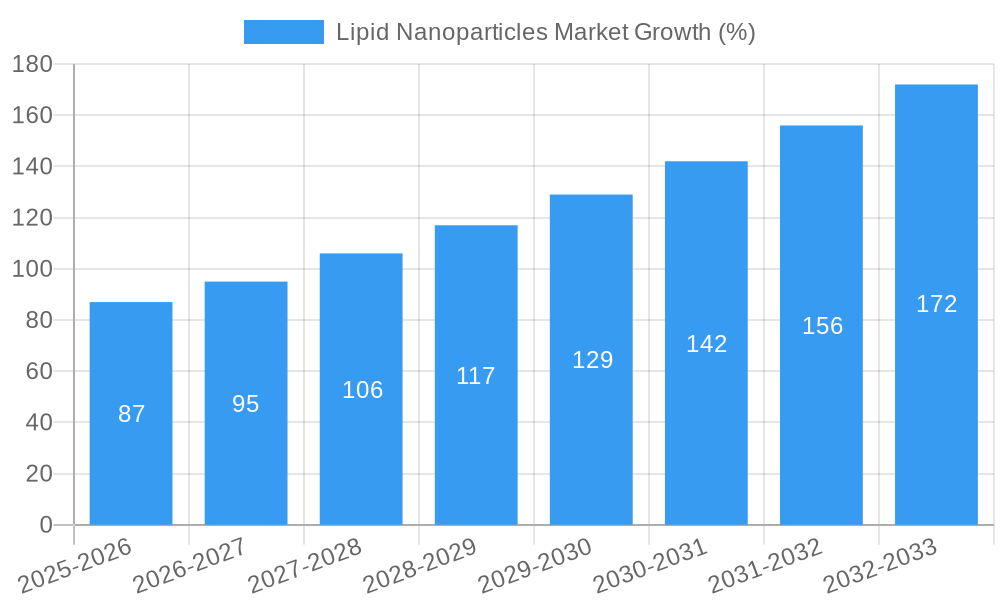
The global lipid nanoparticles (LNP) market is experiencing robust growth, projected to reach a substantial size driven by the increasing demand for advanced drug delivery systems and the expanding pharmaceutical and biotechnology sectors. The market's Compound Annual Growth Rate (CAGR) of 10.54% from 2019 to 2024 indicates a significant upward trajectory. Key drivers include the rising prevalence of chronic diseases necessitating effective therapies, the growing adoption of personalized medicine, and the increasing investments in research and development of novel drug delivery technologies. The market is segmented by end-user (pharmaceutical and biotechnology companies, contract development and manufacturing organizations, and others), type (solid lipid nanoparticles, nanostructured lipid carriers, and others), and application (research and therapeutics). The pharmaceutical and biotechnology sectors are the primary consumers of LNPs, leveraging their unique properties for targeted drug delivery, enhanced bioavailability, and reduced side effects. Solid lipid nanoparticles and nanostructured lipid carriers dominate the type segment, owing to their biocompatibility and ease of production. Therapeutics applications currently hold the largest market share, but research applications are also experiencing rapid expansion. Geographically, North America and Europe currently lead the market due to advanced healthcare infrastructure and strong regulatory support; however, the Asia-Pacific region is expected to witness significant growth in the coming years, fueled by rising healthcare expenditure and a growing patient population. The competitive landscape features a mix of established players and emerging companies, indicating a dynamic and innovative market.
The continued growth of the LNP market is anticipated to be fueled by several factors. Advancements in nanotechnology are leading to the development of more sophisticated and efficient LNP formulations. Government initiatives promoting research and development in drug delivery systems and the growing focus on personalized medicine will provide further impetus to market expansion. While challenges exist, such as regulatory hurdles and complexities in large-scale manufacturing, the overall outlook for the LNP market remains highly positive. The market's segmentation by end-user, type, and application provides opportunities for specialized players to focus on specific niches and capitalize on the unique needs of various sectors within the pharmaceutical and biotechnology landscape. This strategic positioning will be crucial for success in this rapidly evolving market.
Lipid Nanoparticles Market: A Comprehensive Market Report (2019-2033)
This comprehensive report provides a detailed analysis of the Lipid Nanoparticles market, encompassing market dynamics, growth trends, regional segmentation, product landscape, key players, and future outlook. The report covers the period from 2019 to 2033, with a focus on the forecast period of 2025-2033 and a base year of 2025. The market is segmented by end-user (Pharmaceutical and Biotechnology Companies, Contract Development and Manufacturing Organizations, Other End Users), type (Solid Lipid Nanoparticles, Nanostructured Lipid Carriers, Other Types), and application (Research, Therapeutics). The total market size is projected to reach xx Million by 2033, exhibiting a CAGR of xx% during the forecast period. This report is an essential resource for industry professionals, investors, and researchers seeking a deep understanding of this rapidly evolving market.
Lipid Nanoparticles Market Dynamics & Structure
The Lipid Nanoparticles market is characterized by moderate concentration, with several key players dominating the landscape. Technological innovation, particularly in mRNA delivery and targeted therapies, is a significant growth driver. Stringent regulatory frameworks, particularly regarding safety and efficacy, influence market development. Competitive pressure from alternative drug delivery systems exists, but the unique advantages of LNPs—enhanced bioavailability and targeted delivery—maintain market appeal. The market exhibits a high degree of M&A activity, reflecting the industry's dynamism and the consolidation of players.
- Market Concentration: Moderately concentrated, with top 5 players holding approximately xx% market share in 2025.
- Technological Innovation: Focus on advanced lipid compositions, improved targeting capabilities, and scalable manufacturing processes.
- Regulatory Framework: Stringent regulations (e.g., FDA, EMA) drive high development costs but ensure product safety.
- Competitive Substitutes: Liposomes, polymeric nanoparticles, and viral vectors present competitive challenges.
- End-User Demographics: Primarily pharmaceutical and biotechnology companies, with growing involvement from contract manufacturers.
- M&A Trends: xx M&A deals recorded between 2019-2024, indicating a consolidating market.
Lipid Nanoparticles Market Growth Trends & Insights
The Lipid Nanoparticles market is experiencing robust growth, driven by the increasing demand for targeted drug delivery systems and the expansion of mRNA-based therapeutics. The market size has witnessed significant expansion from xx Million in 2019 to an estimated xx Million in 2025. Technological advancements, such as the development of novel lipid formulations and improved manufacturing techniques, further contribute to this growth. The rising adoption of LNPs in clinical trials and their successful application in COVID-19 vaccines have accelerated market penetration. Consumer behavior shifts towards personalized medicine and advanced therapies bolster market growth.
- Market Size Evolution: xx Million (2019) to xx Million (2025) to xx Million (2033).
- CAGR (2025-2033): xx%
- Adoption Rates: Increasing adoption across various therapeutic areas, especially oncology, infectious diseases, and gene therapy.
- Technological Disruptions: Continuous innovation in lipid composition and targeting strategies lead to improved efficacy and safety.
- Consumer Behavior: Growing preference for targeted therapies and personalized medicine fuels demand for LNPs.
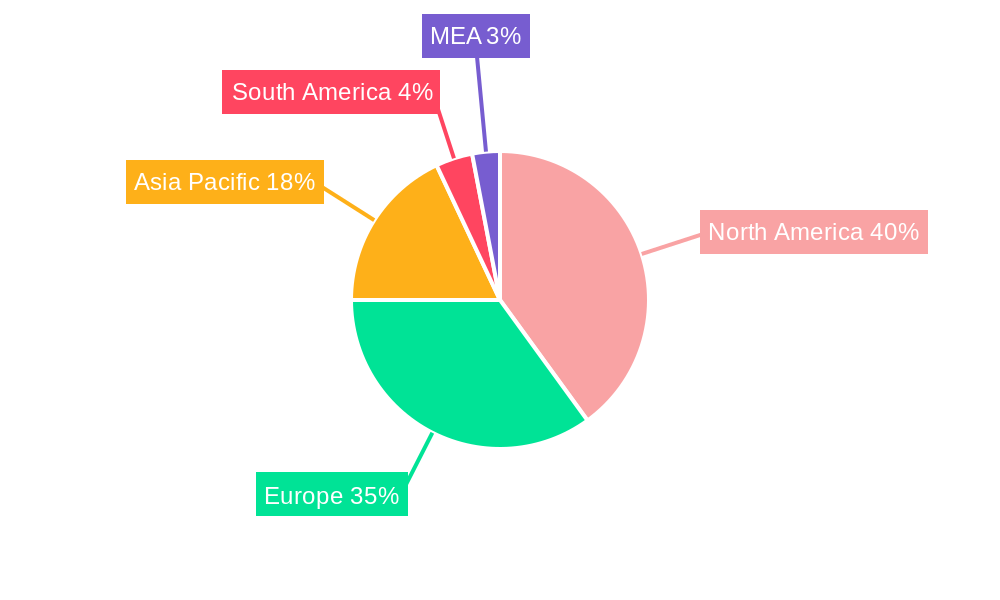
Dominant Regions, Countries, or Segments in Lipid Nanoparticles Market
North America currently dominates the Lipid Nanoparticles market, driven by substantial investments in research and development, a robust pharmaceutical and biotechnology sector, and early adoption of advanced therapeutic modalities. Europe follows as a significant market, characterized by stringent regulatory environments and a strong focus on innovation. The Asia-Pacific region exhibits high growth potential, fueled by rising healthcare expenditure and increasing demand for advanced drug delivery systems.
By End User: Pharmaceutical and Biotechnology Companies hold the largest market share, followed by Contract Development and Manufacturing Organizations (CDMOs).
By Type: Solid Lipid Nanoparticles currently dominate the market due to their established track record and relative ease of manufacturing.
By Application: Therapeutics (specifically mRNA vaccines and gene therapies) holds the majority market share, exceeding research applications.
- North America: High R&D investment, strong regulatory support, and established pharmaceutical industry drive market dominance.
- Europe: Strong focus on innovation, stringent regulatory compliance, and significant presence of key players contribute to market growth.
- Asia-Pacific: Rapidly growing healthcare expenditure, rising prevalence of chronic diseases, and increasing demand for advanced therapies are driving market expansion.
- Market Share (2025): North America (xx%), Europe (xx%), Asia-Pacific (xx%), Rest of World (xx%)
Lipid Nanoparticles Market Product Landscape
The Lipid Nanoparticles market offers a diverse range of products, including solid lipid nanoparticles (SLNs), nanostructured lipid carriers (NLCs), and other specialized formulations. These products are tailored to deliver various therapeutic agents, including mRNA, siRNA, proteins, and small molecule drugs. Key product innovations involve improving lipid composition, enhancing targeted delivery capabilities, and developing scalable manufacturing processes. Unique selling propositions often include improved efficacy, reduced toxicity, and enhanced stability compared to traditional drug delivery methods.
Key Drivers, Barriers & Challenges in Lipid Nanoparticles Market
Key Drivers: The rising prevalence of chronic diseases, the increasing demand for targeted drug delivery systems, and the growing adoption of mRNA-based therapies are key drivers of market growth. Technological advancements in lipid nanoparticle formulations and the development of more efficient manufacturing processes also contribute to this expansion. Government funding and favorable regulatory environments further accelerate market expansion.
Challenges & Restraints: High manufacturing costs, stringent regulatory requirements, and potential toxicity concerns pose challenges to market growth. Competition from alternative drug delivery systems and the need for specialized expertise in formulation and manufacturing can also impede market expansion. Supply chain disruptions due to raw material shortages and the complexity of large-scale manufacturing contribute to additional hurdles.
Emerging Opportunities in Lipid Nanoparticles Market
Emerging opportunities lie in the development of novel lipid formulations for improved targeting and delivery, expansion into new therapeutic areas, personalized medicine approaches, and the exploration of combination therapies. Untapped markets in developing economies also present considerable growth potential.
Growth Accelerators in the Lipid Nanoparticles Market Industry
Strategic partnerships and collaborations between pharmaceutical companies, biotechnology firms, and CDMOs are accelerating market expansion. Investments in research and development, focused on improving lipid formulations and expanding applications, are driving growth. Technological advancements in manufacturing processes and the development of scalable production methods are further enhancing market potential.
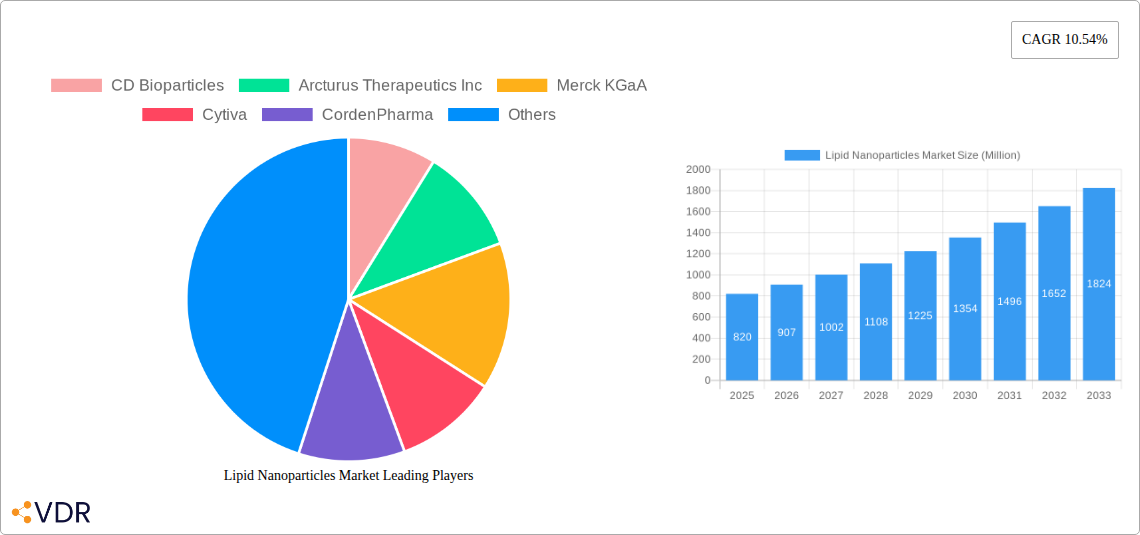
Key Players Shaping the Lipid Nanoparticles Market Market
- CD Bioparticles
- Arcturus Therapeutics Inc
- Merck KGaA
- Cytiva
- CordenPharma
- Croda International PLC
- Ascendia Pharmaceuticals
- Genevant Sciences Corporation
- Acuitas Therapeutics
- BIOVECTRA
Notable Milestones in Lipid Nanoparticles Market Sector
- June 2023: Bayer AG partnered with Acuitas Therapeutics Inc. to develop LNP delivery systems for gene editing and protein replacement programs.
- February 2024: CordenPharma launched LNP Starter Kits for mRNA formulation in developing mRNA-based therapeutics.
In-Depth Lipid Nanoparticles Market Market Outlook
The Lipid Nanoparticles market is poised for continued strong growth, driven by ongoing technological advancements, expanding applications, and strategic partnerships. The future holds significant opportunities for companies that can develop innovative lipid formulations, improve manufacturing processes, and expand into new therapeutic areas. Strategic collaborations, focused research and development, and the successful navigation of regulatory hurdles will be crucial for success in this dynamic market.
Lipid Nanoparticles Market Segmentation
-
1. Type
- 1.1. Solid Lipid Nanoparticles
- 1.2. Nanostructured Lipid Carriers
- 1.3. Other Types
-
2. Application
- 2.1. Research
- 2.2. Therapeutics
-
3. End User
- 3.1. Pharmaceutical and Biotechnology Companies
- 3.2. Contract
- 3.3. Other End Users
Lipid Nanoparticles Market Segmentation By Geography
-
1. North America
- 1.1. United States
- 1.2. Canada
- 1.3. Mexico
-
2. Europe
- 2.1. Germany
- 2.2. United Kingdom
- 2.3. France
- 2.4. Italy
- 2.5. Spain
- 2.6. Rest of Europe
-
3. Asia Pacific
- 3.1. China
- 3.2. Japan
- 3.3. India
- 3.4. Australia
- 3.5. South Korea
- 3.6. Rest of Asia Pacific
- 4. Rest of the World
Lipid Nanoparticles Market REPORT HIGHLIGHTS
| Aspects | Details |
|---|---|
| Study Period | 2019-2033 |
| Base Year | 2024 |
| Estimated Year | 2025 |
| Forecast Period | 2025-2033 |
| Historical Period | 2019-2024 |
| Growth Rate | CAGR of 10.54% from 2019-2033 |
| Segmentation |
|
Table of Contents
- 1. Introduction
- 1.1. Research Scope
- 1.2. Market Segmentation
- 1.3. Research Methodology
- 1.4. Definitions and Assumptions
- 2. Executive Summary
- 2.1. Introduction
- 3. Market Dynamics
- 3.1. Introduction
- 3.2. Market Drivers
- 3.2.1. Increasing Prevalence of Chronic Diseases; Rising Focus Towards Personalized Medicine; Growing Investment for Research and Development of Nanotechnology
- 3.3. Market Restrains
- 3.3.1. Stringent Regulatory Compliance; Expensive Formulation with Limited Loading Capacity
- 3.4. Market Trends
- 3.4.1. Therapeutics Segment is Expected to Witness Significant Growth During the Forecast Period
- 4. Market Factor Analysis
- 4.1. Porters Five Forces
- 4.2. Supply/Value Chain
- 4.3. PESTEL analysis
- 4.4. Market Entropy
- 4.5. Patent/Trademark Analysis
- 5. Global Lipid Nanoparticles Market Analysis, Insights and Forecast, 2019-2031
- 5.1. Market Analysis, Insights and Forecast - by Type
- 5.1.1. Solid Lipid Nanoparticles
- 5.1.2. Nanostructured Lipid Carriers
- 5.1.3. Other Types
- 5.2. Market Analysis, Insights and Forecast - by Application
- 5.2.1. Research
- 5.2.2. Therapeutics
- 5.3. Market Analysis, Insights and Forecast - by End User
- 5.3.1. Pharmaceutical and Biotechnology Companies
- 5.3.2. Contract
- 5.3.3. Other End Users
- 5.4. Market Analysis, Insights and Forecast - by Region
- 5.4.1. North America
- 5.4.2. Europe
- 5.4.3. Asia Pacific
- 5.4.4. Rest of the World
- 5.1. Market Analysis, Insights and Forecast - by Type
- 6. North America Lipid Nanoparticles Market Analysis, Insights and Forecast, 2019-2031
- 6.1. Market Analysis, Insights and Forecast - by Type
- 6.1.1. Solid Lipid Nanoparticles
- 6.1.2. Nanostructured Lipid Carriers
- 6.1.3. Other Types
- 6.2. Market Analysis, Insights and Forecast - by Application
- 6.2.1. Research
- 6.2.2. Therapeutics
- 6.3. Market Analysis, Insights and Forecast - by End User
- 6.3.1. Pharmaceutical and Biotechnology Companies
- 6.3.2. Contract
- 6.3.3. Other End Users
- 6.1. Market Analysis, Insights and Forecast - by Type
- 7. Europe Lipid Nanoparticles Market Analysis, Insights and Forecast, 2019-2031
- 7.1. Market Analysis, Insights and Forecast - by Type
- 7.1.1. Solid Lipid Nanoparticles
- 7.1.2. Nanostructured Lipid Carriers
- 7.1.3. Other Types
- 7.2. Market Analysis, Insights and Forecast - by Application
- 7.2.1. Research
- 7.2.2. Therapeutics
- 7.3. Market Analysis, Insights and Forecast - by End User
- 7.3.1. Pharmaceutical and Biotechnology Companies
- 7.3.2. Contract
- 7.3.3. Other End Users
- 7.1. Market Analysis, Insights and Forecast - by Type
- 8. Asia Pacific Lipid Nanoparticles Market Analysis, Insights and Forecast, 2019-2031
- 8.1. Market Analysis, Insights and Forecast - by Type
- 8.1.1. Solid Lipid Nanoparticles
- 8.1.2. Nanostructured Lipid Carriers
- 8.1.3. Other Types
- 8.2. Market Analysis, Insights and Forecast - by Application
- 8.2.1. Research
- 8.2.2. Therapeutics
- 8.3. Market Analysis, Insights and Forecast - by End User
- 8.3.1. Pharmaceutical and Biotechnology Companies
- 8.3.2. Contract
- 8.3.3. Other End Users
- 8.1. Market Analysis, Insights and Forecast - by Type
- 9. Rest of the World Lipid Nanoparticles Market Analysis, Insights and Forecast, 2019-2031
- 9.1. Market Analysis, Insights and Forecast - by Type
- 9.1.1. Solid Lipid Nanoparticles
- 9.1.2. Nanostructured Lipid Carriers
- 9.1.3. Other Types
- 9.2. Market Analysis, Insights and Forecast - by Application
- 9.2.1. Research
- 9.2.2. Therapeutics
- 9.3. Market Analysis, Insights and Forecast - by End User
- 9.3.1. Pharmaceutical and Biotechnology Companies
- 9.3.2. Contract
- 9.3.3. Other End Users
- 9.1. Market Analysis, Insights and Forecast - by Type
- 10. North America Lipid Nanoparticles Market Analysis, Insights and Forecast, 2019-2031
- 10.1. Market Analysis, Insights and Forecast - By Country/Sub-region
- 10.1.1 United States
- 10.1.2 Canada
- 10.1.3 Mexico
- 11. Europe Lipid Nanoparticles Market Analysis, Insights and Forecast, 2019-2031
- 11.1. Market Analysis, Insights and Forecast - By Country/Sub-region
- 11.1.1 Germany
- 11.1.2 United Kingdom
- 11.1.3 France
- 11.1.4 Spain
- 11.1.5 Italy
- 11.1.6 Spain
- 11.1.7 Belgium
- 11.1.8 Netherland
- 11.1.9 Nordics
- 11.1.10 Rest of Europe
- 12. Asia Pacific Lipid Nanoparticles Market Analysis, Insights and Forecast, 2019-2031
- 12.1. Market Analysis, Insights and Forecast - By Country/Sub-region
- 12.1.1 China
- 12.1.2 Japan
- 12.1.3 India
- 12.1.4 South Korea
- 12.1.5 Southeast Asia
- 12.1.6 Australia
- 12.1.7 Indonesia
- 12.1.8 Phillipes
- 12.1.9 Singapore
- 12.1.10 Thailandc
- 12.1.11 Rest of Asia Pacific
- 13. South America Lipid Nanoparticles Market Analysis, Insights and Forecast, 2019-2031
- 13.1. Market Analysis, Insights and Forecast - By Country/Sub-region
- 13.1.1 Brazil
- 13.1.2 Argentina
- 13.1.3 Peru
- 13.1.4 Chile
- 13.1.5 Colombia
- 13.1.6 Ecuador
- 13.1.7 Venezuela
- 13.1.8 Rest of South America
- 14. North America Lipid Nanoparticles Market Analysis, Insights and Forecast, 2019-2031
- 14.1. Market Analysis, Insights and Forecast - By Country/Sub-region
- 14.1.1 United States
- 14.1.2 Canada
- 14.1.3 Mexico
- 15. MEA Lipid Nanoparticles Market Analysis, Insights and Forecast, 2019-2031
- 15.1. Market Analysis, Insights and Forecast - By Country/Sub-region
- 15.1.1 United Arab Emirates
- 15.1.2 Saudi Arabia
- 15.1.3 South Africa
- 15.1.4 Rest of Middle East and Africa
- 16. Competitive Analysis
- 16.1. Global Market Share Analysis 2024
- 16.2. Company Profiles
- 16.2.1 CD Bioparticles
- 16.2.1.1. Overview
- 16.2.1.2. Products
- 16.2.1.3. SWOT Analysis
- 16.2.1.4. Recent Developments
- 16.2.1.5. Financials (Based on Availability)
- 16.2.2 Arcturus Therapeutics Inc
- 16.2.2.1. Overview
- 16.2.2.2. Products
- 16.2.2.3. SWOT Analysis
- 16.2.2.4. Recent Developments
- 16.2.2.5. Financials (Based on Availability)
- 16.2.3 Merck KGaA
- 16.2.3.1. Overview
- 16.2.3.2. Products
- 16.2.3.3. SWOT Analysis
- 16.2.3.4. Recent Developments
- 16.2.3.5. Financials (Based on Availability)
- 16.2.4 Cytiva
- 16.2.4.1. Overview
- 16.2.4.2. Products
- 16.2.4.3. SWOT Analysis
- 16.2.4.4. Recent Developments
- 16.2.4.5. Financials (Based on Availability)
- 16.2.5 CordenPharma
- 16.2.5.1. Overview
- 16.2.5.2. Products
- 16.2.5.3. SWOT Analysis
- 16.2.5.4. Recent Developments
- 16.2.5.5. Financials (Based on Availability)
- 16.2.6 Croda International PLC
- 16.2.6.1. Overview
- 16.2.6.2. Products
- 16.2.6.3. SWOT Analysis
- 16.2.6.4. Recent Developments
- 16.2.6.5. Financials (Based on Availability)
- 16.2.7 Ascendia Pharmaceuticals
- 16.2.7.1. Overview
- 16.2.7.2. Products
- 16.2.7.3. SWOT Analysis
- 16.2.7.4. Recent Developments
- 16.2.7.5. Financials (Based on Availability)
- 16.2.8 Genevant Sciences Corporation
- 16.2.8.1. Overview
- 16.2.8.2. Products
- 16.2.8.3. SWOT Analysis
- 16.2.8.4. Recent Developments
- 16.2.8.5. Financials (Based on Availability)
- 16.2.9 Acuitas Therapeutics
- 16.2.9.1. Overview
- 16.2.9.2. Products
- 16.2.9.3. SWOT Analysis
- 16.2.9.4. Recent Developments
- 16.2.9.5. Financials (Based on Availability)
- 16.2.10 BIOVECTRA
- 16.2.10.1. Overview
- 16.2.10.2. Products
- 16.2.10.3. SWOT Analysis
- 16.2.10.4. Recent Developments
- 16.2.10.5. Financials (Based on Availability)
- 16.2.1 CD Bioparticles
List of Figures
- Figure 1: Global Lipid Nanoparticles Market Revenue Breakdown (Million, %) by Region 2024 & 2032
- Figure 2: Global Lipid Nanoparticles Market Volume Breakdown (K Unit, %) by Region 2024 & 2032
- Figure 3: North America Lipid Nanoparticles Market Revenue (Million), by Country 2024 & 2032
- Figure 4: North America Lipid Nanoparticles Market Volume (K Unit), by Country 2024 & 2032
- Figure 5: North America Lipid Nanoparticles Market Revenue Share (%), by Country 2024 & 2032
- Figure 6: North America Lipid Nanoparticles Market Volume Share (%), by Country 2024 & 2032
- Figure 7: Europe Lipid Nanoparticles Market Revenue (Million), by Country 2024 & 2032
- Figure 8: Europe Lipid Nanoparticles Market Volume (K Unit), by Country 2024 & 2032
- Figure 9: Europe Lipid Nanoparticles Market Revenue Share (%), by Country 2024 & 2032
- Figure 10: Europe Lipid Nanoparticles Market Volume Share (%), by Country 2024 & 2032
- Figure 11: Asia Pacific Lipid Nanoparticles Market Revenue (Million), by Country 2024 & 2032
- Figure 12: Asia Pacific Lipid Nanoparticles Market Volume (K Unit), by Country 2024 & 2032
- Figure 13: Asia Pacific Lipid Nanoparticles Market Revenue Share (%), by Country 2024 & 2032
- Figure 14: Asia Pacific Lipid Nanoparticles Market Volume Share (%), by Country 2024 & 2032
- Figure 15: South America Lipid Nanoparticles Market Revenue (Million), by Country 2024 & 2032
- Figure 16: South America Lipid Nanoparticles Market Volume (K Unit), by Country 2024 & 2032
- Figure 17: South America Lipid Nanoparticles Market Revenue Share (%), by Country 2024 & 2032
- Figure 18: South America Lipid Nanoparticles Market Volume Share (%), by Country 2024 & 2032
- Figure 19: North America Lipid Nanoparticles Market Revenue (Million), by Country 2024 & 2032
- Figure 20: North America Lipid Nanoparticles Market Volume (K Unit), by Country 2024 & 2032
- Figure 21: North America Lipid Nanoparticles Market Revenue Share (%), by Country 2024 & 2032
- Figure 22: North America Lipid Nanoparticles Market Volume Share (%), by Country 2024 & 2032
- Figure 23: MEA Lipid Nanoparticles Market Revenue (Million), by Country 2024 & 2032
- Figure 24: MEA Lipid Nanoparticles Market Volume (K Unit), by Country 2024 & 2032
- Figure 25: MEA Lipid Nanoparticles Market Revenue Share (%), by Country 2024 & 2032
- Figure 26: MEA Lipid Nanoparticles Market Volume Share (%), by Country 2024 & 2032
- Figure 27: North America Lipid Nanoparticles Market Revenue (Million), by Type 2024 & 2032
- Figure 28: North America Lipid Nanoparticles Market Volume (K Unit), by Type 2024 & 2032
- Figure 29: North America Lipid Nanoparticles Market Revenue Share (%), by Type 2024 & 2032
- Figure 30: North America Lipid Nanoparticles Market Volume Share (%), by Type 2024 & 2032
- Figure 31: North America Lipid Nanoparticles Market Revenue (Million), by Application 2024 & 2032
- Figure 32: North America Lipid Nanoparticles Market Volume (K Unit), by Application 2024 & 2032
- Figure 33: North America Lipid Nanoparticles Market Revenue Share (%), by Application 2024 & 2032
- Figure 34: North America Lipid Nanoparticles Market Volume Share (%), by Application 2024 & 2032
- Figure 35: North America Lipid Nanoparticles Market Revenue (Million), by End User 2024 & 2032
- Figure 36: North America Lipid Nanoparticles Market Volume (K Unit), by End User 2024 & 2032
- Figure 37: North America Lipid Nanoparticles Market Revenue Share (%), by End User 2024 & 2032
- Figure 38: North America Lipid Nanoparticles Market Volume Share (%), by End User 2024 & 2032
- Figure 39: North America Lipid Nanoparticles Market Revenue (Million), by Country 2024 & 2032
- Figure 40: North America Lipid Nanoparticles Market Volume (K Unit), by Country 2024 & 2032
- Figure 41: North America Lipid Nanoparticles Market Revenue Share (%), by Country 2024 & 2032
- Figure 42: North America Lipid Nanoparticles Market Volume Share (%), by Country 2024 & 2032
- Figure 43: Europe Lipid Nanoparticles Market Revenue (Million), by Type 2024 & 2032
- Figure 44: Europe Lipid Nanoparticles Market Volume (K Unit), by Type 2024 & 2032
- Figure 45: Europe Lipid Nanoparticles Market Revenue Share (%), by Type 2024 & 2032
- Figure 46: Europe Lipid Nanoparticles Market Volume Share (%), by Type 2024 & 2032
- Figure 47: Europe Lipid Nanoparticles Market Revenue (Million), by Application 2024 & 2032
- Figure 48: Europe Lipid Nanoparticles Market Volume (K Unit), by Application 2024 & 2032
- Figure 49: Europe Lipid Nanoparticles Market Revenue Share (%), by Application 2024 & 2032
- Figure 50: Europe Lipid Nanoparticles Market Volume Share (%), by Application 2024 & 2032
- Figure 51: Europe Lipid Nanoparticles Market Revenue (Million), by End User 2024 & 2032
- Figure 52: Europe Lipid Nanoparticles Market Volume (K Unit), by End User 2024 & 2032
- Figure 53: Europe Lipid Nanoparticles Market Revenue Share (%), by End User 2024 & 2032
- Figure 54: Europe Lipid Nanoparticles Market Volume Share (%), by End User 2024 & 2032
- Figure 55: Europe Lipid Nanoparticles Market Revenue (Million), by Country 2024 & 2032
- Figure 56: Europe Lipid Nanoparticles Market Volume (K Unit), by Country 2024 & 2032
- Figure 57: Europe Lipid Nanoparticles Market Revenue Share (%), by Country 2024 & 2032
- Figure 58: Europe Lipid Nanoparticles Market Volume Share (%), by Country 2024 & 2032
- Figure 59: Asia Pacific Lipid Nanoparticles Market Revenue (Million), by Type 2024 & 2032
- Figure 60: Asia Pacific Lipid Nanoparticles Market Volume (K Unit), by Type 2024 & 2032
- Figure 61: Asia Pacific Lipid Nanoparticles Market Revenue Share (%), by Type 2024 & 2032
- Figure 62: Asia Pacific Lipid Nanoparticles Market Volume Share (%), by Type 2024 & 2032
- Figure 63: Asia Pacific Lipid Nanoparticles Market Revenue (Million), by Application 2024 & 2032
- Figure 64: Asia Pacific Lipid Nanoparticles Market Volume (K Unit), by Application 2024 & 2032
- Figure 65: Asia Pacific Lipid Nanoparticles Market Revenue Share (%), by Application 2024 & 2032
- Figure 66: Asia Pacific Lipid Nanoparticles Market Volume Share (%), by Application 2024 & 2032
- Figure 67: Asia Pacific Lipid Nanoparticles Market Revenue (Million), by End User 2024 & 2032
- Figure 68: Asia Pacific Lipid Nanoparticles Market Volume (K Unit), by End User 2024 & 2032
- Figure 69: Asia Pacific Lipid Nanoparticles Market Revenue Share (%), by End User 2024 & 2032
- Figure 70: Asia Pacific Lipid Nanoparticles Market Volume Share (%), by End User 2024 & 2032
- Figure 71: Asia Pacific Lipid Nanoparticles Market Revenue (Million), by Country 2024 & 2032
- Figure 72: Asia Pacific Lipid Nanoparticles Market Volume (K Unit), by Country 2024 & 2032
- Figure 73: Asia Pacific Lipid Nanoparticles Market Revenue Share (%), by Country 2024 & 2032
- Figure 74: Asia Pacific Lipid Nanoparticles Market Volume Share (%), by Country 2024 & 2032
- Figure 75: Rest of the World Lipid Nanoparticles Market Revenue (Million), by Type 2024 & 2032
- Figure 76: Rest of the World Lipid Nanoparticles Market Volume (K Unit), by Type 2024 & 2032
- Figure 77: Rest of the World Lipid Nanoparticles Market Revenue Share (%), by Type 2024 & 2032
- Figure 78: Rest of the World Lipid Nanoparticles Market Volume Share (%), by Type 2024 & 2032
- Figure 79: Rest of the World Lipid Nanoparticles Market Revenue (Million), by Application 2024 & 2032
- Figure 80: Rest of the World Lipid Nanoparticles Market Volume (K Unit), by Application 2024 & 2032
- Figure 81: Rest of the World Lipid Nanoparticles Market Revenue Share (%), by Application 2024 & 2032
- Figure 82: Rest of the World Lipid Nanoparticles Market Volume Share (%), by Application 2024 & 2032
- Figure 83: Rest of the World Lipid Nanoparticles Market Revenue (Million), by End User 2024 & 2032
- Figure 84: Rest of the World Lipid Nanoparticles Market Volume (K Unit), by End User 2024 & 2032
- Figure 85: Rest of the World Lipid Nanoparticles Market Revenue Share (%), by End User 2024 & 2032
- Figure 86: Rest of the World Lipid Nanoparticles Market Volume Share (%), by End User 2024 & 2032
- Figure 87: Rest of the World Lipid Nanoparticles Market Revenue (Million), by Country 2024 & 2032
- Figure 88: Rest of the World Lipid Nanoparticles Market Volume (K Unit), by Country 2024 & 2032
- Figure 89: Rest of the World Lipid Nanoparticles Market Revenue Share (%), by Country 2024 & 2032
- Figure 90: Rest of the World Lipid Nanoparticles Market Volume Share (%), by Country 2024 & 2032
List of Tables
- Table 1: Global Lipid Nanoparticles Market Revenue Million Forecast, by Region 2019 & 2032
- Table 2: Global Lipid Nanoparticles Market Volume K Unit Forecast, by Region 2019 & 2032
- Table 3: Global Lipid Nanoparticles Market Revenue Million Forecast, by Type 2019 & 2032
- Table 4: Global Lipid Nanoparticles Market Volume K Unit Forecast, by Type 2019 & 2032
- Table 5: Global Lipid Nanoparticles Market Revenue Million Forecast, by Application 2019 & 2032
- Table 6: Global Lipid Nanoparticles Market Volume K Unit Forecast, by Application 2019 & 2032
- Table 7: Global Lipid Nanoparticles Market Revenue Million Forecast, by End User 2019 & 2032
- Table 8: Global Lipid Nanoparticles Market Volume K Unit Forecast, by End User 2019 & 2032
- Table 9: Global Lipid Nanoparticles Market Revenue Million Forecast, by Region 2019 & 2032
- Table 10: Global Lipid Nanoparticles Market Volume K Unit Forecast, by Region 2019 & 2032
- Table 11: Global Lipid Nanoparticles Market Revenue Million Forecast, by Country 2019 & 2032
- Table 12: Global Lipid Nanoparticles Market Volume K Unit Forecast, by Country 2019 & 2032
- Table 13: United States Lipid Nanoparticles Market Revenue (Million) Forecast, by Application 2019 & 2032
- Table 14: United States Lipid Nanoparticles Market Volume (K Unit) Forecast, by Application 2019 & 2032
- Table 15: Canada Lipid Nanoparticles Market Revenue (Million) Forecast, by Application 2019 & 2032
- Table 16: Canada Lipid Nanoparticles Market Volume (K Unit) Forecast, by Application 2019 & 2032
- Table 17: Mexico Lipid Nanoparticles Market Revenue (Million) Forecast, by Application 2019 & 2032
- Table 18: Mexico Lipid Nanoparticles Market Volume (K Unit) Forecast, by Application 2019 & 2032
- Table 19: Global Lipid Nanoparticles Market Revenue Million Forecast, by Country 2019 & 2032
- Table 20: Global Lipid Nanoparticles Market Volume K Unit Forecast, by Country 2019 & 2032
- Table 21: Germany Lipid Nanoparticles Market Revenue (Million) Forecast, by Application 2019 & 2032
- Table 22: Germany Lipid Nanoparticles Market Volume (K Unit) Forecast, by Application 2019 & 2032
- Table 23: United Kingdom Lipid Nanoparticles Market Revenue (Million) Forecast, by Application 2019 & 2032
- Table 24: United Kingdom Lipid Nanoparticles Market Volume (K Unit) Forecast, by Application 2019 & 2032
- Table 25: France Lipid Nanoparticles Market Revenue (Million) Forecast, by Application 2019 & 2032
- Table 26: France Lipid Nanoparticles Market Volume (K Unit) Forecast, by Application 2019 & 2032
- Table 27: Spain Lipid Nanoparticles Market Revenue (Million) Forecast, by Application 2019 & 2032
- Table 28: Spain Lipid Nanoparticles Market Volume (K Unit) Forecast, by Application 2019 & 2032
- Table 29: Italy Lipid Nanoparticles Market Revenue (Million) Forecast, by Application 2019 & 2032
- Table 30: Italy Lipid Nanoparticles Market Volume (K Unit) Forecast, by Application 2019 & 2032
- Table 31: Spain Lipid Nanoparticles Market Revenue (Million) Forecast, by Application 2019 & 2032
- Table 32: Spain Lipid Nanoparticles Market Volume (K Unit) Forecast, by Application 2019 & 2032
- Table 33: Belgium Lipid Nanoparticles Market Revenue (Million) Forecast, by Application 2019 & 2032
- Table 34: Belgium Lipid Nanoparticles Market Volume (K Unit) Forecast, by Application 2019 & 2032
- Table 35: Netherland Lipid Nanoparticles Market Revenue (Million) Forecast, by Application 2019 & 2032
- Table 36: Netherland Lipid Nanoparticles Market Volume (K Unit) Forecast, by Application 2019 & 2032
- Table 37: Nordics Lipid Nanoparticles Market Revenue (Million) Forecast, by Application 2019 & 2032
- Table 38: Nordics Lipid Nanoparticles Market Volume (K Unit) Forecast, by Application 2019 & 2032
- Table 39: Rest of Europe Lipid Nanoparticles Market Revenue (Million) Forecast, by Application 2019 & 2032
- Table 40: Rest of Europe Lipid Nanoparticles Market Volume (K Unit) Forecast, by Application 2019 & 2032
- Table 41: Global Lipid Nanoparticles Market Revenue Million Forecast, by Country 2019 & 2032
- Table 42: Global Lipid Nanoparticles Market Volume K Unit Forecast, by Country 2019 & 2032
- Table 43: China Lipid Nanoparticles Market Revenue (Million) Forecast, by Application 2019 & 2032
- Table 44: China Lipid Nanoparticles Market Volume (K Unit) Forecast, by Application 2019 & 2032
- Table 45: Japan Lipid Nanoparticles Market Revenue (Million) Forecast, by Application 2019 & 2032
- Table 46: Japan Lipid Nanoparticles Market Volume (K Unit) Forecast, by Application 2019 & 2032
- Table 47: India Lipid Nanoparticles Market Revenue (Million) Forecast, by Application 2019 & 2032
- Table 48: India Lipid Nanoparticles Market Volume (K Unit) Forecast, by Application 2019 & 2032
- Table 49: South Korea Lipid Nanoparticles Market Revenue (Million) Forecast, by Application 2019 & 2032
- Table 50: South Korea Lipid Nanoparticles Market Volume (K Unit) Forecast, by Application 2019 & 2032
- Table 51: Southeast Asia Lipid Nanoparticles Market Revenue (Million) Forecast, by Application 2019 & 2032
- Table 52: Southeast Asia Lipid Nanoparticles Market Volume (K Unit) Forecast, by Application 2019 & 2032
- Table 53: Australia Lipid Nanoparticles Market Revenue (Million) Forecast, by Application 2019 & 2032
- Table 54: Australia Lipid Nanoparticles Market Volume (K Unit) Forecast, by Application 2019 & 2032
- Table 55: Indonesia Lipid Nanoparticles Market Revenue (Million) Forecast, by Application 2019 & 2032
- Table 56: Indonesia Lipid Nanoparticles Market Volume (K Unit) Forecast, by Application 2019 & 2032
- Table 57: Phillipes Lipid Nanoparticles Market Revenue (Million) Forecast, by Application 2019 & 2032
- Table 58: Phillipes Lipid Nanoparticles Market Volume (K Unit) Forecast, by Application 2019 & 2032
- Table 59: Singapore Lipid Nanoparticles Market Revenue (Million) Forecast, by Application 2019 & 2032
- Table 60: Singapore Lipid Nanoparticles Market Volume (K Unit) Forecast, by Application 2019 & 2032
- Table 61: Thailandc Lipid Nanoparticles Market Revenue (Million) Forecast, by Application 2019 & 2032
- Table 62: Thailandc Lipid Nanoparticles Market Volume (K Unit) Forecast, by Application 2019 & 2032
- Table 63: Rest of Asia Pacific Lipid Nanoparticles Market Revenue (Million) Forecast, by Application 2019 & 2032
- Table 64: Rest of Asia Pacific Lipid Nanoparticles Market Volume (K Unit) Forecast, by Application 2019 & 2032
- Table 65: Global Lipid Nanoparticles Market Revenue Million Forecast, by Country 2019 & 2032
- Table 66: Global Lipid Nanoparticles Market Volume K Unit Forecast, by Country 2019 & 2032
- Table 67: Brazil Lipid Nanoparticles Market Revenue (Million) Forecast, by Application 2019 & 2032
- Table 68: Brazil Lipid Nanoparticles Market Volume (K Unit) Forecast, by Application 2019 & 2032
- Table 69: Argentina Lipid Nanoparticles Market Revenue (Million) Forecast, by Application 2019 & 2032
- Table 70: Argentina Lipid Nanoparticles Market Volume (K Unit) Forecast, by Application 2019 & 2032
- Table 71: Peru Lipid Nanoparticles Market Revenue (Million) Forecast, by Application 2019 & 2032
- Table 72: Peru Lipid Nanoparticles Market Volume (K Unit) Forecast, by Application 2019 & 2032
- Table 73: Chile Lipid Nanoparticles Market Revenue (Million) Forecast, by Application 2019 & 2032
- Table 74: Chile Lipid Nanoparticles Market Volume (K Unit) Forecast, by Application 2019 & 2032
- Table 75: Colombia Lipid Nanoparticles Market Revenue (Million) Forecast, by Application 2019 & 2032
- Table 76: Colombia Lipid Nanoparticles Market Volume (K Unit) Forecast, by Application 2019 & 2032
- Table 77: Ecuador Lipid Nanoparticles Market Revenue (Million) Forecast, by Application 2019 & 2032
- Table 78: Ecuador Lipid Nanoparticles Market Volume (K Unit) Forecast, by Application 2019 & 2032
- Table 79: Venezuela Lipid Nanoparticles Market Revenue (Million) Forecast, by Application 2019 & 2032
- Table 80: Venezuela Lipid Nanoparticles Market Volume (K Unit) Forecast, by Application 2019 & 2032
- Table 81: Rest of South America Lipid Nanoparticles Market Revenue (Million) Forecast, by Application 2019 & 2032
- Table 82: Rest of South America Lipid Nanoparticles Market Volume (K Unit) Forecast, by Application 2019 & 2032
- Table 83: Global Lipid Nanoparticles Market Revenue Million Forecast, by Country 2019 & 2032
- Table 84: Global Lipid Nanoparticles Market Volume K Unit Forecast, by Country 2019 & 2032
- Table 85: United States Lipid Nanoparticles Market Revenue (Million) Forecast, by Application 2019 & 2032
- Table 86: United States Lipid Nanoparticles Market Volume (K Unit) Forecast, by Application 2019 & 2032
- Table 87: Canada Lipid Nanoparticles Market Revenue (Million) Forecast, by Application 2019 & 2032
- Table 88: Canada Lipid Nanoparticles Market Volume (K Unit) Forecast, by Application 2019 & 2032
- Table 89: Mexico Lipid Nanoparticles Market Revenue (Million) Forecast, by Application 2019 & 2032
- Table 90: Mexico Lipid Nanoparticles Market Volume (K Unit) Forecast, by Application 2019 & 2032
- Table 91: Global Lipid Nanoparticles Market Revenue Million Forecast, by Country 2019 & 2032
- Table 92: Global Lipid Nanoparticles Market Volume K Unit Forecast, by Country 2019 & 2032
- Table 93: United Arab Emirates Lipid Nanoparticles Market Revenue (Million) Forecast, by Application 2019 & 2032
- Table 94: United Arab Emirates Lipid Nanoparticles Market Volume (K Unit) Forecast, by Application 2019 & 2032
- Table 95: Saudi Arabia Lipid Nanoparticles Market Revenue (Million) Forecast, by Application 2019 & 2032
- Table 96: Saudi Arabia Lipid Nanoparticles Market Volume (K Unit) Forecast, by Application 2019 & 2032
- Table 97: South Africa Lipid Nanoparticles Market Revenue (Million) Forecast, by Application 2019 & 2032
- Table 98: South Africa Lipid Nanoparticles Market Volume (K Unit) Forecast, by Application 2019 & 2032
- Table 99: Rest of Middle East and Africa Lipid Nanoparticles Market Revenue (Million) Forecast, by Application 2019 & 2032
- Table 100: Rest of Middle East and Africa Lipid Nanoparticles Market Volume (K Unit) Forecast, by Application 2019 & 2032
- Table 101: Global Lipid Nanoparticles Market Revenue Million Forecast, by Type 2019 & 2032
- Table 102: Global Lipid Nanoparticles Market Volume K Unit Forecast, by Type 2019 & 2032
- Table 103: Global Lipid Nanoparticles Market Revenue Million Forecast, by Application 2019 & 2032
- Table 104: Global Lipid Nanoparticles Market Volume K Unit Forecast, by Application 2019 & 2032
- Table 105: Global Lipid Nanoparticles Market Revenue Million Forecast, by End User 2019 & 2032
- Table 106: Global Lipid Nanoparticles Market Volume K Unit Forecast, by End User 2019 & 2032
- Table 107: Global Lipid Nanoparticles Market Revenue Million Forecast, by Country 2019 & 2032
- Table 108: Global Lipid Nanoparticles Market Volume K Unit Forecast, by Country 2019 & 2032
- Table 109: United States Lipid Nanoparticles Market Revenue (Million) Forecast, by Application 2019 & 2032
- Table 110: United States Lipid Nanoparticles Market Volume (K Unit) Forecast, by Application 2019 & 2032
- Table 111: Canada Lipid Nanoparticles Market Revenue (Million) Forecast, by Application 2019 & 2032
- Table 112: Canada Lipid Nanoparticles Market Volume (K Unit) Forecast, by Application 2019 & 2032
- Table 113: Mexico Lipid Nanoparticles Market Revenue (Million) Forecast, by Application 2019 & 2032
- Table 114: Mexico Lipid Nanoparticles Market Volume (K Unit) Forecast, by Application 2019 & 2032
- Table 115: Global Lipid Nanoparticles Market Revenue Million Forecast, by Type 2019 & 2032
- Table 116: Global Lipid Nanoparticles Market Volume K Unit Forecast, by Type 2019 & 2032
- Table 117: Global Lipid Nanoparticles Market Revenue Million Forecast, by Application 2019 & 2032
- Table 118: Global Lipid Nanoparticles Market Volume K Unit Forecast, by Application 2019 & 2032
- Table 119: Global Lipid Nanoparticles Market Revenue Million Forecast, by End User 2019 & 2032
- Table 120: Global Lipid Nanoparticles Market Volume K Unit Forecast, by End User 2019 & 2032
- Table 121: Global Lipid Nanoparticles Market Revenue Million Forecast, by Country 2019 & 2032
- Table 122: Global Lipid Nanoparticles Market Volume K Unit Forecast, by Country 2019 & 2032
- Table 123: Germany Lipid Nanoparticles Market Revenue (Million) Forecast, by Application 2019 & 2032
- Table 124: Germany Lipid Nanoparticles Market Volume (K Unit) Forecast, by Application 2019 & 2032
- Table 125: United Kingdom Lipid Nanoparticles Market Revenue (Million) Forecast, by Application 2019 & 2032
- Table 126: United Kingdom Lipid Nanoparticles Market Volume (K Unit) Forecast, by Application 2019 & 2032
- Table 127: France Lipid Nanoparticles Market Revenue (Million) Forecast, by Application 2019 & 2032
- Table 128: France Lipid Nanoparticles Market Volume (K Unit) Forecast, by Application 2019 & 2032
- Table 129: Italy Lipid Nanoparticles Market Revenue (Million) Forecast, by Application 2019 & 2032
- Table 130: Italy Lipid Nanoparticles Market Volume (K Unit) Forecast, by Application 2019 & 2032
- Table 131: Spain Lipid Nanoparticles Market Revenue (Million) Forecast, by Application 2019 & 2032
- Table 132: Spain Lipid Nanoparticles Market Volume (K Unit) Forecast, by Application 2019 & 2032
- Table 133: Rest of Europe Lipid Nanoparticles Market Revenue (Million) Forecast, by Application 2019 & 2032
- Table 134: Rest of Europe Lipid Nanoparticles Market Volume (K Unit) Forecast, by Application 2019 & 2032
- Table 135: Global Lipid Nanoparticles Market Revenue Million Forecast, by Type 2019 & 2032
- Table 136: Global Lipid Nanoparticles Market Volume K Unit Forecast, by Type 2019 & 2032
- Table 137: Global Lipid Nanoparticles Market Revenue Million Forecast, by Application 2019 & 2032
- Table 138: Global Lipid Nanoparticles Market Volume K Unit Forecast, by Application 2019 & 2032
- Table 139: Global Lipid Nanoparticles Market Revenue Million Forecast, by End User 2019 & 2032
- Table 140: Global Lipid Nanoparticles Market Volume K Unit Forecast, by End User 2019 & 2032
- Table 141: Global Lipid Nanoparticles Market Revenue Million Forecast, by Country 2019 & 2032
- Table 142: Global Lipid Nanoparticles Market Volume K Unit Forecast, by Country 2019 & 2032
- Table 143: China Lipid Nanoparticles Market Revenue (Million) Forecast, by Application 2019 & 2032
- Table 144: China Lipid Nanoparticles Market Volume (K Unit) Forecast, by Application 2019 & 2032
- Table 145: Japan Lipid Nanoparticles Market Revenue (Million) Forecast, by Application 2019 & 2032
- Table 146: Japan Lipid Nanoparticles Market Volume (K Unit) Forecast, by Application 2019 & 2032
- Table 147: India Lipid Nanoparticles Market Revenue (Million) Forecast, by Application 2019 & 2032
- Table 148: India Lipid Nanoparticles Market Volume (K Unit) Forecast, by Application 2019 & 2032
- Table 149: Australia Lipid Nanoparticles Market Revenue (Million) Forecast, by Application 2019 & 2032
- Table 150: Australia Lipid Nanoparticles Market Volume (K Unit) Forecast, by Application 2019 & 2032
- Table 151: South Korea Lipid Nanoparticles Market Revenue (Million) Forecast, by Application 2019 & 2032
- Table 152: South Korea Lipid Nanoparticles Market Volume (K Unit) Forecast, by Application 2019 & 2032
- Table 153: Rest of Asia Pacific Lipid Nanoparticles Market Revenue (Million) Forecast, by Application 2019 & 2032
- Table 154: Rest of Asia Pacific Lipid Nanoparticles Market Volume (K Unit) Forecast, by Application 2019 & 2032
- Table 155: Global Lipid Nanoparticles Market Revenue Million Forecast, by Type 2019 & 2032
- Table 156: Global Lipid Nanoparticles Market Volume K Unit Forecast, by Type 2019 & 2032
- Table 157: Global Lipid Nanoparticles Market Revenue Million Forecast, by Application 2019 & 2032
- Table 158: Global Lipid Nanoparticles Market Volume K Unit Forecast, by Application 2019 & 2032
- Table 159: Global Lipid Nanoparticles Market Revenue Million Forecast, by End User 2019 & 2032
- Table 160: Global Lipid Nanoparticles Market Volume K Unit Forecast, by End User 2019 & 2032
- Table 161: Global Lipid Nanoparticles Market Revenue Million Forecast, by Country 2019 & 2032
- Table 162: Global Lipid Nanoparticles Market Volume K Unit Forecast, by Country 2019 & 2032
Frequently Asked Questions
1. What is the projected Compound Annual Growth Rate (CAGR) of the Lipid Nanoparticles Market?
The projected CAGR is approximately 10.54%.
2. Which companies are prominent players in the Lipid Nanoparticles Market?
Key companies in the market include CD Bioparticles, Arcturus Therapeutics Inc, Merck KGaA, Cytiva, CordenPharma, Croda International PLC, Ascendia Pharmaceuticals, Genevant Sciences Corporation, Acuitas Therapeutics, BIOVECTRA.
3. What are the main segments of the Lipid Nanoparticles Market?
The market segments include Type, Application, End User.
4. Can you provide details about the market size?
The market size is estimated to be USD 0.82 Million as of 2022.
5. What are some drivers contributing to market growth?
Increasing Prevalence of Chronic Diseases; Rising Focus Towards Personalized Medicine; Growing Investment for Research and Development of Nanotechnology.
6. What are the notable trends driving market growth?
Therapeutics Segment is Expected to Witness Significant Growth During the Forecast Period.
7. Are there any restraints impacting market growth?
Stringent Regulatory Compliance; Expensive Formulation with Limited Loading Capacity.
8. Can you provide examples of recent developments in the market?
February 2024: CordenPharma launched Lipid NanoParticle (LNP) Starter Kits for effective mRNA formulation in developing mRNA-based therapeutics such as mRNA vaccines or gene therapies.
9. What pricing options are available for accessing the report?
Pricing options include single-user, multi-user, and enterprise licenses priced at USD 4750, USD 5250, and USD 8750 respectively.
10. Is the market size provided in terms of value or volume?
The market size is provided in terms of value, measured in Million and volume, measured in K Unit.
11. Are there any specific market keywords associated with the report?
Yes, the market keyword associated with the report is "Lipid Nanoparticles Market," which aids in identifying and referencing the specific market segment covered.
12. How do I determine which pricing option suits my needs best?
The pricing options vary based on user requirements and access needs. Individual users may opt for single-user licenses, while businesses requiring broader access may choose multi-user or enterprise licenses for cost-effective access to the report.
13. Are there any additional resources or data provided in the Lipid Nanoparticles Market report?
While the report offers comprehensive insights, it's advisable to review the specific contents or supplementary materials provided to ascertain if additional resources or data are available.
14. How can I stay updated on further developments or reports in the Lipid Nanoparticles Market?
To stay informed about further developments, trends, and reports in the Lipid Nanoparticles Market, consider subscribing to industry newsletters, following relevant companies and organizations, or regularly checking reputable industry news sources and publications.
Methodology
Step 1 - Identification of Relevant Samples Size from Population Database


Step 2 - Approaches for Defining Global Market Size (Value, Volume* & Price*)

Note*: In applicable scenarios
Step 3 - Data Sources
Primary Research
- Web Analytics
- Survey Reports
- Research Institute
- Latest Research Reports
- Opinion Leaders
Secondary Research
- Annual Reports
- White Paper
- Latest Press Release
- Industry Association
- Paid Database
- Investor Presentations

Step 4 - Data Triangulation
Involves using different sources of information in order to increase the validity of a study
These sources are likely to be stakeholders in a program - participants, other researchers, program staff, other community members, and so on.
Then we put all data in single framework & apply various statistical tools to find out the dynamic on the market.
During the analysis stage, feedback from the stakeholder groups would be compared to determine areas of agreement as well as areas of divergence


