
Key Insights
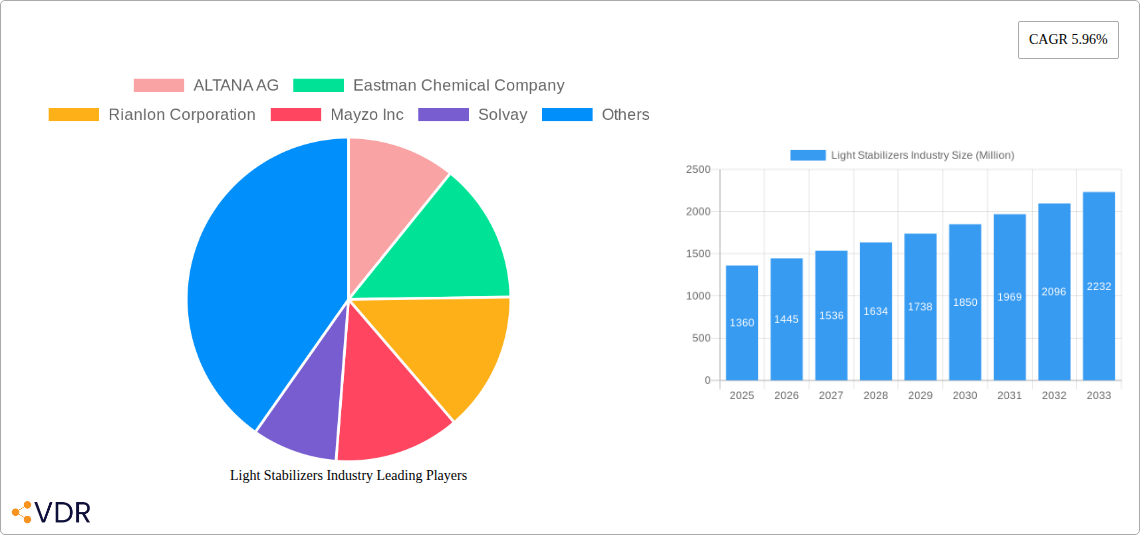
The global light stabilizers market, valued at $1.36 billion in 2025, is projected to experience robust growth, driven by a Compound Annual Growth Rate (CAGR) of 5.96% from 2025 to 2033. This expansion is fueled by several key factors. The burgeoning packaging industry, particularly in food and beverage, necessitates increased use of light stabilizers to extend product shelf life and maintain quality. Similarly, the automotive sector's demand for durable and UV-resistant materials for exterior components is a significant driver. Growth in the building and construction sector, with a focus on long-lasting and weather-resistant materials, further contributes to market expansion. Technological advancements leading to the development of more efficient and environmentally friendly light stabilizers are also bolstering market growth. Furthermore, the increasing awareness of UV damage and the need for protection across various applications, including agriculture (protective coatings for crops) and adhesives, is creating new avenues for market expansion.
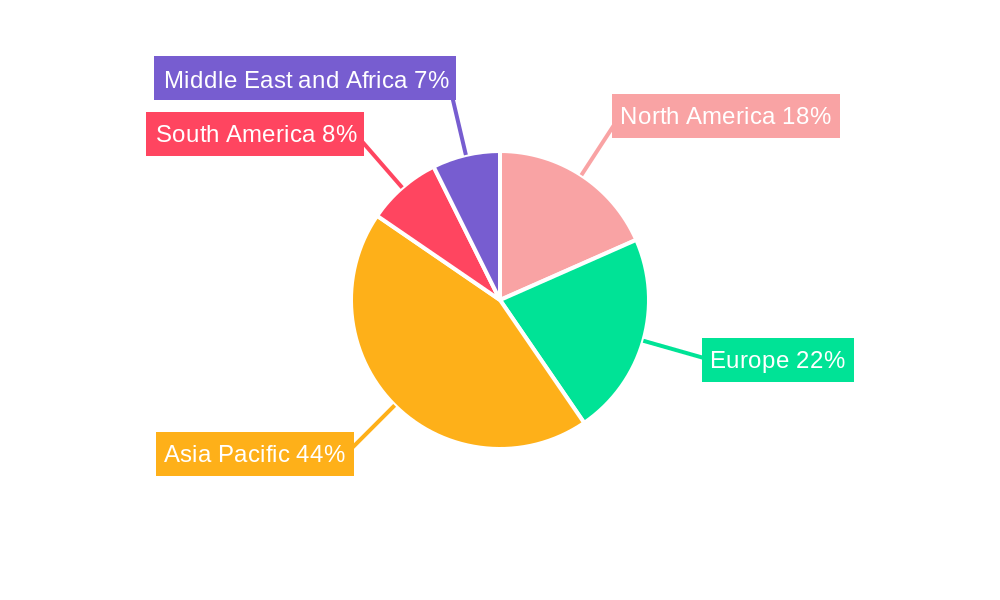
However, the market faces certain restraints. Fluctuations in raw material prices can impact the overall cost and profitability of light stabilizers. Stringent environmental regulations concerning the use of certain chemical additives might necessitate the development and adoption of alternative, sustainable solutions. Competitive pressures among established players and emerging manufacturers also influence market dynamics. Despite these challenges, the market's positive outlook is sustained by the expanding end-user industries and ongoing innovation in light stabilizer technology, leading to improved performance and broader applications across various sectors. The Asia-Pacific region, particularly China and India, is expected to witness significant growth due to rapid industrialization and increasing demand for durable goods.
Light Stabilizers Industry Market Report: 2019-2033
This comprehensive report provides a detailed analysis of the Light Stabilizers industry, encompassing market dynamics, growth trends, dominant segments, and key players. With a focus on the period 2019-2033 (Base Year: 2025, Forecast Period: 2025-2033), this report is an essential resource for industry professionals, investors, and strategic decision-makers. The report covers a market valued at xx Million units in 2025, projected to reach xx Million units by 2033.
Light Stabilizers Industry Market Dynamics & Structure
The Light Stabilizers market is characterized by a moderately consolidated structure, with several key players holding significant market share. Market concentration is influenced by factors such as technological innovation, economies of scale, and access to raw materials. The industry is witnessing a surge in technological advancements, driven by the increasing demand for high-performance stabilizers with enhanced UV protection and improved durability. Stringent regulatory frameworks concerning environmental impact and product safety pose both challenges and opportunities for industry participants. The market experiences competitive pressure from product substitutes, particularly in niche applications. End-user demographics, particularly in the packaging and automotive sectors, play a pivotal role in shaping market demand. M&A activity has been moderate, with strategic acquisitions aimed at expanding product portfolios and gaining access to new markets.
- Market Concentration: Moderately consolidated, with top 5 players holding approximately xx% market share in 2025.
- Technological Innovation: Focus on developing biodegradable and sustainable light stabilizers, along with improved UV protection capabilities.
- Regulatory Framework: Compliance with REACH, RoHS, and other environmental regulations is crucial.
- Competitive Substitutes: Competition from alternative UV protection technologies, such as coatings and films.
- End-User Demographics: Growing demand from emerging economies, particularly in the packaging and construction sectors.
- M&A Trends: Strategic acquisitions and partnerships aimed at expanding geographic reach and product lines. xx M&A deals recorded between 2019 and 2024.
Light Stabilizers Industry Growth Trends & Insights
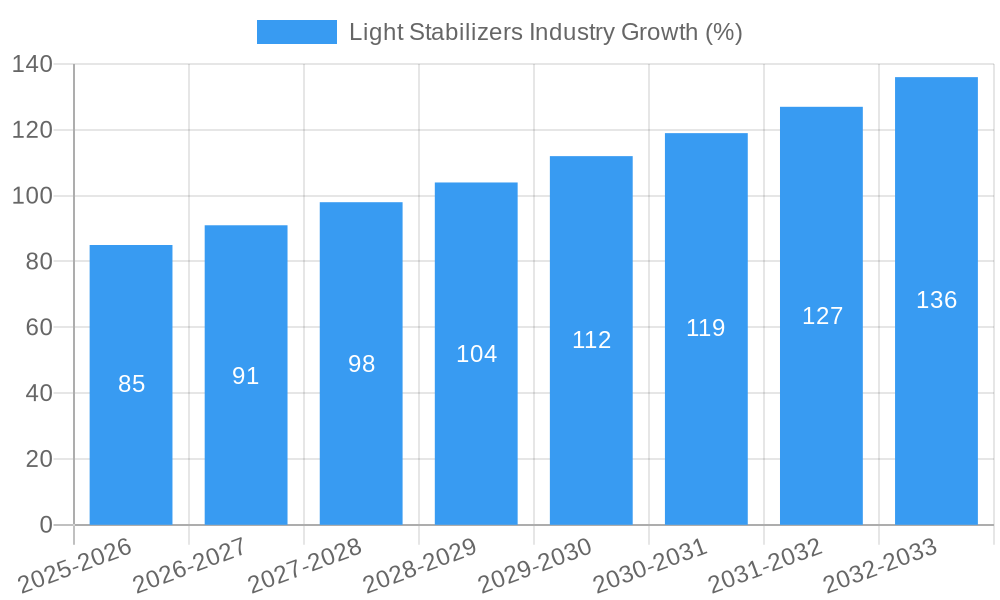
The Light Stabilizers market has experienced significant growth over the historical period (2019-2024), driven by increasing demand from various end-use industries. The market size is projected to grow at a Compound Annual Growth Rate (CAGR) of xx% during the forecast period (2025-2033), reaching xx Million units by 2033. This growth is attributed to several factors, including increasing awareness of the importance of UV protection, growing demand for durable and high-performance materials, and technological advancements leading to the development of more efficient and sustainable light stabilizers. Market penetration is expected to increase significantly in emerging economies, driven by rising disposable incomes and industrialization. Technological disruptions, such as the development of novel stabilizer chemistries and the adoption of advanced manufacturing techniques, are further propelling market expansion. Consumer behavior shifts toward sustainable and eco-friendly products are creating new opportunities for manufacturers to develop and market sustainable light stabilizers.
Dominant Regions, Countries, or Segments in Light Stabilizers Industry
The Asia Pacific region is currently the leading market for light stabilizers, driven by rapid industrialization, increasing construction activity, and robust growth in the automotive and packaging sectors. Within this region, China and India represent significant growth opportunities. Europe and North America also hold substantial market shares, although their growth rates are relatively slower compared to the Asia Pacific region.
Dominant Segments:
- By Type: Hindered Amine Light Stabilizers (HALS) currently hold the largest market share, owing to their superior performance and broad applicability across various end-use industries.
- By End-User Industry: The packaging industry is the largest consumer of light stabilizers, followed by the automotive and building & construction sectors.
Key Drivers:
- Rapid industrialization and urbanization in emerging economies: Driving demand for materials with enhanced UV protection.
- Growth in the automotive and packaging industries: Increased use of polymers requiring UV stabilization.
- Stringent environmental regulations: Promoting the development of eco-friendly and sustainable light stabilizers.
- Favorable government policies and infrastructure development: Supporting the growth of related industries.
Light Stabilizers Industry Product Landscape
The light stabilizers market offers a diverse range of products, categorized by type (UV absorbers, HALS, quenchers, antioxidants) and application. Recent innovations focus on enhancing UV protection efficacy, improving thermal stability, and addressing sustainability concerns. Manufacturers are increasingly emphasizing unique selling propositions such as enhanced durability, improved processability, and reduced environmental impact. Technological advancements include the development of novel stabilizer chemistries with enhanced performance characteristics and the incorporation of nanotechnology for improved dispersion and efficacy.
Key Drivers, Barriers & Challenges in Light Stabilizers Industry
Key Drivers:
- Growing demand for UV-resistant plastics in various applications.
- Technological advancements leading to improved stabilizer performance.
- Stringent environmental regulations driving the adoption of sustainable alternatives.
Challenges and Restraints:
- Fluctuations in raw material prices: impacting production costs and profitability.
- Intense competition: from both established players and new entrants.
- Stringent regulatory requirements: increasing compliance costs and complexities. The impact of these regulations is estimated to reduce market growth by approximately xx% in 2027.
Emerging Opportunities in Light Stabilizers Industry
- Growing demand for bio-based and biodegradable light stabilizers.
- Expansion into new and untapped markets in emerging economies.
- Development of specialized light stabilizers for niche applications.
Growth Accelerators in the Light Stabilizers Industry Industry
Technological advancements in stabilizer chemistry and formulation are driving significant growth. Strategic partnerships and collaborations between manufacturers and end-users are creating new market opportunities. Expansion into emerging markets with high growth potential is a key strategy for driving future growth.
Key Players Shaping the Light Stabilizers Industry Market
- ALTANA AG
- Eastman Chemical Company
- Rianlon Corporation
- Mayzo Inc
- Solvay
- SABO S p A
- CLARIANT
- Everlight Chemical Industrial Co
- SI Group Inc (SK Capital Partners)
- Chitec Technology Co Ltd
- ADEKA CORPORATION
- Lycus Ltd LLC
- SONGWON
- UniteChem Group
- BASF SE
Notable Milestones in Light Stabilizers Industry Sector
- July 2022: Solvay launched an innovative UV-C stabilizer range for demanding hygiene applications, addressing polyolefin degradation issues under UV-C radiation.
- March 2022: BASF SE announced increased production capacity for its HALS product line (Tinuvin, Chimassorb, Uvinul) in Italy and Germany.
In-Depth Light Stabilizers Industry Market Outlook
The future of the Light Stabilizers industry appears bright, driven by sustained growth in key end-use sectors and the continuous development of innovative, high-performance stabilizers. Strategic partnerships, expansion into new geographic markets, and the growing adoption of sustainable solutions will further accelerate market expansion in the coming years. The market is poised for significant growth, presenting substantial opportunities for established players and new entrants alike.
Light Stabilizers Industry Segmentation
-
1. Type
- 1.1. UV Absorbers
- 1.2. Hindered Amine Light Stabilizers (HALS)
- 1.3. Quenchers
- 1.4. Antioxidants
-
2. End-User Industry
- 2.1. Packaging
- 2.2. Automotive
- 2.3. Agriculture
- 2.4. Building and Construction
- 2.5. Adhesives and Sealants
- 2.6. Other End-User Industries
Light Stabilizers Industry Segmentation By Geography
-
1. Asia Pacific
- 1.1. China
- 1.2. India
- 1.3. Japan
- 1.4. South Korea
- 1.5. Rest of Asia Pacific
-
2. North America
- 2.1. United States
- 2.2. Canada
- 2.3. Mexico
-
3. Europe
- 3.1. Germany
- 3.2. United Kingdom
- 3.3. France
- 3.4. Italy
- 3.5. Rest of Europe
-
4. South America
- 4.1. Brazil
- 4.2. Argentina
- 4.3. Rest of South America
-
5. Middle East and Africa
- 5.1. Saudi Arabia
- 5.2. South Africa
- 5.3. Rest of Middle East and Africa
Light Stabilizers Industry REPORT HIGHLIGHTS
| Aspects | Details |
|---|---|
| Study Period | 2019-2033 |
| Base Year | 2024 |
| Estimated Year | 2025 |
| Forecast Period | 2025-2033 |
| Historical Period | 2019-2024 |
| Growth Rate | CAGR of 5.96% from 2019-2033 |
| Segmentation |
|
Table of Contents
- 1. Introduction
- 1.1. Research Scope
- 1.2. Market Segmentation
- 1.3. Research Methodology
- 1.4. Definitions and Assumptions
- 2. Executive Summary
- 2.1. Introduction
- 3. Market Dynamics
- 3.1. Introduction
- 3.2. Market Drivers
- 3.2.1. Rising Consumption in Polymer Industry; Increasing Demand for Wood Coatings
- 3.3. Market Restrains
- 3.3.1. Fluctuations in Raw Material Prices
- 3.4. Market Trends
- 3.4.1. Automotive Sector to Dominate the Market
- 4. Market Factor Analysis
- 4.1. Porters Five Forces
- 4.2. Supply/Value Chain
- 4.3. PESTEL analysis
- 4.4. Market Entropy
- 4.5. Patent/Trademark Analysis
- 5. Global Light Stabilizers Industry Analysis, Insights and Forecast, 2019-2031
- 5.1. Market Analysis, Insights and Forecast - by Type
- 5.1.1. UV Absorbers
- 5.1.2. Hindered Amine Light Stabilizers (HALS)
- 5.1.3. Quenchers
- 5.1.4. Antioxidants
- 5.2. Market Analysis, Insights and Forecast - by End-User Industry
- 5.2.1. Packaging
- 5.2.2. Automotive
- 5.2.3. Agriculture
- 5.2.4. Building and Construction
- 5.2.5. Adhesives and Sealants
- 5.2.6. Other End-User Industries
- 5.3. Market Analysis, Insights and Forecast - by Region
- 5.3.1. Asia Pacific
- 5.3.2. North America
- 5.3.3. Europe
- 5.3.4. South America
- 5.3.5. Middle East and Africa
- 5.1. Market Analysis, Insights and Forecast - by Type
- 6. Asia Pacific Light Stabilizers Industry Analysis, Insights and Forecast, 2019-2031
- 6.1. Market Analysis, Insights and Forecast - by Type
- 6.1.1. UV Absorbers
- 6.1.2. Hindered Amine Light Stabilizers (HALS)
- 6.1.3. Quenchers
- 6.1.4. Antioxidants
- 6.2. Market Analysis, Insights and Forecast - by End-User Industry
- 6.2.1. Packaging
- 6.2.2. Automotive
- 6.2.3. Agriculture
- 6.2.4. Building and Construction
- 6.2.5. Adhesives and Sealants
- 6.2.6. Other End-User Industries
- 6.1. Market Analysis, Insights and Forecast - by Type
- 7. North America Light Stabilizers Industry Analysis, Insights and Forecast, 2019-2031
- 7.1. Market Analysis, Insights and Forecast - by Type
- 7.1.1. UV Absorbers
- 7.1.2. Hindered Amine Light Stabilizers (HALS)
- 7.1.3. Quenchers
- 7.1.4. Antioxidants
- 7.2. Market Analysis, Insights and Forecast - by End-User Industry
- 7.2.1. Packaging
- 7.2.2. Automotive
- 7.2.3. Agriculture
- 7.2.4. Building and Construction
- 7.2.5. Adhesives and Sealants
- 7.2.6. Other End-User Industries
- 7.1. Market Analysis, Insights and Forecast - by Type
- 8. Europe Light Stabilizers Industry Analysis, Insights and Forecast, 2019-2031
- 8.1. Market Analysis, Insights and Forecast - by Type
- 8.1.1. UV Absorbers
- 8.1.2. Hindered Amine Light Stabilizers (HALS)
- 8.1.3. Quenchers
- 8.1.4. Antioxidants
- 8.2. Market Analysis, Insights and Forecast - by End-User Industry
- 8.2.1. Packaging
- 8.2.2. Automotive
- 8.2.3. Agriculture
- 8.2.4. Building and Construction
- 8.2.5. Adhesives and Sealants
- 8.2.6. Other End-User Industries
- 8.1. Market Analysis, Insights and Forecast - by Type
- 9. South America Light Stabilizers Industry Analysis, Insights and Forecast, 2019-2031
- 9.1. Market Analysis, Insights and Forecast - by Type
- 9.1.1. UV Absorbers
- 9.1.2. Hindered Amine Light Stabilizers (HALS)
- 9.1.3. Quenchers
- 9.1.4. Antioxidants
- 9.2. Market Analysis, Insights and Forecast - by End-User Industry
- 9.2.1. Packaging
- 9.2.2. Automotive
- 9.2.3. Agriculture
- 9.2.4. Building and Construction
- 9.2.5. Adhesives and Sealants
- 9.2.6. Other End-User Industries
- 9.1. Market Analysis, Insights and Forecast - by Type
- 10. Middle East and Africa Light Stabilizers Industry Analysis, Insights and Forecast, 2019-2031
- 10.1. Market Analysis, Insights and Forecast - by Type
- 10.1.1. UV Absorbers
- 10.1.2. Hindered Amine Light Stabilizers (HALS)
- 10.1.3. Quenchers
- 10.1.4. Antioxidants
- 10.2. Market Analysis, Insights and Forecast - by End-User Industry
- 10.2.1. Packaging
- 10.2.2. Automotive
- 10.2.3. Agriculture
- 10.2.4. Building and Construction
- 10.2.5. Adhesives and Sealants
- 10.2.6. Other End-User Industries
- 10.1. Market Analysis, Insights and Forecast - by Type
- 11. Asia Pacific Light Stabilizers Industry Analysis, Insights and Forecast, 2019-2031
- 11.1. Market Analysis, Insights and Forecast - By Country/Sub-region
- 11.1.1 China
- 11.1.2 India
- 11.1.3 Japan
- 11.1.4 South Korea
- 11.1.5 Rest of Asia Pacific
- 12. North America Light Stabilizers Industry Analysis, Insights and Forecast, 2019-2031
- 12.1. Market Analysis, Insights and Forecast - By Country/Sub-region
- 12.1.1 United States
- 12.1.2 Canada
- 12.1.3 Mexico
- 13. Europe Light Stabilizers Industry Analysis, Insights and Forecast, 2019-2031
- 13.1. Market Analysis, Insights and Forecast - By Country/Sub-region
- 13.1.1 Germany
- 13.1.2 United Kingdom
- 13.1.3 France
- 13.1.4 Italy
- 13.1.5 Rest of Europe
- 14. South America Light Stabilizers Industry Analysis, Insights and Forecast, 2019-2031
- 14.1. Market Analysis, Insights and Forecast - By Country/Sub-region
- 14.1.1 Brazil
- 14.1.2 Argentina
- 14.1.3 Rest of South America
- 15. Middle East and Africa Light Stabilizers Industry Analysis, Insights and Forecast, 2019-2031
- 15.1. Market Analysis, Insights and Forecast - By Country/Sub-region
- 15.1.1 Saudi Arabia
- 15.1.2 South Africa
- 15.1.3 Rest of Middle East and Africa
- 16. Competitive Analysis
- 16.1. Global Market Share Analysis 2024
- 16.2. Company Profiles
- 16.2.1 ALTANA AG
- 16.2.1.1. Overview
- 16.2.1.2. Products
- 16.2.1.3. SWOT Analysis
- 16.2.1.4. Recent Developments
- 16.2.1.5. Financials (Based on Availability)
- 16.2.2 Eastman Chemical Company
- 16.2.2.1. Overview
- 16.2.2.2. Products
- 16.2.2.3. SWOT Analysis
- 16.2.2.4. Recent Developments
- 16.2.2.5. Financials (Based on Availability)
- 16.2.3 Rianlon Corporation
- 16.2.3.1. Overview
- 16.2.3.2. Products
- 16.2.3.3. SWOT Analysis
- 16.2.3.4. Recent Developments
- 16.2.3.5. Financials (Based on Availability)
- 16.2.4 Mayzo Inc
- 16.2.4.1. Overview
- 16.2.4.2. Products
- 16.2.4.3. SWOT Analysis
- 16.2.4.4. Recent Developments
- 16.2.4.5. Financials (Based on Availability)
- 16.2.5 Solvay
- 16.2.5.1. Overview
- 16.2.5.2. Products
- 16.2.5.3. SWOT Analysis
- 16.2.5.4. Recent Developments
- 16.2.5.5. Financials (Based on Availability)
- 16.2.6 SABO S p A
- 16.2.6.1. Overview
- 16.2.6.2. Products
- 16.2.6.3. SWOT Analysis
- 16.2.6.4. Recent Developments
- 16.2.6.5. Financials (Based on Availability)
- 16.2.7 CLARIANT
- 16.2.7.1. Overview
- 16.2.7.2. Products
- 16.2.7.3. SWOT Analysis
- 16.2.7.4. Recent Developments
- 16.2.7.5. Financials (Based on Availability)
- 16.2.8 Everlight Chemical Industrial Co
- 16.2.8.1. Overview
- 16.2.8.2. Products
- 16.2.8.3. SWOT Analysis
- 16.2.8.4. Recent Developments
- 16.2.8.5. Financials (Based on Availability)
- 16.2.9 SI Group Inc (SK Capital Partners)
- 16.2.9.1. Overview
- 16.2.9.2. Products
- 16.2.9.3. SWOT Analysis
- 16.2.9.4. Recent Developments
- 16.2.9.5. Financials (Based on Availability)
- 16.2.10 Chitec Technology Co Ltd
- 16.2.10.1. Overview
- 16.2.10.2. Products
- 16.2.10.3. SWOT Analysis
- 16.2.10.4. Recent Developments
- 16.2.10.5. Financials (Based on Availability)
- 16.2.11 ADEKA CORPORATION
- 16.2.11.1. Overview
- 16.2.11.2. Products
- 16.2.11.3. SWOT Analysis
- 16.2.11.4. Recent Developments
- 16.2.11.5. Financials (Based on Availability)
- 16.2.12 Lycus Ltd LLC
- 16.2.12.1. Overview
- 16.2.12.2. Products
- 16.2.12.3. SWOT Analysis
- 16.2.12.4. Recent Developments
- 16.2.12.5. Financials (Based on Availability)
- 16.2.13 SONGWON
- 16.2.13.1. Overview
- 16.2.13.2. Products
- 16.2.13.3. SWOT Analysis
- 16.2.13.4. Recent Developments
- 16.2.13.5. Financials (Based on Availability)
- 16.2.14 UniteChem Group*List Not Exhaustive
- 16.2.14.1. Overview
- 16.2.14.2. Products
- 16.2.14.3. SWOT Analysis
- 16.2.14.4. Recent Developments
- 16.2.14.5. Financials (Based on Availability)
- 16.2.15 BASF SE
- 16.2.15.1. Overview
- 16.2.15.2. Products
- 16.2.15.3. SWOT Analysis
- 16.2.15.4. Recent Developments
- 16.2.15.5. Financials (Based on Availability)
- 16.2.1 ALTANA AG
List of Figures
- Figure 1: Global Light Stabilizers Industry Revenue Breakdown (Million, %) by Region 2024 & 2032
- Figure 2: Global Light Stabilizers Industry Volume Breakdown (Kiloton, %) by Region 2024 & 2032
- Figure 3: Asia Pacific Light Stabilizers Industry Revenue (Million), by Country 2024 & 2032
- Figure 4: Asia Pacific Light Stabilizers Industry Volume (Kiloton), by Country 2024 & 2032
- Figure 5: Asia Pacific Light Stabilizers Industry Revenue Share (%), by Country 2024 & 2032
- Figure 6: Asia Pacific Light Stabilizers Industry Volume Share (%), by Country 2024 & 2032
- Figure 7: North America Light Stabilizers Industry Revenue (Million), by Country 2024 & 2032
- Figure 8: North America Light Stabilizers Industry Volume (Kiloton), by Country 2024 & 2032
- Figure 9: North America Light Stabilizers Industry Revenue Share (%), by Country 2024 & 2032
- Figure 10: North America Light Stabilizers Industry Volume Share (%), by Country 2024 & 2032
- Figure 11: Europe Light Stabilizers Industry Revenue (Million), by Country 2024 & 2032
- Figure 12: Europe Light Stabilizers Industry Volume (Kiloton), by Country 2024 & 2032
- Figure 13: Europe Light Stabilizers Industry Revenue Share (%), by Country 2024 & 2032
- Figure 14: Europe Light Stabilizers Industry Volume Share (%), by Country 2024 & 2032
- Figure 15: South America Light Stabilizers Industry Revenue (Million), by Country 2024 & 2032
- Figure 16: South America Light Stabilizers Industry Volume (Kiloton), by Country 2024 & 2032
- Figure 17: South America Light Stabilizers Industry Revenue Share (%), by Country 2024 & 2032
- Figure 18: South America Light Stabilizers Industry Volume Share (%), by Country 2024 & 2032
- Figure 19: Middle East and Africa Light Stabilizers Industry Revenue (Million), by Country 2024 & 2032
- Figure 20: Middle East and Africa Light Stabilizers Industry Volume (Kiloton), by Country 2024 & 2032
- Figure 21: Middle East and Africa Light Stabilizers Industry Revenue Share (%), by Country 2024 & 2032
- Figure 22: Middle East and Africa Light Stabilizers Industry Volume Share (%), by Country 2024 & 2032
- Figure 23: Asia Pacific Light Stabilizers Industry Revenue (Million), by Type 2024 & 2032
- Figure 24: Asia Pacific Light Stabilizers Industry Volume (Kiloton), by Type 2024 & 2032
- Figure 25: Asia Pacific Light Stabilizers Industry Revenue Share (%), by Type 2024 & 2032
- Figure 26: Asia Pacific Light Stabilizers Industry Volume Share (%), by Type 2024 & 2032
- Figure 27: Asia Pacific Light Stabilizers Industry Revenue (Million), by End-User Industry 2024 & 2032
- Figure 28: Asia Pacific Light Stabilizers Industry Volume (Kiloton), by End-User Industry 2024 & 2032
- Figure 29: Asia Pacific Light Stabilizers Industry Revenue Share (%), by End-User Industry 2024 & 2032
- Figure 30: Asia Pacific Light Stabilizers Industry Volume Share (%), by End-User Industry 2024 & 2032
- Figure 31: Asia Pacific Light Stabilizers Industry Revenue (Million), by Country 2024 & 2032
- Figure 32: Asia Pacific Light Stabilizers Industry Volume (Kiloton), by Country 2024 & 2032
- Figure 33: Asia Pacific Light Stabilizers Industry Revenue Share (%), by Country 2024 & 2032
- Figure 34: Asia Pacific Light Stabilizers Industry Volume Share (%), by Country 2024 & 2032
- Figure 35: North America Light Stabilizers Industry Revenue (Million), by Type 2024 & 2032
- Figure 36: North America Light Stabilizers Industry Volume (Kiloton), by Type 2024 & 2032
- Figure 37: North America Light Stabilizers Industry Revenue Share (%), by Type 2024 & 2032
- Figure 38: North America Light Stabilizers Industry Volume Share (%), by Type 2024 & 2032
- Figure 39: North America Light Stabilizers Industry Revenue (Million), by End-User Industry 2024 & 2032
- Figure 40: North America Light Stabilizers Industry Volume (Kiloton), by End-User Industry 2024 & 2032
- Figure 41: North America Light Stabilizers Industry Revenue Share (%), by End-User Industry 2024 & 2032
- Figure 42: North America Light Stabilizers Industry Volume Share (%), by End-User Industry 2024 & 2032
- Figure 43: North America Light Stabilizers Industry Revenue (Million), by Country 2024 & 2032
- Figure 44: North America Light Stabilizers Industry Volume (Kiloton), by Country 2024 & 2032
- Figure 45: North America Light Stabilizers Industry Revenue Share (%), by Country 2024 & 2032
- Figure 46: North America Light Stabilizers Industry Volume Share (%), by Country 2024 & 2032
- Figure 47: Europe Light Stabilizers Industry Revenue (Million), by Type 2024 & 2032
- Figure 48: Europe Light Stabilizers Industry Volume (Kiloton), by Type 2024 & 2032
- Figure 49: Europe Light Stabilizers Industry Revenue Share (%), by Type 2024 & 2032
- Figure 50: Europe Light Stabilizers Industry Volume Share (%), by Type 2024 & 2032
- Figure 51: Europe Light Stabilizers Industry Revenue (Million), by End-User Industry 2024 & 2032
- Figure 52: Europe Light Stabilizers Industry Volume (Kiloton), by End-User Industry 2024 & 2032
- Figure 53: Europe Light Stabilizers Industry Revenue Share (%), by End-User Industry 2024 & 2032
- Figure 54: Europe Light Stabilizers Industry Volume Share (%), by End-User Industry 2024 & 2032
- Figure 55: Europe Light Stabilizers Industry Revenue (Million), by Country 2024 & 2032
- Figure 56: Europe Light Stabilizers Industry Volume (Kiloton), by Country 2024 & 2032
- Figure 57: Europe Light Stabilizers Industry Revenue Share (%), by Country 2024 & 2032
- Figure 58: Europe Light Stabilizers Industry Volume Share (%), by Country 2024 & 2032
- Figure 59: South America Light Stabilizers Industry Revenue (Million), by Type 2024 & 2032
- Figure 60: South America Light Stabilizers Industry Volume (Kiloton), by Type 2024 & 2032
- Figure 61: South America Light Stabilizers Industry Revenue Share (%), by Type 2024 & 2032
- Figure 62: South America Light Stabilizers Industry Volume Share (%), by Type 2024 & 2032
- Figure 63: South America Light Stabilizers Industry Revenue (Million), by End-User Industry 2024 & 2032
- Figure 64: South America Light Stabilizers Industry Volume (Kiloton), by End-User Industry 2024 & 2032
- Figure 65: South America Light Stabilizers Industry Revenue Share (%), by End-User Industry 2024 & 2032
- Figure 66: South America Light Stabilizers Industry Volume Share (%), by End-User Industry 2024 & 2032
- Figure 67: South America Light Stabilizers Industry Revenue (Million), by Country 2024 & 2032
- Figure 68: South America Light Stabilizers Industry Volume (Kiloton), by Country 2024 & 2032
- Figure 69: South America Light Stabilizers Industry Revenue Share (%), by Country 2024 & 2032
- Figure 70: South America Light Stabilizers Industry Volume Share (%), by Country 2024 & 2032
- Figure 71: Middle East and Africa Light Stabilizers Industry Revenue (Million), by Type 2024 & 2032
- Figure 72: Middle East and Africa Light Stabilizers Industry Volume (Kiloton), by Type 2024 & 2032
- Figure 73: Middle East and Africa Light Stabilizers Industry Revenue Share (%), by Type 2024 & 2032
- Figure 74: Middle East and Africa Light Stabilizers Industry Volume Share (%), by Type 2024 & 2032
- Figure 75: Middle East and Africa Light Stabilizers Industry Revenue (Million), by End-User Industry 2024 & 2032
- Figure 76: Middle East and Africa Light Stabilizers Industry Volume (Kiloton), by End-User Industry 2024 & 2032
- Figure 77: Middle East and Africa Light Stabilizers Industry Revenue Share (%), by End-User Industry 2024 & 2032
- Figure 78: Middle East and Africa Light Stabilizers Industry Volume Share (%), by End-User Industry 2024 & 2032
- Figure 79: Middle East and Africa Light Stabilizers Industry Revenue (Million), by Country 2024 & 2032
- Figure 80: Middle East and Africa Light Stabilizers Industry Volume (Kiloton), by Country 2024 & 2032
- Figure 81: Middle East and Africa Light Stabilizers Industry Revenue Share (%), by Country 2024 & 2032
- Figure 82: Middle East and Africa Light Stabilizers Industry Volume Share (%), by Country 2024 & 2032
List of Tables
- Table 1: Global Light Stabilizers Industry Revenue Million Forecast, by Region 2019 & 2032
- Table 2: Global Light Stabilizers Industry Volume Kiloton Forecast, by Region 2019 & 2032
- Table 3: Global Light Stabilizers Industry Revenue Million Forecast, by Type 2019 & 2032
- Table 4: Global Light Stabilizers Industry Volume Kiloton Forecast, by Type 2019 & 2032
- Table 5: Global Light Stabilizers Industry Revenue Million Forecast, by End-User Industry 2019 & 2032
- Table 6: Global Light Stabilizers Industry Volume Kiloton Forecast, by End-User Industry 2019 & 2032
- Table 7: Global Light Stabilizers Industry Revenue Million Forecast, by Region 2019 & 2032
- Table 8: Global Light Stabilizers Industry Volume Kiloton Forecast, by Region 2019 & 2032
- Table 9: Global Light Stabilizers Industry Revenue Million Forecast, by Country 2019 & 2032
- Table 10: Global Light Stabilizers Industry Volume Kiloton Forecast, by Country 2019 & 2032
- Table 11: China Light Stabilizers Industry Revenue (Million) Forecast, by Application 2019 & 2032
- Table 12: China Light Stabilizers Industry Volume (Kiloton) Forecast, by Application 2019 & 2032
- Table 13: India Light Stabilizers Industry Revenue (Million) Forecast, by Application 2019 & 2032
- Table 14: India Light Stabilizers Industry Volume (Kiloton) Forecast, by Application 2019 & 2032
- Table 15: Japan Light Stabilizers Industry Revenue (Million) Forecast, by Application 2019 & 2032
- Table 16: Japan Light Stabilizers Industry Volume (Kiloton) Forecast, by Application 2019 & 2032
- Table 17: South Korea Light Stabilizers Industry Revenue (Million) Forecast, by Application 2019 & 2032
- Table 18: South Korea Light Stabilizers Industry Volume (Kiloton) Forecast, by Application 2019 & 2032
- Table 19: Rest of Asia Pacific Light Stabilizers Industry Revenue (Million) Forecast, by Application 2019 & 2032
- Table 20: Rest of Asia Pacific Light Stabilizers Industry Volume (Kiloton) Forecast, by Application 2019 & 2032
- Table 21: Global Light Stabilizers Industry Revenue Million Forecast, by Country 2019 & 2032
- Table 22: Global Light Stabilizers Industry Volume Kiloton Forecast, by Country 2019 & 2032
- Table 23: United States Light Stabilizers Industry Revenue (Million) Forecast, by Application 2019 & 2032
- Table 24: United States Light Stabilizers Industry Volume (Kiloton) Forecast, by Application 2019 & 2032
- Table 25: Canada Light Stabilizers Industry Revenue (Million) Forecast, by Application 2019 & 2032
- Table 26: Canada Light Stabilizers Industry Volume (Kiloton) Forecast, by Application 2019 & 2032
- Table 27: Mexico Light Stabilizers Industry Revenue (Million) Forecast, by Application 2019 & 2032
- Table 28: Mexico Light Stabilizers Industry Volume (Kiloton) Forecast, by Application 2019 & 2032
- Table 29: Global Light Stabilizers Industry Revenue Million Forecast, by Country 2019 & 2032
- Table 30: Global Light Stabilizers Industry Volume Kiloton Forecast, by Country 2019 & 2032
- Table 31: Germany Light Stabilizers Industry Revenue (Million) Forecast, by Application 2019 & 2032
- Table 32: Germany Light Stabilizers Industry Volume (Kiloton) Forecast, by Application 2019 & 2032
- Table 33: United Kingdom Light Stabilizers Industry Revenue (Million) Forecast, by Application 2019 & 2032
- Table 34: United Kingdom Light Stabilizers Industry Volume (Kiloton) Forecast, by Application 2019 & 2032
- Table 35: France Light Stabilizers Industry Revenue (Million) Forecast, by Application 2019 & 2032
- Table 36: France Light Stabilizers Industry Volume (Kiloton) Forecast, by Application 2019 & 2032
- Table 37: Italy Light Stabilizers Industry Revenue (Million) Forecast, by Application 2019 & 2032
- Table 38: Italy Light Stabilizers Industry Volume (Kiloton) Forecast, by Application 2019 & 2032
- Table 39: Rest of Europe Light Stabilizers Industry Revenue (Million) Forecast, by Application 2019 & 2032
- Table 40: Rest of Europe Light Stabilizers Industry Volume (Kiloton) Forecast, by Application 2019 & 2032
- Table 41: Global Light Stabilizers Industry Revenue Million Forecast, by Country 2019 & 2032
- Table 42: Global Light Stabilizers Industry Volume Kiloton Forecast, by Country 2019 & 2032
- Table 43: Brazil Light Stabilizers Industry Revenue (Million) Forecast, by Application 2019 & 2032
- Table 44: Brazil Light Stabilizers Industry Volume (Kiloton) Forecast, by Application 2019 & 2032
- Table 45: Argentina Light Stabilizers Industry Revenue (Million) Forecast, by Application 2019 & 2032
- Table 46: Argentina Light Stabilizers Industry Volume (Kiloton) Forecast, by Application 2019 & 2032
- Table 47: Rest of South America Light Stabilizers Industry Revenue (Million) Forecast, by Application 2019 & 2032
- Table 48: Rest of South America Light Stabilizers Industry Volume (Kiloton) Forecast, by Application 2019 & 2032
- Table 49: Global Light Stabilizers Industry Revenue Million Forecast, by Country 2019 & 2032
- Table 50: Global Light Stabilizers Industry Volume Kiloton Forecast, by Country 2019 & 2032
- Table 51: Saudi Arabia Light Stabilizers Industry Revenue (Million) Forecast, by Application 2019 & 2032
- Table 52: Saudi Arabia Light Stabilizers Industry Volume (Kiloton) Forecast, by Application 2019 & 2032
- Table 53: South Africa Light Stabilizers Industry Revenue (Million) Forecast, by Application 2019 & 2032
- Table 54: South Africa Light Stabilizers Industry Volume (Kiloton) Forecast, by Application 2019 & 2032
- Table 55: Rest of Middle East and Africa Light Stabilizers Industry Revenue (Million) Forecast, by Application 2019 & 2032
- Table 56: Rest of Middle East and Africa Light Stabilizers Industry Volume (Kiloton) Forecast, by Application 2019 & 2032
- Table 57: Global Light Stabilizers Industry Revenue Million Forecast, by Type 2019 & 2032
- Table 58: Global Light Stabilizers Industry Volume Kiloton Forecast, by Type 2019 & 2032
- Table 59: Global Light Stabilizers Industry Revenue Million Forecast, by End-User Industry 2019 & 2032
- Table 60: Global Light Stabilizers Industry Volume Kiloton Forecast, by End-User Industry 2019 & 2032
- Table 61: Global Light Stabilizers Industry Revenue Million Forecast, by Country 2019 & 2032
- Table 62: Global Light Stabilizers Industry Volume Kiloton Forecast, by Country 2019 & 2032
- Table 63: China Light Stabilizers Industry Revenue (Million) Forecast, by Application 2019 & 2032
- Table 64: China Light Stabilizers Industry Volume (Kiloton) Forecast, by Application 2019 & 2032
- Table 65: India Light Stabilizers Industry Revenue (Million) Forecast, by Application 2019 & 2032
- Table 66: India Light Stabilizers Industry Volume (Kiloton) Forecast, by Application 2019 & 2032
- Table 67: Japan Light Stabilizers Industry Revenue (Million) Forecast, by Application 2019 & 2032
- Table 68: Japan Light Stabilizers Industry Volume (Kiloton) Forecast, by Application 2019 & 2032
- Table 69: South Korea Light Stabilizers Industry Revenue (Million) Forecast, by Application 2019 & 2032
- Table 70: South Korea Light Stabilizers Industry Volume (Kiloton) Forecast, by Application 2019 & 2032
- Table 71: Rest of Asia Pacific Light Stabilizers Industry Revenue (Million) Forecast, by Application 2019 & 2032
- Table 72: Rest of Asia Pacific Light Stabilizers Industry Volume (Kiloton) Forecast, by Application 2019 & 2032
- Table 73: Global Light Stabilizers Industry Revenue Million Forecast, by Type 2019 & 2032
- Table 74: Global Light Stabilizers Industry Volume Kiloton Forecast, by Type 2019 & 2032
- Table 75: Global Light Stabilizers Industry Revenue Million Forecast, by End-User Industry 2019 & 2032
- Table 76: Global Light Stabilizers Industry Volume Kiloton Forecast, by End-User Industry 2019 & 2032
- Table 77: Global Light Stabilizers Industry Revenue Million Forecast, by Country 2019 & 2032
- Table 78: Global Light Stabilizers Industry Volume Kiloton Forecast, by Country 2019 & 2032
- Table 79: United States Light Stabilizers Industry Revenue (Million) Forecast, by Application 2019 & 2032
- Table 80: United States Light Stabilizers Industry Volume (Kiloton) Forecast, by Application 2019 & 2032
- Table 81: Canada Light Stabilizers Industry Revenue (Million) Forecast, by Application 2019 & 2032
- Table 82: Canada Light Stabilizers Industry Volume (Kiloton) Forecast, by Application 2019 & 2032
- Table 83: Mexico Light Stabilizers Industry Revenue (Million) Forecast, by Application 2019 & 2032
- Table 84: Mexico Light Stabilizers Industry Volume (Kiloton) Forecast, by Application 2019 & 2032
- Table 85: Global Light Stabilizers Industry Revenue Million Forecast, by Type 2019 & 2032
- Table 86: Global Light Stabilizers Industry Volume Kiloton Forecast, by Type 2019 & 2032
- Table 87: Global Light Stabilizers Industry Revenue Million Forecast, by End-User Industry 2019 & 2032
- Table 88: Global Light Stabilizers Industry Volume Kiloton Forecast, by End-User Industry 2019 & 2032
- Table 89: Global Light Stabilizers Industry Revenue Million Forecast, by Country 2019 & 2032
- Table 90: Global Light Stabilizers Industry Volume Kiloton Forecast, by Country 2019 & 2032
- Table 91: Germany Light Stabilizers Industry Revenue (Million) Forecast, by Application 2019 & 2032
- Table 92: Germany Light Stabilizers Industry Volume (Kiloton) Forecast, by Application 2019 & 2032
- Table 93: United Kingdom Light Stabilizers Industry Revenue (Million) Forecast, by Application 2019 & 2032
- Table 94: United Kingdom Light Stabilizers Industry Volume (Kiloton) Forecast, by Application 2019 & 2032
- Table 95: France Light Stabilizers Industry Revenue (Million) Forecast, by Application 2019 & 2032
- Table 96: France Light Stabilizers Industry Volume (Kiloton) Forecast, by Application 2019 & 2032
- Table 97: Italy Light Stabilizers Industry Revenue (Million) Forecast, by Application 2019 & 2032
- Table 98: Italy Light Stabilizers Industry Volume (Kiloton) Forecast, by Application 2019 & 2032
- Table 99: Rest of Europe Light Stabilizers Industry Revenue (Million) Forecast, by Application 2019 & 2032
- Table 100: Rest of Europe Light Stabilizers Industry Volume (Kiloton) Forecast, by Application 2019 & 2032
- Table 101: Global Light Stabilizers Industry Revenue Million Forecast, by Type 2019 & 2032
- Table 102: Global Light Stabilizers Industry Volume Kiloton Forecast, by Type 2019 & 2032
- Table 103: Global Light Stabilizers Industry Revenue Million Forecast, by End-User Industry 2019 & 2032
- Table 104: Global Light Stabilizers Industry Volume Kiloton Forecast, by End-User Industry 2019 & 2032
- Table 105: Global Light Stabilizers Industry Revenue Million Forecast, by Country 2019 & 2032
- Table 106: Global Light Stabilizers Industry Volume Kiloton Forecast, by Country 2019 & 2032
- Table 107: Brazil Light Stabilizers Industry Revenue (Million) Forecast, by Application 2019 & 2032
- Table 108: Brazil Light Stabilizers Industry Volume (Kiloton) Forecast, by Application 2019 & 2032
- Table 109: Argentina Light Stabilizers Industry Revenue (Million) Forecast, by Application 2019 & 2032
- Table 110: Argentina Light Stabilizers Industry Volume (Kiloton) Forecast, by Application 2019 & 2032
- Table 111: Rest of South America Light Stabilizers Industry Revenue (Million) Forecast, by Application 2019 & 2032
- Table 112: Rest of South America Light Stabilizers Industry Volume (Kiloton) Forecast, by Application 2019 & 2032
- Table 113: Global Light Stabilizers Industry Revenue Million Forecast, by Type 2019 & 2032
- Table 114: Global Light Stabilizers Industry Volume Kiloton Forecast, by Type 2019 & 2032
- Table 115: Global Light Stabilizers Industry Revenue Million Forecast, by End-User Industry 2019 & 2032
- Table 116: Global Light Stabilizers Industry Volume Kiloton Forecast, by End-User Industry 2019 & 2032
- Table 117: Global Light Stabilizers Industry Revenue Million Forecast, by Country 2019 & 2032
- Table 118: Global Light Stabilizers Industry Volume Kiloton Forecast, by Country 2019 & 2032
- Table 119: Saudi Arabia Light Stabilizers Industry Revenue (Million) Forecast, by Application 2019 & 2032
- Table 120: Saudi Arabia Light Stabilizers Industry Volume (Kiloton) Forecast, by Application 2019 & 2032
- Table 121: South Africa Light Stabilizers Industry Revenue (Million) Forecast, by Application 2019 & 2032
- Table 122: South Africa Light Stabilizers Industry Volume (Kiloton) Forecast, by Application 2019 & 2032
- Table 123: Rest of Middle East and Africa Light Stabilizers Industry Revenue (Million) Forecast, by Application 2019 & 2032
- Table 124: Rest of Middle East and Africa Light Stabilizers Industry Volume (Kiloton) Forecast, by Application 2019 & 2032
Frequently Asked Questions
1. What is the projected Compound Annual Growth Rate (CAGR) of the Light Stabilizers Industry?
The projected CAGR is approximately 5.96%.
2. Which companies are prominent players in the Light Stabilizers Industry?
Key companies in the market include ALTANA AG, Eastman Chemical Company, Rianlon Corporation, Mayzo Inc, Solvay, SABO S p A, CLARIANT, Everlight Chemical Industrial Co, SI Group Inc (SK Capital Partners), Chitec Technology Co Ltd, ADEKA CORPORATION, Lycus Ltd LLC, SONGWON, UniteChem Group*List Not Exhaustive, BASF SE.
3. What are the main segments of the Light Stabilizers Industry?
The market segments include Type, End-User Industry.
4. Can you provide details about the market size?
The market size is estimated to be USD 1.36 Million as of 2022.
5. What are some drivers contributing to market growth?
Rising Consumption in Polymer Industry; Increasing Demand for Wood Coatings.
6. What are the notable trends driving market growth?
Automotive Sector to Dominate the Market.
7. Are there any restraints impacting market growth?
Fluctuations in Raw Material Prices.
8. Can you provide examples of recent developments in the market?
July 2022: Solvay announced the creation of an innovative new UV-C stabilizer range. The UV-C spectrum (200-280 nm) was used to treat polyolefin surfaces in these products, intended for use in demanding hygiene applications where COVID and hospital-acquired infections were combated. The development of the new unique stabilizing technique, which was the first to address the dangers of polyolefin deterioration, discoloration, and microcrack formation brought on by frequent exposure to UV-C radiation, marks a significant turning point for the polyolefin industry.
9. What pricing options are available for accessing the report?
Pricing options include single-user, multi-user, and enterprise licenses priced at USD 4750, USD 5250, and USD 8750 respectively.
10. Is the market size provided in terms of value or volume?
The market size is provided in terms of value, measured in Million and volume, measured in Kiloton.
11. Are there any specific market keywords associated with the report?
Yes, the market keyword associated with the report is "Light Stabilizers Industry," which aids in identifying and referencing the specific market segment covered.
12. How do I determine which pricing option suits my needs best?
The pricing options vary based on user requirements and access needs. Individual users may opt for single-user licenses, while businesses requiring broader access may choose multi-user or enterprise licenses for cost-effective access to the report.
13. Are there any additional resources or data provided in the Light Stabilizers Industry report?
While the report offers comprehensive insights, it's advisable to review the specific contents or supplementary materials provided to ascertain if additional resources or data are available.
14. How can I stay updated on further developments or reports in the Light Stabilizers Industry?
To stay informed about further developments, trends, and reports in the Light Stabilizers Industry, consider subscribing to industry newsletters, following relevant companies and organizations, or regularly checking reputable industry news sources and publications.
Methodology
Step 1 - Identification of Relevant Samples Size from Population Database


Step 2 - Approaches for Defining Global Market Size (Value, Volume* & Price*)

Note*: In applicable scenarios
Step 3 - Data Sources
Primary Research
- Web Analytics
- Survey Reports
- Research Institute
- Latest Research Reports
- Opinion Leaders
Secondary Research
- Annual Reports
- White Paper
- Latest Press Release
- Industry Association
- Paid Database
- Investor Presentations

Step 4 - Data Triangulation
Involves using different sources of information in order to increase the validity of a study
These sources are likely to be stakeholders in a program - participants, other researchers, program staff, other community members, and so on.
Then we put all data in single framework & apply various statistical tools to find out the dynamic on the market.
During the analysis stage, feedback from the stakeholder groups would be compared to determine areas of agreement as well as areas of divergence


