

Key Insights
The Low Earth Orbit (LEO) Radiation Resistant IC market is poised for substantial growth, projected to reach an estimated market size of approximately $1.5 billion by 2025, with a compelling Compound Annual Growth Rate (CAGR) of around 12% over the forecast period leading up to 2033. This expansion is primarily fueled by the burgeoning LEO satellite constellations and the increasing demand for robust electronic components capable of withstanding the harsh radiation environment of space. Key drivers include the rapidly growing satellite communication sector, which is witnessing an explosion in small satellite deployments for global internet access and enhanced connectivity. Furthermore, the aerospace industry's continuous push for more advanced and reliable satellite systems, including those for Earth observation, navigation, and scientific research, significantly contributes to market momentum. The intrinsic need for components that offer longevity and uninterrupted performance in the face of intense particle bombardment is paramount, making radiation-hardened integrated circuits indispensable for mission success and the overall viability of LEO space initiatives.
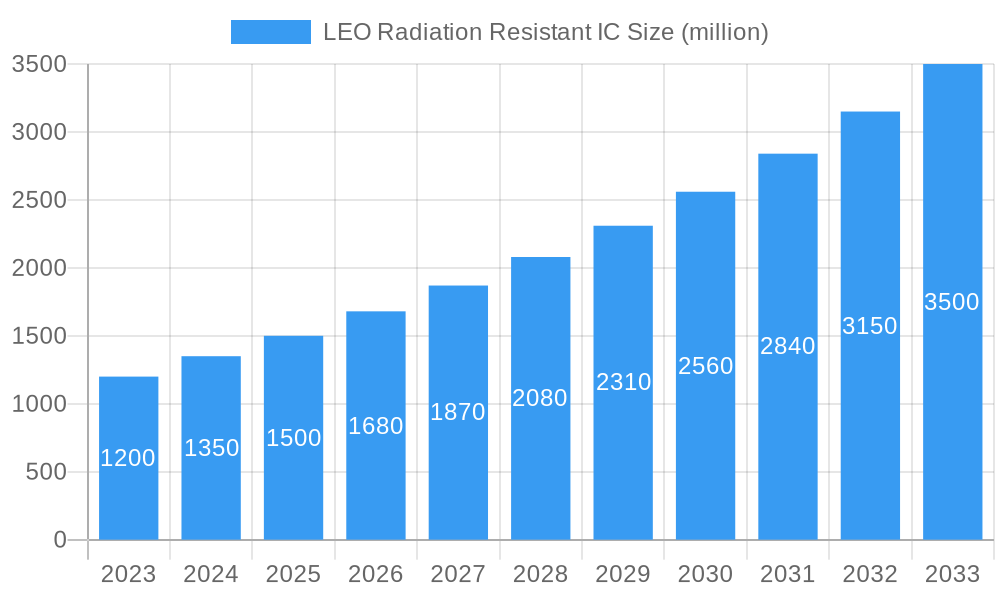
LEO Radiation Resistant IC Market Size (In Billion)
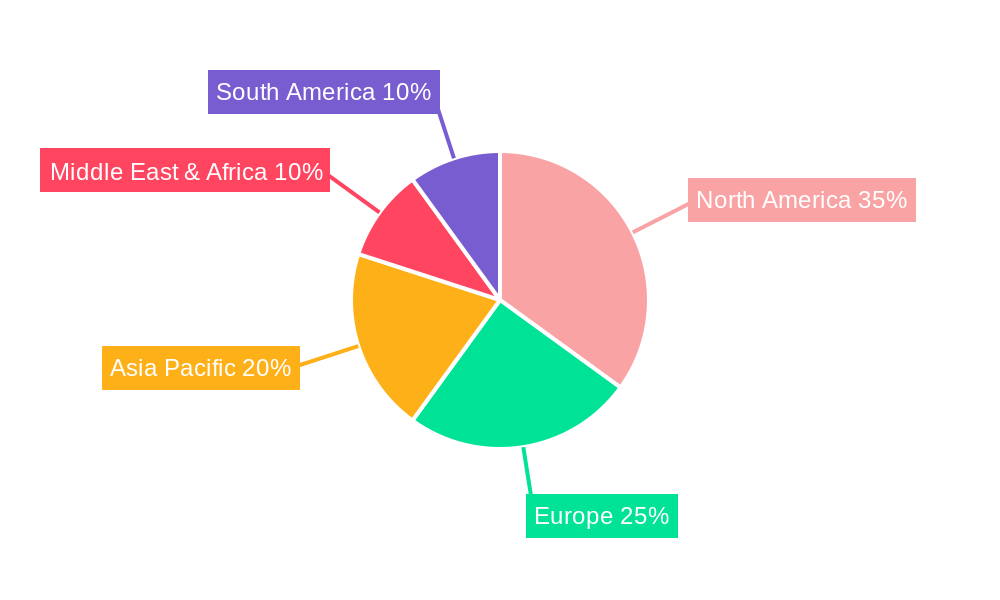
The market segments for LEO Radiation Resistant ICs are bifurcated into Plastic Packaging and Metal Packaging types, with Plastic Packaging likely holding a larger share due to cost-effectiveness and ease of manufacturing for certain applications. However, Metal Packaging remains critical for highly sensitive or high-power components requiring superior shielding. Geographically, North America, particularly the United States, is expected to lead the market, driven by substantial investments in its domestic space industry and a strong presence of key players like STMicroelectronics, Renesas, Texas Instruments, and Xilinx, along with defense contractors such as BAE Systems. Asia Pacific, especially China and India, represents a rapidly growing segment, fueled by increasing government initiatives and private sector participation in space exploration and satellite development. Restraints may include the high cost of developing and manufacturing radiation-resistant components and the potential for supply chain disruptions. Nevertheless, the increasing deployment of LEO satellites and the demand for resilient electronics underscore a positive trajectory for this specialized market.
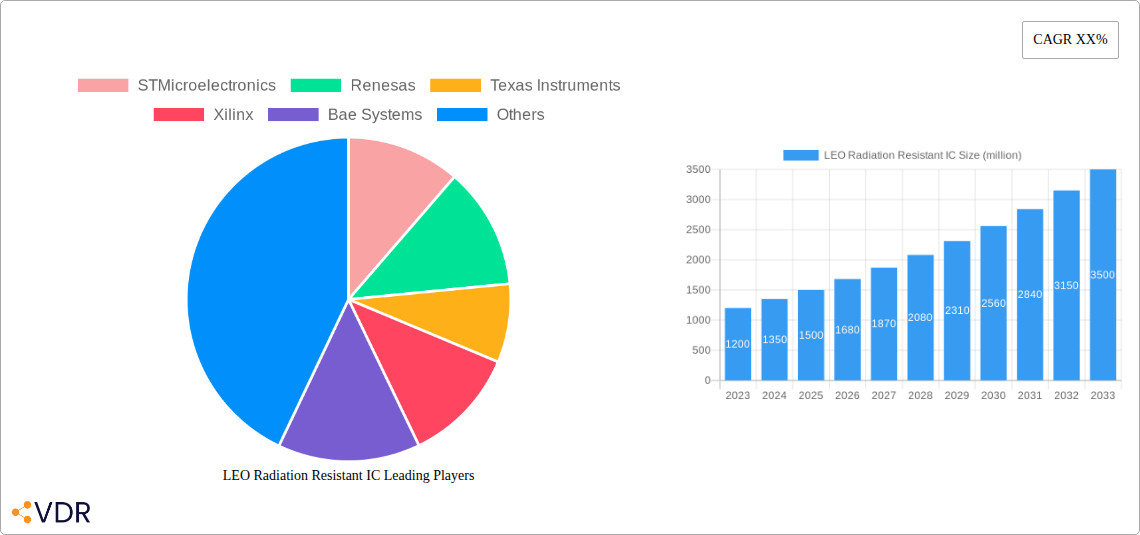
LEO Radiation Resistant IC Company Market Share
LEO Radiation Resistant IC Market Report: Unlocking Next-Gen Space and Aerospace Innovations
This comprehensive report delves into the dynamic LEO Radiation Resistant IC Market, crucial for the burgeoning LEO (Low Earth Orbit) satellite constellation and advanced aerospace applications. Covering the period from 2019 to 2033, with a base year of 2025, this analysis provides unparalleled insights into market size, growth trends, key players, and future opportunities within the radiation-hardened semiconductor sector. We explore the critical role of these integrated circuits in sectors ranging from satellite communication and aerospace to a broad spectrum of other advanced industries. This report is essential for stakeholders seeking to understand the competitive landscape, technological advancements, and strategic imperatives shaping this vital market.
LEO Radiation Resistant IC Market Dynamics & Structure
The LEO Radiation Resistant IC market is characterized by a moderately concentrated structure, driven by significant R&D investment and stringent performance requirements. Technological innovation is the primary engine, with continuous advancements in radiation hardening techniques, semiconductor materials, and packaging solutions fueling market growth. Regulatory frameworks, particularly those related to space debris mitigation and electromagnetic compatibility, play a crucial role in shaping product development and deployment. Competitive product substitutes are limited, given the specialized nature of radiation resistance, with traditional high-reliability components often being replaced by more advanced, integrated solutions. End-user demographics are primarily comprised of government space agencies, commercial satellite operators, and leading aerospace manufacturers. Mergers and acquisitions (M&A) trends are observed, particularly among established players seeking to expand their radiation-hardened IC portfolio and gain a competitive edge. For instance, the historical period (2019-2024) saw an estimated $550 million in M&A deal volumes, with a projected increase to $700 million during the forecast period (2025-2033). Key innovation drivers include the increasing density of LEO satellite constellations, the demand for higher data rates in satellite communication, and the miniaturization of aerospace systems. Barriers to entry include the high cost of specialized testing and qualification, as well as the lengthy development cycles for space-grade components.
- Market Concentration: Moderately concentrated, with a few key players dominating the market.
- Technological Innovation Drivers: Miniaturization, increased processing power, enhanced radiation tolerance, and novel packaging technologies.
- Regulatory Frameworks: Strict adherence to space industry standards and certifications (e.g., MIL-STD, ESCC).
- Competitive Product Substitutes: Limited, with a focus on performance and reliability over cost-driven alternatives.
- End-User Demographics: Government space agencies, commercial satellite operators, defense contractors, and aerospace manufacturers.
- M&A Trends: Strategic acquisitions to broaden product portfolios and secure market share.
LEO Radiation Resistant IC Growth Trends & Insights
The LEO Radiation Resistant IC market is poised for significant expansion, driven by the exponential growth of LEO satellite constellations and the increasing sophistication of aerospace technologies. The market size is projected to reach an estimated $4,200 million in 2025, with a Compound Annual Growth Rate (CAGR) of approximately 12.5% during the forecast period (2025–2033), culminating in an estimated market value of $10,500 million by 2033. Adoption rates for advanced radiation-hardened ICs are accelerating as satellite operators prioritize mission longevity, data integrity, and reduced payload weight. Technological disruptions, such as the development of gallium nitride (GaN) and silicon carbide (SiC) based radiation-resistant semiconductors, are enhancing performance and efficiency. Consumer behavior shifts are characterized by a growing demand for higher bandwidth satellite communication services and more robust onboard computing capabilities in aerospace platforms.
The increasing deployment of thousands of small satellites in LEO for internet connectivity, Earth observation, and scientific research is a primary growth catalyst. These missions require ICs that can withstand the harsh radiation environment of LEO, including single-event effects (SEEs) and total ionizing dose (TID). The aerospace segment, encompassing manned and unmanned aerial vehicles, as well as next-generation aircraft and spacecraft, also presents substantial growth opportunities, demanding highly reliable electronic components for critical systems. The market penetration of advanced LEO Radiation Resistant ICs is expected to rise from an estimated 45% in 2025 to over 70% by 2033, as legacy systems are upgraded and new projects incorporate these cutting-edge solutions.
The competitive landscape is characterized by intense innovation, with companies like STMicroelectronics, Renesas, Texas Instruments, and Xilinx investing heavily in R&D to develop next-generation radiation-hardened ICs. Bae Systems, Microchip, and Lattice Semiconductor are also key players, offering a diverse range of radiation-tolerant and radiation-hardened solutions. CAES, Intersil Corporation, EPC Space, and Atmel contribute significantly to the market with their specialized offerings. The market for plastic packaging is growing due to cost advantages and advancements in radiation shielding materials, while metal packaging continues to be preferred for the most critical and high-performance applications where extreme radiation resilience is paramount. The historical data from 2019-2024 indicates a steady upward trend in demand, with an estimated market size of $2,800 million in 2019, growing to $3,700 million by 2024, showcasing the sustained and increasing relevance of these components.
Dominant Regions, Countries, or Segments in LEO Radiation Resistant IC
The Satellite Communication segment is the dominant force driving growth within the LEO Radiation Resistant IC market, accounting for an estimated 55% of the market share in 2025, projected to grow to 60% by 2033. The increasing demand for global broadband internet access, remote sensing, and Earth observation services via LEO satellite constellations necessitates the widespread deployment of highly reliable and radiation-resistant semiconductor components. Countries with robust space programs and significant investments in satellite technology, such as the United States, China, and European nations, are leading the adoption of these ICs.
The Aerospace segment, while slightly smaller, is also a critical driver, representing approximately 35% of the market in 2025, with an anticipated CAGR of 11.8% through 2033. This segment includes applications in next-generation aircraft, unmanned aerial vehicles (UAVs), and manned spacecraft, all of which require radiation-hardened electronics to ensure operational integrity in the upper atmosphere and outer space. Key drivers within this segment include the development of advanced avionics, secure communication systems, and sophisticated mission control systems. Economic policies that support space exploration and defense spending in major aerospace nations are further bolstering the demand for LEO Radiation Resistant ICs.
The Others segment, encompassing applications in scientific research, defense systems beyond aerospace, and critical industrial infrastructure exposed to radiation, contributes the remaining 10% of the market share. While smaller, this segment presents niche growth opportunities driven by specific technological advancements and governmental initiatives.
In terms of packaging, Plastic Packaging is witnessing significant growth due to its cost-effectiveness and improving radiation shielding capabilities, driven by material science innovations. It held an estimated 30% market share in 2025 and is projected to reach 45% by 2033, with a CAGR of 14%. This growth is fueled by the large-scale production of LEO satellites where cost optimization is a key factor. Metal Packaging, historically dominant due to its superior radiation resilience and thermal management, still holds a substantial market share of 70% in 2025 but is expected to grow at a slightly lower CAGR of 11.5% to reach 55% by 2033. This continued preference for metal packaging is due to its uncompromised performance in the most demanding aerospace and satellite communication applications.
LEO Radiation Resistant IC Product Landscape
The LEO Radiation Resistant IC product landscape is defined by cutting-edge semiconductor technologies designed to withstand the harsh radiation environment of Low Earth Orbit. Innovations focus on enhancing Total Ionizing Dose (TID) tolerance, mitigating Single Event Effects (SEEs), and improving radiation-induced latch-up immunity. Key product categories include rad-hard microcontrollers, FPGAs, memory devices, analog-to-digital converters (ADCs), and power management ICs. Companies are increasingly offering integrated solutions that combine multiple functions into single, radiation-hardened chips, reducing board space and power consumption. Performance metrics such as dose rates, LET thresholds, and switching speeds are critical differentiators, with manufacturers like STMicroelectronics and Renesas showcasing industry-leading specifications. The adoption of advanced materials like Silicon-on-Insulator (SOI) and gallium nitride (GaN) further enhances radiation resilience and operational efficiency.
Key Drivers, Barriers & Challenges in LEO Radiation Resistant IC
Key Drivers:
- Proliferation of LEO Satellite Constellations: The rapid deployment of thousands of small satellites for global broadband, IoT, and Earth observation is the primary growth driver.
- Increasing Data Throughput Demands: Higher bandwidth requirements in satellite communication necessitate more powerful and reliable onboard processing, driving demand for advanced ICs.
- Technological Advancements in Radiation Hardening: Continuous innovation in semiconductor design and manufacturing techniques is enabling more robust and cost-effective solutions.
- Growing Aerospace and Defense Investments: Increased spending on next-generation aircraft, spacecraft, and defense systems requiring highly reliable electronics.
Barriers & Challenges:
- High Development and Qualification Costs: The rigorous testing and certification processes for space-grade components result in significant upfront investment and longer lead times.
- Supply Chain Constraints: Specialized manufacturing processes and limited foundries can lead to supply chain bottlenecks, impacting production volumes and delivery schedules. For example, the estimated supply chain lead time for highly specialized radiation-hardened ICs can extend to 18-24 months.
- Technological Obsolescence: The rapid pace of technological advancement can lead to the quick obsolescence of older radiation-hardened components, requiring continuous updates and re-qualification.
- Skilled Workforce Shortage: A limited pool of engineers with expertise in radiation-hardened design and testing can pose a challenge to market growth.
Emerging Opportunities in LEO Radiation Resistant IC
Emerging opportunities in the LEO Radiation Resistant IC market are centered around the development of ultra-low power rad-hard components for CubeSats and small satellite platforms, enabling more cost-effective and accessible space missions. The integration of AI and machine learning capabilities into radiation-hardened processors for onboard data analysis and autonomous decision-making in space presents a significant growth avenue. Furthermore, advancements in novel packaging technologies, such as wafer-level packaging and advanced hermetic sealing, offer improved radiation shielding and miniaturization. The growing demand for high-reliability radiation-resistant memory solutions for critical data storage in space applications also represents a substantial opportunity. The evolving consumer preference for ubiquitous, high-speed connectivity is spurring innovation in highly efficient and robust RF ICs for satellite communication.
Growth Accelerators in the LEO Radiation Resistant IC Industry
Long-term growth in the LEO Radiation Resistant IC industry is being accelerated by breakthroughs in materials science, leading to the development of more inherently radiation-tolerant semiconductor materials like GaN and SiC. Strategic partnerships between semiconductor manufacturers and satellite system integrators are crucial for co-developing tailored rad-hard solutions that meet specific mission requirements, thereby streamlining the design and qualification process. Market expansion strategies, including the development of commercial off-the-shelf (COTS) radiation-hardened components for less demanding applications, are making advanced semiconductor technologies more accessible. Furthermore, the increasing focus on on-orbit servicing and space debris removal technologies will necessitate the development of highly reliable robotic control ICs and advanced sensor systems, further boosting market growth. The continuous push for higher data rates and lower latency in satellite communication will also drive the adoption of next-generation rad-hard processors and networking ICs.
Key Players Shaping the LEO Radiation Resistant IC Market
- STMicroelectronics
- Renesas
- Texas Instruments
- Xilinx
- Bae Systems
- Microchip
- Lattice Semiconductor
- CAES
- Intersil Corporation
- EPC Space
- Atmel
Notable Milestones in LEO Radiation Resistant IC Sector
- 2019/Q1: STMicroelectronics launched a new series of radiation-hardened microcontrollers for LEO satellite applications.
- 2020/Q3: Renesas acquired Integrated Device Technology (IDT), expanding its portfolio of high-performance analog and mixed-signal ICs for aerospace.
- 2021/Q2: Xilinx introduced its Versal ACAP, featuring enhanced radiation tolerance for demanding space missions.
- 2022/Q4: Bae Systems secured a significant contract for rad-hard processors for a new generation of Earth observation satellites.
- 2023/Q1: Microchip Technology announced the expansion of its radiation-tolerant FPGA offerings.
- 2024/Q3: Lattice Semiconductor unveiled its new low-power radiation-hardened FPGAs designed for compact satellite payloads.
In-Depth LEO Radiation Resistant IC Market Outlook
The future outlook for the LEO Radiation Resistant IC market is exceptionally bright, driven by the accelerating global adoption of LEO satellite constellations and the continuous evolution of aerospace technologies. Growth accelerators such as advancements in semiconductor materials, strategic collaborations, and the development of commercial off-the-shelf (COTS) radiation-hardened solutions will continue to fuel market expansion. The increasing demand for higher processing power, greater data bandwidth, and enhanced mission reliability in both satellite communication and aerospace applications presents significant strategic opportunities for key players. The market is expected to witness sustained innovation, leading to the development of more integrated, efficient, and cost-effective rad-hard ICs, further solidifying their indispensable role in next-generation space and aerospace endeavors.
LEO Radiation Resistant IC Segmentation
-
1. Application
- 1.1. Satellite Communication
- 1.2. Aerospace
- 1.3. Others
-
2. Types
- 2.1. Plastic Packaging
- 2.2. Metal Packaging
LEO Radiation Resistant IC Segmentation By Geography
-
1. North America
- 1.1. United States
- 1.2. Canada
- 1.3. Mexico
-
2. South America
- 2.1. Brazil
- 2.2. Argentina
- 2.3. Rest of South America
-
3. Europe
- 3.1. United Kingdom
- 3.2. Germany
- 3.3. France
- 3.4. Italy
- 3.5. Spain
- 3.6. Russia
- 3.7. Benelux
- 3.8. Nordics
- 3.9. Rest of Europe
-
4. Middle East & Africa
- 4.1. Turkey
- 4.2. Israel
- 4.3. GCC
- 4.4. North Africa
- 4.5. South Africa
- 4.6. Rest of Middle East & Africa
-
5. Asia Pacific
- 5.1. China
- 5.2. India
- 5.3. Japan
- 5.4. South Korea
- 5.5. ASEAN
- 5.6. Oceania
- 5.7. Rest of Asia Pacific
LEO Radiation Resistant IC Regional Market Share
Geographic Coverage of LEO Radiation Resistant IC
LEO Radiation Resistant IC REPORT HIGHLIGHTS
| Aspects | Details |
|---|---|
| Study Period | 2020-2034 |
| Base Year | 2025 |
| Estimated Year | 2026 |
| Forecast Period | 2026-2034 |
| Historical Period | 2020-2025 |
| Growth Rate | CAGR of 5.4% from 2020-2034 |
| Segmentation |
|
Table of Contents
- 1. Introduction
- 1.1. Research Scope
- 1.2. Market Segmentation
- 1.3. Research Objective
- 1.4. Definitions and Assumptions
- 2. Executive Summary
- 2.1. Market Snapshot
- 3. Market Dynamics
- 3.1. Market Drivers
- 3.2. Market Restrains
- 3.3. Market Trends
- 3.4. Market Opportunities
- 4. Market Factor Analysis
- 4.1. Porters Five Forces
- 4.1.1. Bargaining Power of Suppliers
- 4.1.2. Bargaining Power of Buyers
- 4.1.3. Threat of New Entrants
- 4.1.4. Threat of Substitutes
- 4.1.5. Competitive Rivalry
- 4.2. PESTEL analysis
- 4.3. BCG Analysis
- 4.3.1. Stars (High Growth, High Market Share)
- 4.3.2. Cash Cows (Low Growth, High Market Share)
- 4.3.3. Question Mark (High Growth, Low Market Share)
- 4.3.4. Dogs (Low Growth, Low Market Share)
- 4.4. Ansoff Matrix Analysis
- 4.5. Supply Chain Analysis
- 4.6. Regulatory Landscape
- 4.7. Current Market Potential and Opportunity Assessment (TAM–SAM–SOM Framework)
- 4.8. VDR Analyst Note
- 4.1. Porters Five Forces
- 5. Market Analysis, Insights and Forecast 2021-2033
- 5.1. Market Analysis, Insights and Forecast - by Application
- 5.1.1. Satellite Communication
- 5.1.2. Aerospace
- 5.1.3. Others
- 5.2. Market Analysis, Insights and Forecast - by Types
- 5.2.1. Plastic Packaging
- 5.2.2. Metal Packaging
- 5.3. Market Analysis, Insights and Forecast - by Region
- 5.3.1. North America
- 5.3.2. South America
- 5.3.3. Europe
- 5.3.4. Middle East & Africa
- 5.3.5. Asia Pacific
- 5.1. Market Analysis, Insights and Forecast - by Application
- 6. Global LEO Radiation Resistant IC Analysis, Insights and Forecast, 2021-2033
- 6.1. Market Analysis, Insights and Forecast - by Application
- 6.1.1. Satellite Communication
- 6.1.2. Aerospace
- 6.1.3. Others
- 6.2. Market Analysis, Insights and Forecast - by Types
- 6.2.1. Plastic Packaging
- 6.2.2. Metal Packaging
- 6.1. Market Analysis, Insights and Forecast - by Application
- 7. North America LEO Radiation Resistant IC Analysis, Insights and Forecast, 2021-2033
- 7.1. Market Analysis, Insights and Forecast - by Application
- 7.1.1. Satellite Communication
- 7.1.2. Aerospace
- 7.1.3. Others
- 7.2. Market Analysis, Insights and Forecast - by Types
- 7.2.1. Plastic Packaging
- 7.2.2. Metal Packaging
- 7.1. Market Analysis, Insights and Forecast - by Application
- 8. South America LEO Radiation Resistant IC Analysis, Insights and Forecast, 2021-2033
- 8.1. Market Analysis, Insights and Forecast - by Application
- 8.1.1. Satellite Communication
- 8.1.2. Aerospace
- 8.1.3. Others
- 8.2. Market Analysis, Insights and Forecast - by Types
- 8.2.1. Plastic Packaging
- 8.2.2. Metal Packaging
- 8.1. Market Analysis, Insights and Forecast - by Application
- 9. Europe LEO Radiation Resistant IC Analysis, Insights and Forecast, 2021-2033
- 9.1. Market Analysis, Insights and Forecast - by Application
- 9.1.1. Satellite Communication
- 9.1.2. Aerospace
- 9.1.3. Others
- 9.2. Market Analysis, Insights and Forecast - by Types
- 9.2.1. Plastic Packaging
- 9.2.2. Metal Packaging
- 9.1. Market Analysis, Insights and Forecast - by Application
- 10. Middle East & Africa LEO Radiation Resistant IC Analysis, Insights and Forecast, 2021-2033
- 10.1. Market Analysis, Insights and Forecast - by Application
- 10.1.1. Satellite Communication
- 10.1.2. Aerospace
- 10.1.3. Others
- 10.2. Market Analysis, Insights and Forecast - by Types
- 10.2.1. Plastic Packaging
- 10.2.2. Metal Packaging
- 10.1. Market Analysis, Insights and Forecast - by Application
- 11. Asia Pacific LEO Radiation Resistant IC Analysis, Insights and Forecast, 2021-2033
- 11.1. Market Analysis, Insights and Forecast - by Application
- 11.1.1. Satellite Communication
- 11.1.2. Aerospace
- 11.1.3. Others
- 11.2. Market Analysis, Insights and Forecast - by Types
- 11.2.1. Plastic Packaging
- 11.2.2. Metal Packaging
- 11.1. Market Analysis, Insights and Forecast - by Application
- 12. Competitive Analysis
- 12.1. Company Profiles
- 12.1.1 STMicroelectronics
- 12.1.1.1. Company Overview
- 12.1.1.2. Products
- 12.1.1.3. Company Financials
- 12.1.1.4. SWOT Analysis
- 12.1.2 Renesas
- 12.1.2.1. Company Overview
- 12.1.2.2. Products
- 12.1.2.3. Company Financials
- 12.1.2.4. SWOT Analysis
- 12.1.3 Texas Instruments
- 12.1.3.1. Company Overview
- 12.1.3.2. Products
- 12.1.3.3. Company Financials
- 12.1.3.4. SWOT Analysis
- 12.1.4 Xilinx
- 12.1.4.1. Company Overview
- 12.1.4.2. Products
- 12.1.4.3. Company Financials
- 12.1.4.4. SWOT Analysis
- 12.1.5 Bae Systems
- 12.1.5.1. Company Overview
- 12.1.5.2. Products
- 12.1.5.3. Company Financials
- 12.1.5.4. SWOT Analysis
- 12.1.6 Microchip
- 12.1.6.1. Company Overview
- 12.1.6.2. Products
- 12.1.6.3. Company Financials
- 12.1.6.4. SWOT Analysis
- 12.1.7 Lattice Semiconductor
- 12.1.7.1. Company Overview
- 12.1.7.2. Products
- 12.1.7.3. Company Financials
- 12.1.7.4. SWOT Analysis
- 12.1.8 CAES
- 12.1.8.1. Company Overview
- 12.1.8.2. Products
- 12.1.8.3. Company Financials
- 12.1.8.4. SWOT Analysis
- 12.1.9 Intersil Corporation
- 12.1.9.1. Company Overview
- 12.1.9.2. Products
- 12.1.9.3. Company Financials
- 12.1.9.4. SWOT Analysis
- 12.1.10 EPC Space
- 12.1.10.1. Company Overview
- 12.1.10.2. Products
- 12.1.10.3. Company Financials
- 12.1.10.4. SWOT Analysis
- 12.1.11 Аtmеl
- 12.1.11.1. Company Overview
- 12.1.11.2. Products
- 12.1.11.3. Company Financials
- 12.1.11.4. SWOT Analysis
- 12.1.1 STMicroelectronics
- 12.2. Market Entropy
- 12.2.1 Company's Key Areas Served
- 12.2.2 Recent Developments
- 12.3. Company Market Share Analysis 2025
- 12.3.1 Top 5 Companies Market Share Analysis
- 12.3.2 Top 3 Companies Market Share Analysis
- 12.4. List of Potential Customers
- 13. Research Methodology
List of Figures
- Figure 1: Global LEO Radiation Resistant IC Revenue Breakdown (undefined, %) by Region 2025 & 2033
- Figure 2: Global LEO Radiation Resistant IC Volume Breakdown (K, %) by Region 2025 & 2033
- Figure 3: North America LEO Radiation Resistant IC Revenue (undefined), by Application 2025 & 2033
- Figure 4: North America LEO Radiation Resistant IC Volume (K), by Application 2025 & 2033
- Figure 5: North America LEO Radiation Resistant IC Revenue Share (%), by Application 2025 & 2033
- Figure 6: North America LEO Radiation Resistant IC Volume Share (%), by Application 2025 & 2033
- Figure 7: North America LEO Radiation Resistant IC Revenue (undefined), by Types 2025 & 2033
- Figure 8: North America LEO Radiation Resistant IC Volume (K), by Types 2025 & 2033
- Figure 9: North America LEO Radiation Resistant IC Revenue Share (%), by Types 2025 & 2033
- Figure 10: North America LEO Radiation Resistant IC Volume Share (%), by Types 2025 & 2033
- Figure 11: North America LEO Radiation Resistant IC Revenue (undefined), by Country 2025 & 2033
- Figure 12: North America LEO Radiation Resistant IC Volume (K), by Country 2025 & 2033
- Figure 13: North America LEO Radiation Resistant IC Revenue Share (%), by Country 2025 & 2033
- Figure 14: North America LEO Radiation Resistant IC Volume Share (%), by Country 2025 & 2033
- Figure 15: South America LEO Radiation Resistant IC Revenue (undefined), by Application 2025 & 2033
- Figure 16: South America LEO Radiation Resistant IC Volume (K), by Application 2025 & 2033
- Figure 17: South America LEO Radiation Resistant IC Revenue Share (%), by Application 2025 & 2033
- Figure 18: South America LEO Radiation Resistant IC Volume Share (%), by Application 2025 & 2033
- Figure 19: South America LEO Radiation Resistant IC Revenue (undefined), by Types 2025 & 2033
- Figure 20: South America LEO Radiation Resistant IC Volume (K), by Types 2025 & 2033
- Figure 21: South America LEO Radiation Resistant IC Revenue Share (%), by Types 2025 & 2033
- Figure 22: South America LEO Radiation Resistant IC Volume Share (%), by Types 2025 & 2033
- Figure 23: South America LEO Radiation Resistant IC Revenue (undefined), by Country 2025 & 2033
- Figure 24: South America LEO Radiation Resistant IC Volume (K), by Country 2025 & 2033
- Figure 25: South America LEO Radiation Resistant IC Revenue Share (%), by Country 2025 & 2033
- Figure 26: South America LEO Radiation Resistant IC Volume Share (%), by Country 2025 & 2033
- Figure 27: Europe LEO Radiation Resistant IC Revenue (undefined), by Application 2025 & 2033
- Figure 28: Europe LEO Radiation Resistant IC Volume (K), by Application 2025 & 2033
- Figure 29: Europe LEO Radiation Resistant IC Revenue Share (%), by Application 2025 & 2033
- Figure 30: Europe LEO Radiation Resistant IC Volume Share (%), by Application 2025 & 2033
- Figure 31: Europe LEO Radiation Resistant IC Revenue (undefined), by Types 2025 & 2033
- Figure 32: Europe LEO Radiation Resistant IC Volume (K), by Types 2025 & 2033
- Figure 33: Europe LEO Radiation Resistant IC Revenue Share (%), by Types 2025 & 2033
- Figure 34: Europe LEO Radiation Resistant IC Volume Share (%), by Types 2025 & 2033
- Figure 35: Europe LEO Radiation Resistant IC Revenue (undefined), by Country 2025 & 2033
- Figure 36: Europe LEO Radiation Resistant IC Volume (K), by Country 2025 & 2033
- Figure 37: Europe LEO Radiation Resistant IC Revenue Share (%), by Country 2025 & 2033
- Figure 38: Europe LEO Radiation Resistant IC Volume Share (%), by Country 2025 & 2033
- Figure 39: Middle East & Africa LEO Radiation Resistant IC Revenue (undefined), by Application 2025 & 2033
- Figure 40: Middle East & Africa LEO Radiation Resistant IC Volume (K), by Application 2025 & 2033
- Figure 41: Middle East & Africa LEO Radiation Resistant IC Revenue Share (%), by Application 2025 & 2033
- Figure 42: Middle East & Africa LEO Radiation Resistant IC Volume Share (%), by Application 2025 & 2033
- Figure 43: Middle East & Africa LEO Radiation Resistant IC Revenue (undefined), by Types 2025 & 2033
- Figure 44: Middle East & Africa LEO Radiation Resistant IC Volume (K), by Types 2025 & 2033
- Figure 45: Middle East & Africa LEO Radiation Resistant IC Revenue Share (%), by Types 2025 & 2033
- Figure 46: Middle East & Africa LEO Radiation Resistant IC Volume Share (%), by Types 2025 & 2033
- Figure 47: Middle East & Africa LEO Radiation Resistant IC Revenue (undefined), by Country 2025 & 2033
- Figure 48: Middle East & Africa LEO Radiation Resistant IC Volume (K), by Country 2025 & 2033
- Figure 49: Middle East & Africa LEO Radiation Resistant IC Revenue Share (%), by Country 2025 & 2033
- Figure 50: Middle East & Africa LEO Radiation Resistant IC Volume Share (%), by Country 2025 & 2033
- Figure 51: Asia Pacific LEO Radiation Resistant IC Revenue (undefined), by Application 2025 & 2033
- Figure 52: Asia Pacific LEO Radiation Resistant IC Volume (K), by Application 2025 & 2033
- Figure 53: Asia Pacific LEO Radiation Resistant IC Revenue Share (%), by Application 2025 & 2033
- Figure 54: Asia Pacific LEO Radiation Resistant IC Volume Share (%), by Application 2025 & 2033
- Figure 55: Asia Pacific LEO Radiation Resistant IC Revenue (undefined), by Types 2025 & 2033
- Figure 56: Asia Pacific LEO Radiation Resistant IC Volume (K), by Types 2025 & 2033
- Figure 57: Asia Pacific LEO Radiation Resistant IC Revenue Share (%), by Types 2025 & 2033
- Figure 58: Asia Pacific LEO Radiation Resistant IC Volume Share (%), by Types 2025 & 2033
- Figure 59: Asia Pacific LEO Radiation Resistant IC Revenue (undefined), by Country 2025 & 2033
- Figure 60: Asia Pacific LEO Radiation Resistant IC Volume (K), by Country 2025 & 2033
- Figure 61: Asia Pacific LEO Radiation Resistant IC Revenue Share (%), by Country 2025 & 2033
- Figure 62: Asia Pacific LEO Radiation Resistant IC Volume Share (%), by Country 2025 & 2033
List of Tables
- Table 1: Global LEO Radiation Resistant IC Revenue undefined Forecast, by Application 2020 & 2033
- Table 2: Global LEO Radiation Resistant IC Volume K Forecast, by Application 2020 & 2033
- Table 3: Global LEO Radiation Resistant IC Revenue undefined Forecast, by Types 2020 & 2033
- Table 4: Global LEO Radiation Resistant IC Volume K Forecast, by Types 2020 & 2033
- Table 5: Global LEO Radiation Resistant IC Revenue undefined Forecast, by Region 2020 & 2033
- Table 6: Global LEO Radiation Resistant IC Volume K Forecast, by Region 2020 & 2033
- Table 7: Global LEO Radiation Resistant IC Revenue undefined Forecast, by Application 2020 & 2033
- Table 8: Global LEO Radiation Resistant IC Volume K Forecast, by Application 2020 & 2033
- Table 9: Global LEO Radiation Resistant IC Revenue undefined Forecast, by Types 2020 & 2033
- Table 10: Global LEO Radiation Resistant IC Volume K Forecast, by Types 2020 & 2033
- Table 11: Global LEO Radiation Resistant IC Revenue undefined Forecast, by Country 2020 & 2033
- Table 12: Global LEO Radiation Resistant IC Volume K Forecast, by Country 2020 & 2033
- Table 13: United States LEO Radiation Resistant IC Revenue (undefined) Forecast, by Application 2020 & 2033
- Table 14: United States LEO Radiation Resistant IC Volume (K) Forecast, by Application 2020 & 2033
- Table 15: Canada LEO Radiation Resistant IC Revenue (undefined) Forecast, by Application 2020 & 2033
- Table 16: Canada LEO Radiation Resistant IC Volume (K) Forecast, by Application 2020 & 2033
- Table 17: Mexico LEO Radiation Resistant IC Revenue (undefined) Forecast, by Application 2020 & 2033
- Table 18: Mexico LEO Radiation Resistant IC Volume (K) Forecast, by Application 2020 & 2033
- Table 19: Global LEO Radiation Resistant IC Revenue undefined Forecast, by Application 2020 & 2033
- Table 20: Global LEO Radiation Resistant IC Volume K Forecast, by Application 2020 & 2033
- Table 21: Global LEO Radiation Resistant IC Revenue undefined Forecast, by Types 2020 & 2033
- Table 22: Global LEO Radiation Resistant IC Volume K Forecast, by Types 2020 & 2033
- Table 23: Global LEO Radiation Resistant IC Revenue undefined Forecast, by Country 2020 & 2033
- Table 24: Global LEO Radiation Resistant IC Volume K Forecast, by Country 2020 & 2033
- Table 25: Brazil LEO Radiation Resistant IC Revenue (undefined) Forecast, by Application 2020 & 2033
- Table 26: Brazil LEO Radiation Resistant IC Volume (K) Forecast, by Application 2020 & 2033
- Table 27: Argentina LEO Radiation Resistant IC Revenue (undefined) Forecast, by Application 2020 & 2033
- Table 28: Argentina LEO Radiation Resistant IC Volume (K) Forecast, by Application 2020 & 2033
- Table 29: Rest of South America LEO Radiation Resistant IC Revenue (undefined) Forecast, by Application 2020 & 2033
- Table 30: Rest of South America LEO Radiation Resistant IC Volume (K) Forecast, by Application 2020 & 2033
- Table 31: Global LEO Radiation Resistant IC Revenue undefined Forecast, by Application 2020 & 2033
- Table 32: Global LEO Radiation Resistant IC Volume K Forecast, by Application 2020 & 2033
- Table 33: Global LEO Radiation Resistant IC Revenue undefined Forecast, by Types 2020 & 2033
- Table 34: Global LEO Radiation Resistant IC Volume K Forecast, by Types 2020 & 2033
- Table 35: Global LEO Radiation Resistant IC Revenue undefined Forecast, by Country 2020 & 2033
- Table 36: Global LEO Radiation Resistant IC Volume K Forecast, by Country 2020 & 2033
- Table 37: United Kingdom LEO Radiation Resistant IC Revenue (undefined) Forecast, by Application 2020 & 2033
- Table 38: United Kingdom LEO Radiation Resistant IC Volume (K) Forecast, by Application 2020 & 2033
- Table 39: Germany LEO Radiation Resistant IC Revenue (undefined) Forecast, by Application 2020 & 2033
- Table 40: Germany LEO Radiation Resistant IC Volume (K) Forecast, by Application 2020 & 2033
- Table 41: France LEO Radiation Resistant IC Revenue (undefined) Forecast, by Application 2020 & 2033
- Table 42: France LEO Radiation Resistant IC Volume (K) Forecast, by Application 2020 & 2033
- Table 43: Italy LEO Radiation Resistant IC Revenue (undefined) Forecast, by Application 2020 & 2033
- Table 44: Italy LEO Radiation Resistant IC Volume (K) Forecast, by Application 2020 & 2033
- Table 45: Spain LEO Radiation Resistant IC Revenue (undefined) Forecast, by Application 2020 & 2033
- Table 46: Spain LEO Radiation Resistant IC Volume (K) Forecast, by Application 2020 & 2033
- Table 47: Russia LEO Radiation Resistant IC Revenue (undefined) Forecast, by Application 2020 & 2033
- Table 48: Russia LEO Radiation Resistant IC Volume (K) Forecast, by Application 2020 & 2033
- Table 49: Benelux LEO Radiation Resistant IC Revenue (undefined) Forecast, by Application 2020 & 2033
- Table 50: Benelux LEO Radiation Resistant IC Volume (K) Forecast, by Application 2020 & 2033
- Table 51: Nordics LEO Radiation Resistant IC Revenue (undefined) Forecast, by Application 2020 & 2033
- Table 52: Nordics LEO Radiation Resistant IC Volume (K) Forecast, by Application 2020 & 2033
- Table 53: Rest of Europe LEO Radiation Resistant IC Revenue (undefined) Forecast, by Application 2020 & 2033
- Table 54: Rest of Europe LEO Radiation Resistant IC Volume (K) Forecast, by Application 2020 & 2033
- Table 55: Global LEO Radiation Resistant IC Revenue undefined Forecast, by Application 2020 & 2033
- Table 56: Global LEO Radiation Resistant IC Volume K Forecast, by Application 2020 & 2033
- Table 57: Global LEO Radiation Resistant IC Revenue undefined Forecast, by Types 2020 & 2033
- Table 58: Global LEO Radiation Resistant IC Volume K Forecast, by Types 2020 & 2033
- Table 59: Global LEO Radiation Resistant IC Revenue undefined Forecast, by Country 2020 & 2033
- Table 60: Global LEO Radiation Resistant IC Volume K Forecast, by Country 2020 & 2033
- Table 61: Turkey LEO Radiation Resistant IC Revenue (undefined) Forecast, by Application 2020 & 2033
- Table 62: Turkey LEO Radiation Resistant IC Volume (K) Forecast, by Application 2020 & 2033
- Table 63: Israel LEO Radiation Resistant IC Revenue (undefined) Forecast, by Application 2020 & 2033
- Table 64: Israel LEO Radiation Resistant IC Volume (K) Forecast, by Application 2020 & 2033
- Table 65: GCC LEO Radiation Resistant IC Revenue (undefined) Forecast, by Application 2020 & 2033
- Table 66: GCC LEO Radiation Resistant IC Volume (K) Forecast, by Application 2020 & 2033
- Table 67: North Africa LEO Radiation Resistant IC Revenue (undefined) Forecast, by Application 2020 & 2033
- Table 68: North Africa LEO Radiation Resistant IC Volume (K) Forecast, by Application 2020 & 2033
- Table 69: South Africa LEO Radiation Resistant IC Revenue (undefined) Forecast, by Application 2020 & 2033
- Table 70: South Africa LEO Radiation Resistant IC Volume (K) Forecast, by Application 2020 & 2033
- Table 71: Rest of Middle East & Africa LEO Radiation Resistant IC Revenue (undefined) Forecast, by Application 2020 & 2033
- Table 72: Rest of Middle East & Africa LEO Radiation Resistant IC Volume (K) Forecast, by Application 2020 & 2033
- Table 73: Global LEO Radiation Resistant IC Revenue undefined Forecast, by Application 2020 & 2033
- Table 74: Global LEO Radiation Resistant IC Volume K Forecast, by Application 2020 & 2033
- Table 75: Global LEO Radiation Resistant IC Revenue undefined Forecast, by Types 2020 & 2033
- Table 76: Global LEO Radiation Resistant IC Volume K Forecast, by Types 2020 & 2033
- Table 77: Global LEO Radiation Resistant IC Revenue undefined Forecast, by Country 2020 & 2033
- Table 78: Global LEO Radiation Resistant IC Volume K Forecast, by Country 2020 & 2033
- Table 79: China LEO Radiation Resistant IC Revenue (undefined) Forecast, by Application 2020 & 2033
- Table 80: China LEO Radiation Resistant IC Volume (K) Forecast, by Application 2020 & 2033
- Table 81: India LEO Radiation Resistant IC Revenue (undefined) Forecast, by Application 2020 & 2033
- Table 82: India LEO Radiation Resistant IC Volume (K) Forecast, by Application 2020 & 2033
- Table 83: Japan LEO Radiation Resistant IC Revenue (undefined) Forecast, by Application 2020 & 2033
- Table 84: Japan LEO Radiation Resistant IC Volume (K) Forecast, by Application 2020 & 2033
- Table 85: South Korea LEO Radiation Resistant IC Revenue (undefined) Forecast, by Application 2020 & 2033
- Table 86: South Korea LEO Radiation Resistant IC Volume (K) Forecast, by Application 2020 & 2033
- Table 87: ASEAN LEO Radiation Resistant IC Revenue (undefined) Forecast, by Application 2020 & 2033
- Table 88: ASEAN LEO Radiation Resistant IC Volume (K) Forecast, by Application 2020 & 2033
- Table 89: Oceania LEO Radiation Resistant IC Revenue (undefined) Forecast, by Application 2020 & 2033
- Table 90: Oceania LEO Radiation Resistant IC Volume (K) Forecast, by Application 2020 & 2033
- Table 91: Rest of Asia Pacific LEO Radiation Resistant IC Revenue (undefined) Forecast, by Application 2020 & 2033
- Table 92: Rest of Asia Pacific LEO Radiation Resistant IC Volume (K) Forecast, by Application 2020 & 2033
Frequently Asked Questions
1. What is the projected Compound Annual Growth Rate (CAGR) of the LEO Radiation Resistant IC?
The projected CAGR is approximately 5.4%.
2. Which companies are prominent players in the LEO Radiation Resistant IC?
Key companies in the market include STMicroelectronics, Renesas, Texas Instruments, Xilinx, Bae Systems, Microchip, Lattice Semiconductor, CAES, Intersil Corporation, EPC Space, Аtmеl.
3. What are the main segments of the LEO Radiation Resistant IC?
The market segments include Application, Types.
4. Can you provide details about the market size?
The market size is estimated to be USD XXX N/A as of 2022.
5. What are some drivers contributing to market growth?
N/A
6. What are the notable trends driving market growth?
N/A
7. Are there any restraints impacting market growth?
N/A
8. Can you provide examples of recent developments in the market?
N/A
9. What pricing options are available for accessing the report?
Pricing options include single-user, multi-user, and enterprise licenses priced at USD 4350.00, USD 6525.00, and USD 8700.00 respectively.
10. Is the market size provided in terms of value or volume?
The market size is provided in terms of value, measured in N/A and volume, measured in K.
11. Are there any specific market keywords associated with the report?
Yes, the market keyword associated with the report is "LEO Radiation Resistant IC," which aids in identifying and referencing the specific market segment covered.
12. How do I determine which pricing option suits my needs best?
The pricing options vary based on user requirements and access needs. Individual users may opt for single-user licenses, while businesses requiring broader access may choose multi-user or enterprise licenses for cost-effective access to the report.
13. Are there any additional resources or data provided in the LEO Radiation Resistant IC report?
While the report offers comprehensive insights, it's advisable to review the specific contents or supplementary materials provided to ascertain if additional resources or data are available.
14. How can I stay updated on further developments or reports in the LEO Radiation Resistant IC?
To stay informed about further developments, trends, and reports in the LEO Radiation Resistant IC, consider subscribing to industry newsletters, following relevant companies and organizations, or regularly checking reputable industry news sources and publications.
Methodology
Step 1 - Identification of Relevant Samples Size from Population Database


Step 2 - Approaches for Defining Global Market Size (Value, Volume* & Price*)

Note*: In applicable scenarios
Step 3 - Data Sources
Primary Research
- Web Analytics
- Survey Reports
- Research Institute
- Latest Research Reports
- Opinion Leaders
Secondary Research
- Annual Reports
- White Paper
- Latest Press Release
- Industry Association
- Paid Database
- Investor Presentations

Step 4 - Data Triangulation
Involves using different sources of information in order to increase the validity of a study
These sources are likely to be stakeholders in a program - participants, other researchers, program staff, other community members, and so on.
Then we put all data in single framework & apply various statistical tools to find out the dynamic on the market.
During the analysis stage, feedback from the stakeholder groups would be compared to determine areas of agreement as well as areas of divergence