

Key Insights
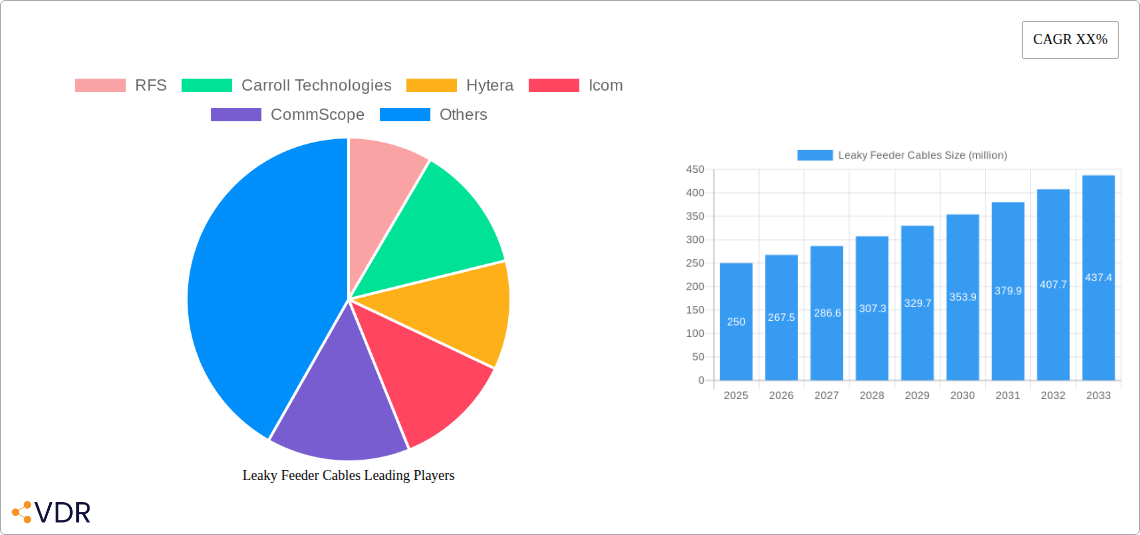
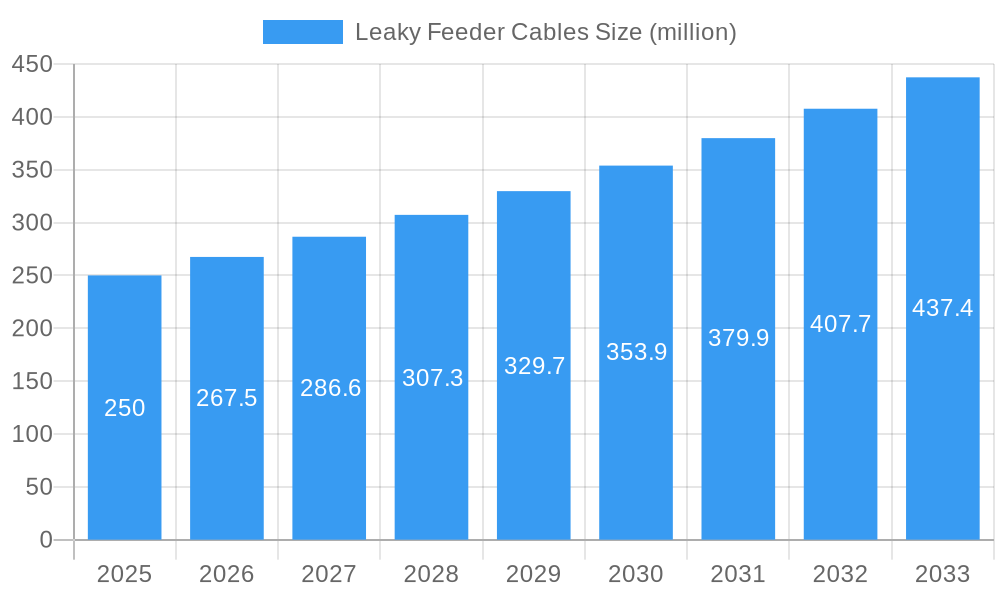
The Leaky Feeder Cable market is experiencing robust growth, driven by the expanding demand for reliable and efficient communication infrastructure in various sectors. The market's Compound Annual Growth Rate (CAGR) is estimated to be around 7% during the forecast period of 2025-2033, projecting a significant market expansion. This growth is fueled primarily by the increasing adoption of wireless communication technologies, particularly in remote areas and challenging terrains where traditional cabling solutions are impractical or cost-prohibitive. The rising popularity of 5G networks and the expanding private LTE/5G deployments across industries such as mining, transportation, and public safety are key factors driving the demand for leaky feeder cables. Furthermore, ongoing advancements in cable technology, resulting in improved signal quality, durability, and cost-effectiveness, are further bolstering market growth. The market is segmented by various cable types, frequency ranges, and applications, providing opportunities for specialized cable manufacturers. Key players like RFS, Carroll Technologies, and Hytera are leveraging their established market presence and technological expertise to capture substantial market share, while other players are focusing on regional expansion and strategic partnerships to increase their competitive edge.
Leaky Feeder Cables Market Size (In Million)
However, several factors constrain the market's growth. High initial investment costs associated with the deployment of leaky feeder cable systems can pose a challenge for some enterprises, particularly small and medium-sized businesses. Competition from alternative communication technologies, such as satellite communication and fiber optics, can also impact market growth. Furthermore, regulatory hurdles and standardization issues in some regions may impede market expansion. Nevertheless, the long-term prospects for leaky feeder cables remain positive, given the increasing demand for reliable communication solutions in diverse applications and the ongoing innovation in the industry. The market is projected to reach a value of approximately $350 million by 2033, reflecting the significant growth potential in this specialized cable market.
Leaky Feeder Cables Company Market Share
Leaky Feeder Cables Market Report: 2019-2033
This comprehensive report provides an in-depth analysis of the Leaky Feeder Cables market, encompassing market dynamics, growth trends, regional analysis, product landscape, and competitive insights. The report covers the period from 2019 to 2033, with a focus on the forecast period 2025-2033 and a base year of 2025. This report is crucial for industry professionals, investors, and strategists seeking a detailed understanding of this vital segment within the broader RF and Microwave Components and Telecommunications Infrastructure markets. The market is projected to reach xx million units by 2033.
Leaky Feeder Cables Market Dynamics & Structure
This section analyzes the structure and dynamics of the Leaky Feeder Cables market. We examine market concentration, revealing the leading players and their market share (e.g., RFS holding xx%, CommScope holding yy%). The report explores technological innovation drivers, including advancements in materials and manufacturing processes, influencing performance and cost-effectiveness. Regulatory frameworks impacting the industry, such as compliance standards and certifications, are also considered. The competitive landscape is assessed through an examination of product substitutes and their impact. Further, we analyze end-user demographics, identifying key application sectors and their growth trajectories. Finally, the report examines mergers and acquisitions (M&A) activity, providing quantitative data on deal volumes (xx deals in the last 5 years) and qualitative insights into their impact on market consolidation.
- Market Concentration: Highly fragmented with top 5 players holding xx% market share.
- Technological Innovation: Focus on miniaturization, improved signal quality, and enhanced durability.
- Regulatory Frameworks: Compliance with industry standards (e.g., xx) influences design and manufacturing.
- Product Substitutes: Limited substitutes exist, mainly traditional cable types.
- End-User Demographics: Primarily telecommunications infrastructure, public safety, and defense sectors.
- M&A Trends: Moderate M&A activity, driven by consolidation and technological expansion.
Leaky Feeder Cables Growth Trends & Insights
Utilizing comprehensive market research data, this section analyzes the historical and projected growth of the Leaky Feeder Cables market. It examines market size evolution, from xx million units in 2019 to xx million units in 2024. The report also details adoption rates across various segments and geographical regions. We delve into technological disruptions, identifying key innovations that have impacted market growth, and examine shifts in consumer behavior, including preference towards specific cable types based on performance attributes. Finally, the report provides key metrics, such as compound annual growth rate (CAGR) and market penetration rates, to provide comprehensive quantitative insights. The market is expected to register a CAGR of xx% during the forecast period.
- Market Size: xx million units in 2024, projected to reach xx million units in 2033.
- Adoption Rates: Increasing adoption in developing regions due to infrastructure expansion.
- Technological Disruptions: Advancements in material science driving performance improvements.
- Consumer Behavior: Demand driven by need for high-bandwidth, reliable communication systems.
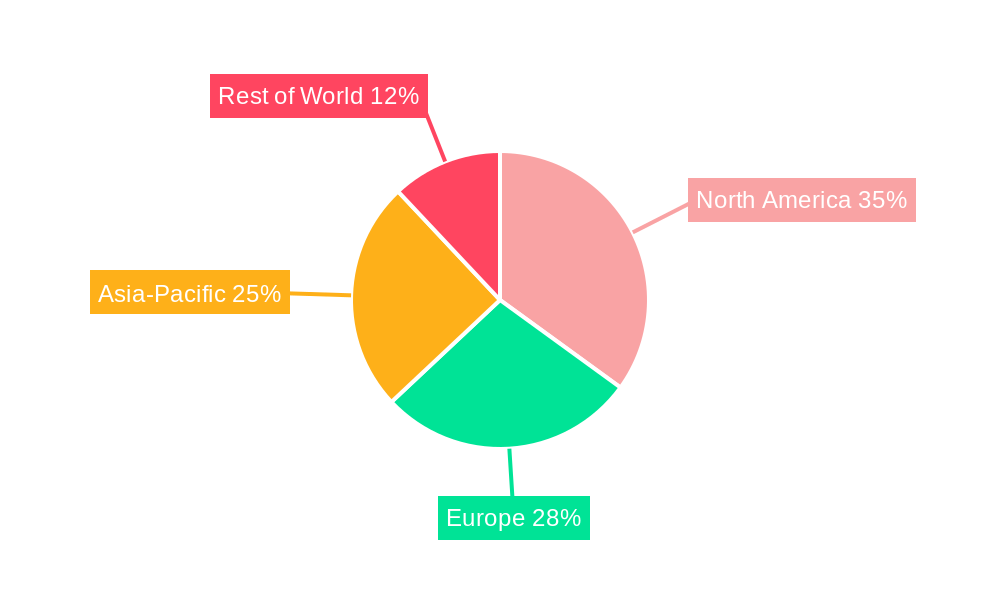
Dominant Regions, Countries, or Segments in Leaky Feeder Cables
This section identifies the leading regions, countries, and segments driving market growth. We analyze dominance factors, including market share and growth potential, providing detailed insights into regional dynamics. Key drivers, such as economic policies, infrastructure development, and government initiatives, are highlighted using bullet points. Specific countries are analyzed for their unique contributions to market growth. North America is projected to hold the largest market share, driven by robust infrastructure investments.
- North America: Largest market share due to strong demand from the telecommunications sector.
- Europe: Significant growth driven by 5G infrastructure rollouts and smart city initiatives.
- Asia-Pacific: Rapid expansion due to increasing investments in telecommunications infrastructure.
- Key Drivers: Government investments in infrastructure, growing demand for high-bandwidth networks, and technological advancements.
Leaky Feeder Cables Product Landscape
Leaky Feeder Cables offer unique functionalities for various applications. Advancements have improved signal distribution, enabling efficient coverage in challenging environments. Product innovations focus on enhancing durability, minimizing signal loss, and optimizing performance in diverse deployment scenarios. The unique selling proposition lies in their ability to provide continuous coverage, unlike discrete antenna systems. Technological advancements focus on improving materials and manufacturing processes to enhance performance and reduce costs.
Key Drivers, Barriers & Challenges in Leaky Feeder Cables
Key Drivers:
- Growing demand for high-bandwidth wireless communication.
- Expansion of telecommunications infrastructure, particularly in developing economies.
- Technological advancements leading to improved performance and cost-effectiveness.
- Increasing adoption in various applications, such as public safety and defense.
Key Challenges:
- High initial investment costs can be a barrier to entry for smaller companies.
- Stringent regulatory standards require significant compliance efforts.
- Intense competition from established players poses a challenge for new entrants.
- Supply chain disruptions can impact production and availability.
Emerging Opportunities in Leaky Feeder Cables
Emerging opportunities stem from the increasing demand for high-bandwidth wireless communication in various sectors. Untapped markets in developing regions present significant growth potential. Innovative applications, such as smart city infrastructure and industrial automation, offer new avenues for market expansion. Evolving consumer preferences towards reliable and efficient communication systems are fueling demand.
Growth Accelerators in the Leaky Feeder Cables Industry
Long-term growth is fueled by ongoing technological breakthroughs, such as advancements in materials and design. Strategic partnerships between manufacturers and network operators will accelerate market penetration. Market expansion strategies, including geographical diversification and entry into new application sectors, will drive growth. Continued investments in R&D will lead to innovative products that meet evolving market needs.
Notable Milestones in Leaky Feeder Cables Sector
- 2020-Q4: RFS launched a new generation of low-loss leaky feeder cables.
- 2021-Q2: CommScope acquired a smaller competitor, expanding its market share.
- 2022-Q3: Significant investment in R&D resulted in improved cable durability.
- 2023-Q1: New industry standards for leaky feeder cables were introduced. (Specific details on standards would be included in the full report).
In-Depth Leaky Feeder Cables Market Outlook
The Leaky Feeder Cables market is poised for sustained growth driven by the continued expansion of wireless communication networks and the increasing adoption of high-bandwidth technologies. Strategic opportunities for companies lie in focusing on innovation, strategic partnerships, and expansion into new applications. The market's long-term potential is significant, presenting attractive opportunities for players who can adapt to evolving technological trends and meet the increasing demand for reliable and high-performance communication solutions.
Leaky Feeder Cables Segmentation
-
1. Application
- 1.1. Tunnel
- 1.2. Mine
- 1.3. Others
-
2. Types
- 2.1. Figure 8 Slot
- 2.2. Straight Slot
- 2.3. U-Shaped Slot
Leaky Feeder Cables Segmentation By Geography
-
1. North America
- 1.1. United States
- 1.2. Canada
- 1.3. Mexico
-
2. South America
- 2.1. Brazil
- 2.2. Argentina
- 2.3. Rest of South America
-
3. Europe
- 3.1. United Kingdom
- 3.2. Germany
- 3.3. France
- 3.4. Italy
- 3.5. Spain
- 3.6. Russia
- 3.7. Benelux
- 3.8. Nordics
- 3.9. Rest of Europe
-
4. Middle East & Africa
- 4.1. Turkey
- 4.2. Israel
- 4.3. GCC
- 4.4. North Africa
- 4.5. South Africa
- 4.6. Rest of Middle East & Africa
-
5. Asia Pacific
- 5.1. China
- 5.2. India
- 5.3. Japan
- 5.4. South Korea
- 5.5. ASEAN
- 5.6. Oceania
- 5.7. Rest of Asia Pacific
Leaky Feeder Cables Regional Market Share
Geographic Coverage of Leaky Feeder Cables
Leaky Feeder Cables REPORT HIGHLIGHTS
| Aspects | Details |
|---|---|
| Study Period | 2020-2034 |
| Base Year | 2025 |
| Estimated Year | 2026 |
| Forecast Period | 2026-2034 |
| Historical Period | 2020-2025 |
| Growth Rate | CAGR of 5% from 2020-2034 |
| Segmentation |
|
Table of Contents
- 1. Introduction
- 1.1. Research Scope
- 1.2. Market Segmentation
- 1.3. Research Objective
- 1.4. Definitions and Assumptions
- 2. Executive Summary
- 2.1. Market Snapshot
- 3. Market Dynamics
- 3.1. Market Drivers
- 3.2. Market Restrains
- 3.3. Market Trends
- 3.4. Market Opportunities
- 4. Market Factor Analysis
- 4.1. Porters Five Forces
- 4.1.1. Bargaining Power of Suppliers
- 4.1.2. Bargaining Power of Buyers
- 4.1.3. Threat of New Entrants
- 4.1.4. Threat of Substitutes
- 4.1.5. Competitive Rivalry
- 4.2. PESTEL analysis
- 4.3. BCG Analysis
- 4.3.1. Stars (High Growth, High Market Share)
- 4.3.2. Cash Cows (Low Growth, High Market Share)
- 4.3.3. Question Mark (High Growth, Low Market Share)
- 4.3.4. Dogs (Low Growth, Low Market Share)
- 4.4. Ansoff Matrix Analysis
- 4.5. Supply Chain Analysis
- 4.6. Regulatory Landscape
- 4.7. Current Market Potential and Opportunity Assessment (TAM–SAM–SOM Framework)
- 4.8. VDR Analyst Note
- 4.1. Porters Five Forces
- 5. Market Analysis, Insights and Forecast 2021-2033
- 5.1. Market Analysis, Insights and Forecast - by Application
- 5.1.1. Tunnel
- 5.1.2. Mine
- 5.1.3. Others
- 5.2. Market Analysis, Insights and Forecast - by Types
- 5.2.1. Figure 8 Slot
- 5.2.2. Straight Slot
- 5.2.3. U-Shaped Slot
- 5.3. Market Analysis, Insights and Forecast - by Region
- 5.3.1. North America
- 5.3.2. South America
- 5.3.3. Europe
- 5.3.4. Middle East & Africa
- 5.3.5. Asia Pacific
- 5.1. Market Analysis, Insights and Forecast - by Application
- 6. Global Leaky Feeder Cables Analysis, Insights and Forecast, 2021-2033
- 6.1. Market Analysis, Insights and Forecast - by Application
- 6.1.1. Tunnel
- 6.1.2. Mine
- 6.1.3. Others
- 6.2. Market Analysis, Insights and Forecast - by Types
- 6.2.1. Figure 8 Slot
- 6.2.2. Straight Slot
- 6.2.3. U-Shaped Slot
- 6.1. Market Analysis, Insights and Forecast - by Application
- 7. North America Leaky Feeder Cables Analysis, Insights and Forecast, 2021-2033
- 7.1. Market Analysis, Insights and Forecast - by Application
- 7.1.1. Tunnel
- 7.1.2. Mine
- 7.1.3. Others
- 7.2. Market Analysis, Insights and Forecast - by Types
- 7.2.1. Figure 8 Slot
- 7.2.2. Straight Slot
- 7.2.3. U-Shaped Slot
- 7.1. Market Analysis, Insights and Forecast - by Application
- 8. South America Leaky Feeder Cables Analysis, Insights and Forecast, 2021-2033
- 8.1. Market Analysis, Insights and Forecast - by Application
- 8.1.1. Tunnel
- 8.1.2. Mine
- 8.1.3. Others
- 8.2. Market Analysis, Insights and Forecast - by Types
- 8.2.1. Figure 8 Slot
- 8.2.2. Straight Slot
- 8.2.3. U-Shaped Slot
- 8.1. Market Analysis, Insights and Forecast - by Application
- 9. Europe Leaky Feeder Cables Analysis, Insights and Forecast, 2021-2033
- 9.1. Market Analysis, Insights and Forecast - by Application
- 9.1.1. Tunnel
- 9.1.2. Mine
- 9.1.3. Others
- 9.2. Market Analysis, Insights and Forecast - by Types
- 9.2.1. Figure 8 Slot
- 9.2.2. Straight Slot
- 9.2.3. U-Shaped Slot
- 9.1. Market Analysis, Insights and Forecast - by Application
- 10. Middle East & Africa Leaky Feeder Cables Analysis, Insights and Forecast, 2021-2033
- 10.1. Market Analysis, Insights and Forecast - by Application
- 10.1.1. Tunnel
- 10.1.2. Mine
- 10.1.3. Others
- 10.2. Market Analysis, Insights and Forecast - by Types
- 10.2.1. Figure 8 Slot
- 10.2.2. Straight Slot
- 10.2.3. U-Shaped Slot
- 10.1. Market Analysis, Insights and Forecast - by Application
- 11. Asia Pacific Leaky Feeder Cables Analysis, Insights and Forecast, 2021-2033
- 11.1. Market Analysis, Insights and Forecast - by Application
- 11.1.1. Tunnel
- 11.1.2. Mine
- 11.1.3. Others
- 11.2. Market Analysis, Insights and Forecast - by Types
- 11.2.1. Figure 8 Slot
- 11.2.2. Straight Slot
- 11.2.3. U-Shaped Slot
- 11.1. Market Analysis, Insights and Forecast - by Application
- 12. Competitive Analysis
- 12.1. Company Profiles
- 12.1.1 RFS
- 12.1.1.1. Company Overview
- 12.1.1.2. Products
- 12.1.1.3. Company Financials
- 12.1.1.4. SWOT Analysis
- 12.1.2 Carroll Technologies
- 12.1.2.1. Company Overview
- 12.1.2.2. Products
- 12.1.2.3. Company Financials
- 12.1.2.4. SWOT Analysis
- 12.1.3 Hytera
- 12.1.3.1. Company Overview
- 12.1.3.2. Products
- 12.1.3.3. Company Financials
- 12.1.3.4. SWOT Analysis
- 12.1.4 Icom
- 12.1.4.1. Company Overview
- 12.1.4.2. Products
- 12.1.4.3. Company Financials
- 12.1.4.4. SWOT Analysis
- 12.1.5 CommScope
- 12.1.5.1. Company Overview
- 12.1.5.2. Products
- 12.1.5.3. Company Financials
- 12.1.5.4. SWOT Analysis
- 12.1.6 Times Microwave Systems
- 12.1.6.1. Company Overview
- 12.1.6.2. Products
- 12.1.6.3. Company Financials
- 12.1.6.4. SWOT Analysis
- 12.1.7 Shenzhen Lianstar Technology
- 12.1.7.1. Company Overview
- 12.1.7.2. Products
- 12.1.7.3. Company Financials
- 12.1.7.4. SWOT Analysis
- 12.1.8 Kanhha Cables
- 12.1.8.1. Company Overview
- 12.1.8.2. Products
- 12.1.8.3. Company Financials
- 12.1.8.4. SWOT Analysis
- 12.1.9 Norden Communication
- 12.1.9.1. Company Overview
- 12.1.9.2. Products
- 12.1.9.3. Company Financials
- 12.1.9.4. SWOT Analysis
- 12.1.10 SRFS Teleinfra
- 12.1.10.1. Company Overview
- 12.1.10.2. Products
- 12.1.10.3. Company Financials
- 12.1.10.4. SWOT Analysis
- 12.1.1 RFS
- 12.2. Market Entropy
- 12.2.1 Company's Key Areas Served
- 12.2.2 Recent Developments
- 12.3. Company Market Share Analysis 2025
- 12.3.1 Top 5 Companies Market Share Analysis
- 12.3.2 Top 3 Companies Market Share Analysis
- 12.4. List of Potential Customers
- 13. Research Methodology
List of Figures
- Figure 1: Global Leaky Feeder Cables Revenue Breakdown (undefined, %) by Region 2025 & 2033
- Figure 2: Global Leaky Feeder Cables Volume Breakdown (K, %) by Region 2025 & 2033
- Figure 3: North America Leaky Feeder Cables Revenue (undefined), by Application 2025 & 2033
- Figure 4: North America Leaky Feeder Cables Volume (K), by Application 2025 & 2033
- Figure 5: North America Leaky Feeder Cables Revenue Share (%), by Application 2025 & 2033
- Figure 6: North America Leaky Feeder Cables Volume Share (%), by Application 2025 & 2033
- Figure 7: North America Leaky Feeder Cables Revenue (undefined), by Types 2025 & 2033
- Figure 8: North America Leaky Feeder Cables Volume (K), by Types 2025 & 2033
- Figure 9: North America Leaky Feeder Cables Revenue Share (%), by Types 2025 & 2033
- Figure 10: North America Leaky Feeder Cables Volume Share (%), by Types 2025 & 2033
- Figure 11: North America Leaky Feeder Cables Revenue (undefined), by Country 2025 & 2033
- Figure 12: North America Leaky Feeder Cables Volume (K), by Country 2025 & 2033
- Figure 13: North America Leaky Feeder Cables Revenue Share (%), by Country 2025 & 2033
- Figure 14: North America Leaky Feeder Cables Volume Share (%), by Country 2025 & 2033
- Figure 15: South America Leaky Feeder Cables Revenue (undefined), by Application 2025 & 2033
- Figure 16: South America Leaky Feeder Cables Volume (K), by Application 2025 & 2033
- Figure 17: South America Leaky Feeder Cables Revenue Share (%), by Application 2025 & 2033
- Figure 18: South America Leaky Feeder Cables Volume Share (%), by Application 2025 & 2033
- Figure 19: South America Leaky Feeder Cables Revenue (undefined), by Types 2025 & 2033
- Figure 20: South America Leaky Feeder Cables Volume (K), by Types 2025 & 2033
- Figure 21: South America Leaky Feeder Cables Revenue Share (%), by Types 2025 & 2033
- Figure 22: South America Leaky Feeder Cables Volume Share (%), by Types 2025 & 2033
- Figure 23: South America Leaky Feeder Cables Revenue (undefined), by Country 2025 & 2033
- Figure 24: South America Leaky Feeder Cables Volume (K), by Country 2025 & 2033
- Figure 25: South America Leaky Feeder Cables Revenue Share (%), by Country 2025 & 2033
- Figure 26: South America Leaky Feeder Cables Volume Share (%), by Country 2025 & 2033
- Figure 27: Europe Leaky Feeder Cables Revenue (undefined), by Application 2025 & 2033
- Figure 28: Europe Leaky Feeder Cables Volume (K), by Application 2025 & 2033
- Figure 29: Europe Leaky Feeder Cables Revenue Share (%), by Application 2025 & 2033
- Figure 30: Europe Leaky Feeder Cables Volume Share (%), by Application 2025 & 2033
- Figure 31: Europe Leaky Feeder Cables Revenue (undefined), by Types 2025 & 2033
- Figure 32: Europe Leaky Feeder Cables Volume (K), by Types 2025 & 2033
- Figure 33: Europe Leaky Feeder Cables Revenue Share (%), by Types 2025 & 2033
- Figure 34: Europe Leaky Feeder Cables Volume Share (%), by Types 2025 & 2033
- Figure 35: Europe Leaky Feeder Cables Revenue (undefined), by Country 2025 & 2033
- Figure 36: Europe Leaky Feeder Cables Volume (K), by Country 2025 & 2033
- Figure 37: Europe Leaky Feeder Cables Revenue Share (%), by Country 2025 & 2033
- Figure 38: Europe Leaky Feeder Cables Volume Share (%), by Country 2025 & 2033
- Figure 39: Middle East & Africa Leaky Feeder Cables Revenue (undefined), by Application 2025 & 2033
- Figure 40: Middle East & Africa Leaky Feeder Cables Volume (K), by Application 2025 & 2033
- Figure 41: Middle East & Africa Leaky Feeder Cables Revenue Share (%), by Application 2025 & 2033
- Figure 42: Middle East & Africa Leaky Feeder Cables Volume Share (%), by Application 2025 & 2033
- Figure 43: Middle East & Africa Leaky Feeder Cables Revenue (undefined), by Types 2025 & 2033
- Figure 44: Middle East & Africa Leaky Feeder Cables Volume (K), by Types 2025 & 2033
- Figure 45: Middle East & Africa Leaky Feeder Cables Revenue Share (%), by Types 2025 & 2033
- Figure 46: Middle East & Africa Leaky Feeder Cables Volume Share (%), by Types 2025 & 2033
- Figure 47: Middle East & Africa Leaky Feeder Cables Revenue (undefined), by Country 2025 & 2033
- Figure 48: Middle East & Africa Leaky Feeder Cables Volume (K), by Country 2025 & 2033
- Figure 49: Middle East & Africa Leaky Feeder Cables Revenue Share (%), by Country 2025 & 2033
- Figure 50: Middle East & Africa Leaky Feeder Cables Volume Share (%), by Country 2025 & 2033
- Figure 51: Asia Pacific Leaky Feeder Cables Revenue (undefined), by Application 2025 & 2033
- Figure 52: Asia Pacific Leaky Feeder Cables Volume (K), by Application 2025 & 2033
- Figure 53: Asia Pacific Leaky Feeder Cables Revenue Share (%), by Application 2025 & 2033
- Figure 54: Asia Pacific Leaky Feeder Cables Volume Share (%), by Application 2025 & 2033
- Figure 55: Asia Pacific Leaky Feeder Cables Revenue (undefined), by Types 2025 & 2033
- Figure 56: Asia Pacific Leaky Feeder Cables Volume (K), by Types 2025 & 2033
- Figure 57: Asia Pacific Leaky Feeder Cables Revenue Share (%), by Types 2025 & 2033
- Figure 58: Asia Pacific Leaky Feeder Cables Volume Share (%), by Types 2025 & 2033
- Figure 59: Asia Pacific Leaky Feeder Cables Revenue (undefined), by Country 2025 & 2033
- Figure 60: Asia Pacific Leaky Feeder Cables Volume (K), by Country 2025 & 2033
- Figure 61: Asia Pacific Leaky Feeder Cables Revenue Share (%), by Country 2025 & 2033
- Figure 62: Asia Pacific Leaky Feeder Cables Volume Share (%), by Country 2025 & 2033
List of Tables
- Table 1: Global Leaky Feeder Cables Revenue undefined Forecast, by Application 2020 & 2033
- Table 2: Global Leaky Feeder Cables Volume K Forecast, by Application 2020 & 2033
- Table 3: Global Leaky Feeder Cables Revenue undefined Forecast, by Types 2020 & 2033
- Table 4: Global Leaky Feeder Cables Volume K Forecast, by Types 2020 & 2033
- Table 5: Global Leaky Feeder Cables Revenue undefined Forecast, by Region 2020 & 2033
- Table 6: Global Leaky Feeder Cables Volume K Forecast, by Region 2020 & 2033
- Table 7: Global Leaky Feeder Cables Revenue undefined Forecast, by Application 2020 & 2033
- Table 8: Global Leaky Feeder Cables Volume K Forecast, by Application 2020 & 2033
- Table 9: Global Leaky Feeder Cables Revenue undefined Forecast, by Types 2020 & 2033
- Table 10: Global Leaky Feeder Cables Volume K Forecast, by Types 2020 & 2033
- Table 11: Global Leaky Feeder Cables Revenue undefined Forecast, by Country 2020 & 2033
- Table 12: Global Leaky Feeder Cables Volume K Forecast, by Country 2020 & 2033
- Table 13: United States Leaky Feeder Cables Revenue (undefined) Forecast, by Application 2020 & 2033
- Table 14: United States Leaky Feeder Cables Volume (K) Forecast, by Application 2020 & 2033
- Table 15: Canada Leaky Feeder Cables Revenue (undefined) Forecast, by Application 2020 & 2033
- Table 16: Canada Leaky Feeder Cables Volume (K) Forecast, by Application 2020 & 2033
- Table 17: Mexico Leaky Feeder Cables Revenue (undefined) Forecast, by Application 2020 & 2033
- Table 18: Mexico Leaky Feeder Cables Volume (K) Forecast, by Application 2020 & 2033
- Table 19: Global Leaky Feeder Cables Revenue undefined Forecast, by Application 2020 & 2033
- Table 20: Global Leaky Feeder Cables Volume K Forecast, by Application 2020 & 2033
- Table 21: Global Leaky Feeder Cables Revenue undefined Forecast, by Types 2020 & 2033
- Table 22: Global Leaky Feeder Cables Volume K Forecast, by Types 2020 & 2033
- Table 23: Global Leaky Feeder Cables Revenue undefined Forecast, by Country 2020 & 2033
- Table 24: Global Leaky Feeder Cables Volume K Forecast, by Country 2020 & 2033
- Table 25: Brazil Leaky Feeder Cables Revenue (undefined) Forecast, by Application 2020 & 2033
- Table 26: Brazil Leaky Feeder Cables Volume (K) Forecast, by Application 2020 & 2033
- Table 27: Argentina Leaky Feeder Cables Revenue (undefined) Forecast, by Application 2020 & 2033
- Table 28: Argentina Leaky Feeder Cables Volume (K) Forecast, by Application 2020 & 2033
- Table 29: Rest of South America Leaky Feeder Cables Revenue (undefined) Forecast, by Application 2020 & 2033
- Table 30: Rest of South America Leaky Feeder Cables Volume (K) Forecast, by Application 2020 & 2033
- Table 31: Global Leaky Feeder Cables Revenue undefined Forecast, by Application 2020 & 2033
- Table 32: Global Leaky Feeder Cables Volume K Forecast, by Application 2020 & 2033
- Table 33: Global Leaky Feeder Cables Revenue undefined Forecast, by Types 2020 & 2033
- Table 34: Global Leaky Feeder Cables Volume K Forecast, by Types 2020 & 2033
- Table 35: Global Leaky Feeder Cables Revenue undefined Forecast, by Country 2020 & 2033
- Table 36: Global Leaky Feeder Cables Volume K Forecast, by Country 2020 & 2033
- Table 37: United Kingdom Leaky Feeder Cables Revenue (undefined) Forecast, by Application 2020 & 2033
- Table 38: United Kingdom Leaky Feeder Cables Volume (K) Forecast, by Application 2020 & 2033
- Table 39: Germany Leaky Feeder Cables Revenue (undefined) Forecast, by Application 2020 & 2033
- Table 40: Germany Leaky Feeder Cables Volume (K) Forecast, by Application 2020 & 2033
- Table 41: France Leaky Feeder Cables Revenue (undefined) Forecast, by Application 2020 & 2033
- Table 42: France Leaky Feeder Cables Volume (K) Forecast, by Application 2020 & 2033
- Table 43: Italy Leaky Feeder Cables Revenue (undefined) Forecast, by Application 2020 & 2033
- Table 44: Italy Leaky Feeder Cables Volume (K) Forecast, by Application 2020 & 2033
- Table 45: Spain Leaky Feeder Cables Revenue (undefined) Forecast, by Application 2020 & 2033
- Table 46: Spain Leaky Feeder Cables Volume (K) Forecast, by Application 2020 & 2033
- Table 47: Russia Leaky Feeder Cables Revenue (undefined) Forecast, by Application 2020 & 2033
- Table 48: Russia Leaky Feeder Cables Volume (K) Forecast, by Application 2020 & 2033
- Table 49: Benelux Leaky Feeder Cables Revenue (undefined) Forecast, by Application 2020 & 2033
- Table 50: Benelux Leaky Feeder Cables Volume (K) Forecast, by Application 2020 & 2033
- Table 51: Nordics Leaky Feeder Cables Revenue (undefined) Forecast, by Application 2020 & 2033
- Table 52: Nordics Leaky Feeder Cables Volume (K) Forecast, by Application 2020 & 2033
- Table 53: Rest of Europe Leaky Feeder Cables Revenue (undefined) Forecast, by Application 2020 & 2033
- Table 54: Rest of Europe Leaky Feeder Cables Volume (K) Forecast, by Application 2020 & 2033
- Table 55: Global Leaky Feeder Cables Revenue undefined Forecast, by Application 2020 & 2033
- Table 56: Global Leaky Feeder Cables Volume K Forecast, by Application 2020 & 2033
- Table 57: Global Leaky Feeder Cables Revenue undefined Forecast, by Types 2020 & 2033
- Table 58: Global Leaky Feeder Cables Volume K Forecast, by Types 2020 & 2033
- Table 59: Global Leaky Feeder Cables Revenue undefined Forecast, by Country 2020 & 2033
- Table 60: Global Leaky Feeder Cables Volume K Forecast, by Country 2020 & 2033
- Table 61: Turkey Leaky Feeder Cables Revenue (undefined) Forecast, by Application 2020 & 2033
- Table 62: Turkey Leaky Feeder Cables Volume (K) Forecast, by Application 2020 & 2033
- Table 63: Israel Leaky Feeder Cables Revenue (undefined) Forecast, by Application 2020 & 2033
- Table 64: Israel Leaky Feeder Cables Volume (K) Forecast, by Application 2020 & 2033
- Table 65: GCC Leaky Feeder Cables Revenue (undefined) Forecast, by Application 2020 & 2033
- Table 66: GCC Leaky Feeder Cables Volume (K) Forecast, by Application 2020 & 2033
- Table 67: North Africa Leaky Feeder Cables Revenue (undefined) Forecast, by Application 2020 & 2033
- Table 68: North Africa Leaky Feeder Cables Volume (K) Forecast, by Application 2020 & 2033
- Table 69: South Africa Leaky Feeder Cables Revenue (undefined) Forecast, by Application 2020 & 2033
- Table 70: South Africa Leaky Feeder Cables Volume (K) Forecast, by Application 2020 & 2033
- Table 71: Rest of Middle East & Africa Leaky Feeder Cables Revenue (undefined) Forecast, by Application 2020 & 2033
- Table 72: Rest of Middle East & Africa Leaky Feeder Cables Volume (K) Forecast, by Application 2020 & 2033
- Table 73: Global Leaky Feeder Cables Revenue undefined Forecast, by Application 2020 & 2033
- Table 74: Global Leaky Feeder Cables Volume K Forecast, by Application 2020 & 2033
- Table 75: Global Leaky Feeder Cables Revenue undefined Forecast, by Types 2020 & 2033
- Table 76: Global Leaky Feeder Cables Volume K Forecast, by Types 2020 & 2033
- Table 77: Global Leaky Feeder Cables Revenue undefined Forecast, by Country 2020 & 2033
- Table 78: Global Leaky Feeder Cables Volume K Forecast, by Country 2020 & 2033
- Table 79: China Leaky Feeder Cables Revenue (undefined) Forecast, by Application 2020 & 2033
- Table 80: China Leaky Feeder Cables Volume (K) Forecast, by Application 2020 & 2033
- Table 81: India Leaky Feeder Cables Revenue (undefined) Forecast, by Application 2020 & 2033
- Table 82: India Leaky Feeder Cables Volume (K) Forecast, by Application 2020 & 2033
- Table 83: Japan Leaky Feeder Cables Revenue (undefined) Forecast, by Application 2020 & 2033
- Table 84: Japan Leaky Feeder Cables Volume (K) Forecast, by Application 2020 & 2033
- Table 85: South Korea Leaky Feeder Cables Revenue (undefined) Forecast, by Application 2020 & 2033
- Table 86: South Korea Leaky Feeder Cables Volume (K) Forecast, by Application 2020 & 2033
- Table 87: ASEAN Leaky Feeder Cables Revenue (undefined) Forecast, by Application 2020 & 2033
- Table 88: ASEAN Leaky Feeder Cables Volume (K) Forecast, by Application 2020 & 2033
- Table 89: Oceania Leaky Feeder Cables Revenue (undefined) Forecast, by Application 2020 & 2033
- Table 90: Oceania Leaky Feeder Cables Volume (K) Forecast, by Application 2020 & 2033
- Table 91: Rest of Asia Pacific Leaky Feeder Cables Revenue (undefined) Forecast, by Application 2020 & 2033
- Table 92: Rest of Asia Pacific Leaky Feeder Cables Volume (K) Forecast, by Application 2020 & 2033
Frequently Asked Questions
1. What is the projected Compound Annual Growth Rate (CAGR) of the Leaky Feeder Cables?
The projected CAGR is approximately 5%.
2. Which companies are prominent players in the Leaky Feeder Cables?
Key companies in the market include RFS, Carroll Technologies, Hytera, Icom, CommScope, Times Microwave Systems, Shenzhen Lianstar Technology, Kanhha Cables, Norden Communication, SRFS Teleinfra.
3. What are the main segments of the Leaky Feeder Cables?
The market segments include Application, Types.
4. Can you provide details about the market size?
The market size is estimated to be USD XXX N/A as of 2022.
5. What are some drivers contributing to market growth?
N/A
6. What are the notable trends driving market growth?
N/A
7. Are there any restraints impacting market growth?
N/A
8. Can you provide examples of recent developments in the market?
N/A
9. What pricing options are available for accessing the report?
Pricing options include single-user, multi-user, and enterprise licenses priced at USD 4350.00, USD 6525.00, and USD 8700.00 respectively.
10. Is the market size provided in terms of value or volume?
The market size is provided in terms of value, measured in N/A and volume, measured in K.
11. Are there any specific market keywords associated with the report?
Yes, the market keyword associated with the report is "Leaky Feeder Cables," which aids in identifying and referencing the specific market segment covered.
12. How do I determine which pricing option suits my needs best?
The pricing options vary based on user requirements and access needs. Individual users may opt for single-user licenses, while businesses requiring broader access may choose multi-user or enterprise licenses for cost-effective access to the report.
13. Are there any additional resources or data provided in the Leaky Feeder Cables report?
While the report offers comprehensive insights, it's advisable to review the specific contents or supplementary materials provided to ascertain if additional resources or data are available.
14. How can I stay updated on further developments or reports in the Leaky Feeder Cables?
To stay informed about further developments, trends, and reports in the Leaky Feeder Cables, consider subscribing to industry newsletters, following relevant companies and organizations, or regularly checking reputable industry news sources and publications.
Methodology
Step 1 - Identification of Relevant Samples Size from Population Database


Step 2 - Approaches for Defining Global Market Size (Value, Volume* & Price*)

Note*: In applicable scenarios
Step 3 - Data Sources
Primary Research
- Web Analytics
- Survey Reports
- Research Institute
- Latest Research Reports
- Opinion Leaders
Secondary Research
- Annual Reports
- White Paper
- Latest Press Release
- Industry Association
- Paid Database
- Investor Presentations

Step 4 - Data Triangulation
Involves using different sources of information in order to increase the validity of a study
These sources are likely to be stakeholders in a program - participants, other researchers, program staff, other community members, and so on.
Then we put all data in single framework & apply various statistical tools to find out the dynamic on the market.
During the analysis stage, feedback from the stakeholder groups would be compared to determine areas of agreement as well as areas of divergence