
Key Insights
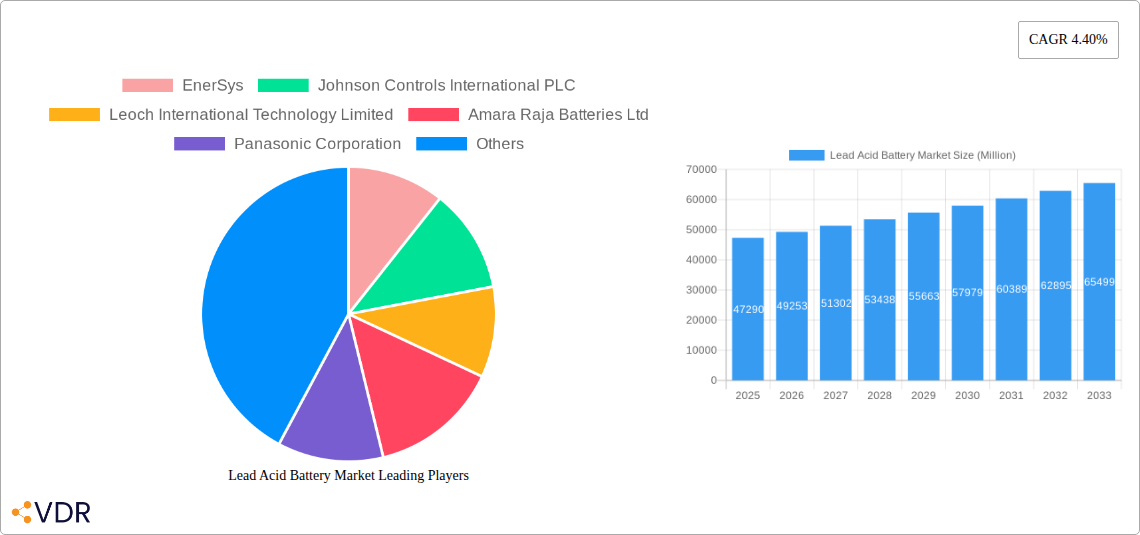
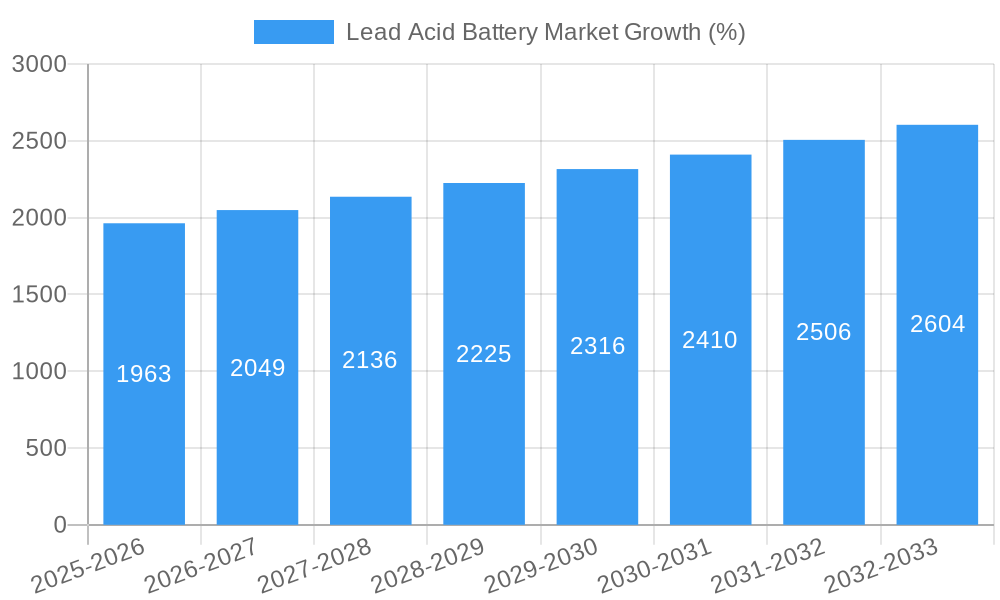
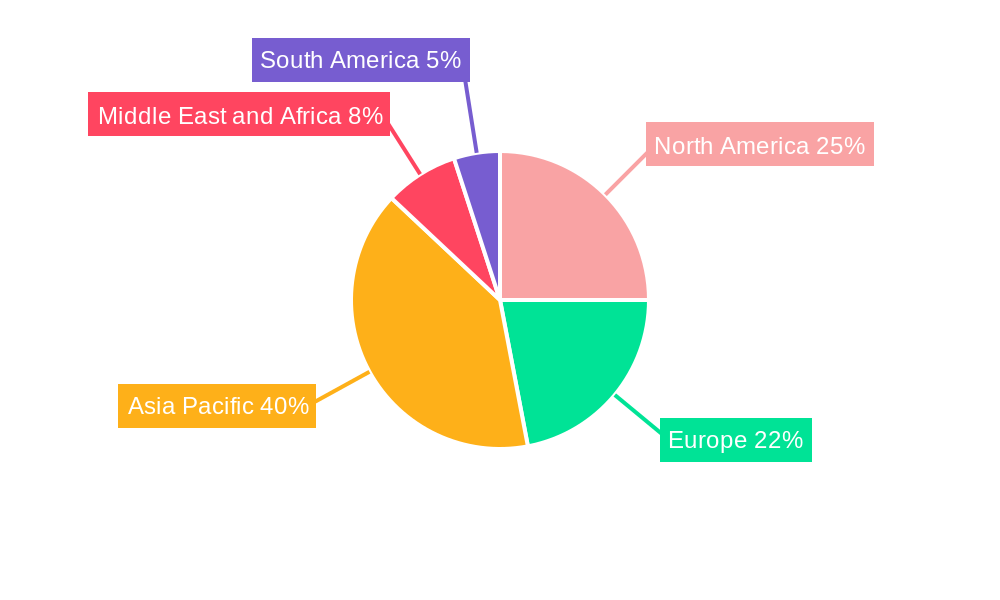
The global lead-acid battery market, valued at $47.29 billion in 2025, is projected to experience robust growth, driven primarily by the increasing demand for energy storage solutions in various sectors. The compound annual growth rate (CAGR) of 4.40% from 2025 to 2033 indicates a significant expansion of the market over the forecast period. Key drivers include the rising adoption of lead-acid batteries in automotive applications (SLI batteries), particularly in developing economies experiencing rapid vehicle ownership growth. The increasing need for reliable backup power in telecommunications and Uninterruptible Power Supply (UPS) systems further fuels market expansion. Technological advancements, such as the development of more efficient flooded and VRLA batteries with improved lifespan and performance, are also contributing factors. While regulatory pressures concerning environmental concerns and the emergence of alternative battery technologies like lithium-ion pose potential restraints, the cost-effectiveness and mature technology of lead-acid batteries ensure their continued relevance in numerous applications for the foreseeable future. The market is segmented by technology (flooded, VRLA) and application (SLI, stationary, portable, others), with the SLI segment currently dominating due to its widespread use in vehicles. Geographical distribution reveals strong growth potential in Asia-Pacific, driven by the expanding automotive and industrial sectors in countries like China and India. North America and Europe, while mature markets, continue to contribute significantly to overall market value.
The market's growth trajectory will likely see a gradual acceleration over the next decade, influenced by factors like evolving energy storage needs and technological improvements in lead-acid battery design and manufacturing. The continued reliance on lead-acid batteries in applications demanding high reliability and cost-effectiveness, coupled with ongoing research and development focusing on enhanced performance and environmental sustainability, will define the future landscape of this market. While competition from alternative technologies is undeniable, the market will likely see a dynamic interplay between lead-acid and other battery chemistries, with lead-acid batteries retaining a strong position in niche segments and price-sensitive applications. The geographical distribution of market share is expected to evolve, with developing economies showing progressively higher growth rates compared to established markets.
Lead Acid Battery Market: A Comprehensive Market Report (2019-2033)
This comprehensive report provides a detailed analysis of the global Lead Acid Battery market, encompassing market dynamics, growth trends, regional dominance, product landscape, key challenges, emerging opportunities, and key players. The study period covers 2019-2033, with 2025 as the base and estimated year. The report segments the market by technology (Flooded, VRLA) and application (SLI, Stationary, Portable, Other), offering invaluable insights for industry professionals, investors, and strategic decision-makers. The market size is projected to reach xx Million units by 2033.
Lead Acid Battery Market Dynamics & Structure
The lead-acid battery market, a mature yet evolving sector, is characterized by a moderately concentrated landscape with several major players commanding significant market shares. EnerSys, Johnson Controls International PLC, and GS Yuasa Corporation, among others, hold prominent positions. Market concentration is influenced by factors like economies of scale in manufacturing and distribution networks. Technological innovation, though gradual, plays a crucial role, with advancements in VRLA technology and improved lifecycle management impacting market dynamics. Stringent environmental regulations related to lead recycling and disposal pose considerable challenges, driving the need for sustainable practices and influencing the market's trajectory. The presence of alternative battery technologies like lithium-ion presents a significant competitive threat, pushing lead-acid manufacturers to innovate and improve cost-competitiveness.
- Market Concentration: Highly concentrated, with the top 5 players holding approximately xx% of the market share in 2024.
- Technological Innovation: Incremental improvements in VRLA technology, focusing on enhanced lifespan and performance.
- Regulatory Framework: Stringent environmental regulations driving the need for improved recycling infrastructure and sustainable manufacturing.
- Competitive Substitutes: Lithium-ion batteries pose a significant competitive threat, particularly in specific applications.
- M&A Trends: Moderate M&A activity focused on geographical expansion and technological diversification. xx M&A deals were recorded between 2019 and 2024.
Lead Acid Battery Market Growth Trends & Insights
The global lead-acid battery market witnessed steady growth during the historical period (2019-2024), driven primarily by robust demand from the automotive (SLI) sector and the expanding stationary battery applications (telecom, UPS, ESS). The market experienced a CAGR of xx% during this period. Adoption rates in emerging economies, fueled by infrastructure development and industrialization, contributed significantly to this growth. However, technological disruptions from alternative battery technologies, particularly lithium-ion, are gradually impacting market share, particularly in certain segments like electric vehicles. Consumer behavior shifts towards environmentally friendly products also present challenges. The forecast period (2025-2033) anticipates a moderate CAGR of xx%, influenced by continued demand in traditional applications and the ongoing transition to cleaner energy solutions. Market penetration within existing and emerging applications remains a key growth driver.
Dominant Regions, Countries, or Segments in Lead Acid Battery Market
Asia-Pacific dominates the lead-acid battery market, driven by high automotive production, substantial infrastructure development, and the increasing adoption of stationary batteries for grid-scale energy storage. China, India, and other Southeast Asian countries are key growth contributors.
- Leading Segment: SLI (Starting, Lighting, Ignition) batteries continue to represent the largest market segment, contributing approximately xx% of the total market in 2024.
- Leading Technology: VRLA (Valve Regulated Lead-acid) batteries are witnessing faster growth compared to flooded batteries due to improved safety and maintenance-free operation.
- Key Drivers:
- Robust automotive sector growth in Asia-Pacific.
- Expanding telecom and UPS infrastructure in developing economies.
- Increasing adoption of ESS for renewable energy integration.
- Favorable government policies promoting renewable energy and grid modernization.
Lead Acid Battery Market Product Landscape
Lead-acid battery technology continues to evolve with advancements focusing on improved energy density, longer lifespan, and enhanced safety features. VRLA batteries are gaining market share due to their superior performance and maintenance-free operation. Product innovations include enhanced designs for specific applications, such as deep-cycle batteries for stationary storage and high-performance batteries for automotive SLI. Unique selling propositions often center around improved cycle life, cost-effectiveness, and reliability.
Key Drivers, Barriers & Challenges in Lead Acid Battery Market
Key Drivers:
- Increasing demand from the automotive industry.
- Growing adoption of stationary batteries in the telecom and renewable energy sectors.
- Cost-effectiveness compared to alternative battery technologies.
Key Challenges:
- Environmental concerns related to lead recycling and disposal.
- Competition from alternative battery technologies (lithium-ion).
- Fluctuations in raw material prices (lead).
- Approximately xx% of the market faces supply chain constraints related to lead sourcing, impacting production capacity.
Emerging Opportunities in Lead Acid Battery Market
- Expansion into new applications, such as microgrids and off-grid energy solutions.
- Development of advanced battery management systems (BMS) to improve battery performance and lifecycle.
- Exploration of alternative lead-acid battery chemistries to enhance energy density and performance.
- Focus on sustainable manufacturing practices and environmentally friendly recycling solutions.
Growth Accelerators in the Lead Acid Battery Market Industry
Technological advancements focusing on improving energy density and extending battery lifespan will be crucial in maintaining market competitiveness. Strategic partnerships with key players in the renewable energy sector will drive market expansion into the energy storage segment. Moreover, geographic diversification and investment in advanced manufacturing facilities are key growth catalysts for the lead-acid battery industry.
Key Players Shaping the Lead Acid Battery Market Market
- EnerSys
- Johnson Controls International PLC
- Leoch International Technology Limited
- Amara Raja Batteries Ltd
- Panasonic Corporation
- East Penn Manufacturing Co
- C&D Technologies Inc
- GS Yuasa Corporation
- Exide Technologies Inc
Notable Milestones in Lead Acid Battery Market Sector
- October 2022: BAE USA's stationary lead-acid battery energy storage system received ANSI/CAN/UL 1973 certification from UL Solutions.
- July 2022: Amara Raja Batteries (ARBL) announced plans to expand its lead-acid business into Africa, the Middle East, and Southeast Asia.
In-Depth Lead Acid Battery Market Market Outlook
The lead-acid battery market, while facing competition from emerging technologies, retains significant growth potential driven by its cost-effectiveness and reliability in established applications. Continued innovation in VRLA technology, coupled with strategic market expansion into emerging economies and renewable energy sectors, will shape future market dynamics. Opportunities exist in developing efficient recycling solutions and exploring new applications, ensuring the long-term viability and sustainability of the lead-acid battery industry.
Lead Acid Battery Market Segmentation
-
1. Application
- 1.1. SLI (Starting, Lighting, Ignition) Batteries
- 1.2. Stationa
- 1.3. Portable Batteries (Consumer Electronics, etc.)
- 1.4. Other Applications
-
2. Technology
- 2.1. Flooded
- 2.2. VRLA (Valve Regulated Lead-acid)
Lead Acid Battery Market Segmentation By Geography
-
1. North America
- 1.1. United States
- 1.2. Canada
- 1.3. Rest of North America
-
2. Europe
- 2.1. Germany
- 2.2. France
- 2.3. Italy
- 2.4. United Kingdom
- 2.5. Russian Federation
- 2.6. Rest of Europe
-
3. Asia Pacific
- 3.1. China
- 3.2. India
- 3.3. Japan
- 3.4. South Korea
- 3.5. Rest of Asia Pacific
-
4. Middle East and Africa
- 4.1. Saudi Arabia
- 4.2. United Arab Emirates
- 4.3. South Africa
- 4.4. Rest of Middle East and Africa
-
5. South America
- 5.1. Brazil
- 5.2. Argentina
- 5.3. Rest of South America
Lead Acid Battery Market REPORT HIGHLIGHTS
| Aspects | Details |
|---|---|
| Study Period | 2019-2033 |
| Base Year | 2024 |
| Estimated Year | 2025 |
| Forecast Period | 2025-2033 |
| Historical Period | 2019-2024 |
| Growth Rate | CAGR of 4.40% from 2019-2033 |
| Segmentation |
|
Table of Contents
- 1. Introduction
- 1.1. Research Scope
- 1.2. Market Segmentation
- 1.3. Research Methodology
- 1.4. Definitions and Assumptions
- 2. Executive Summary
- 2.1. Introduction
- 3. Market Dynamics
- 3.1. Introduction
- 3.2. Market Drivers
- 3.2.1. Presence of Stringent Regulation for Air Quality Management
- 3.3. Market Restrains
- 3.3.1. High Capital is Required for the Installation of an Air Quality Control System
- 3.4. Market Trends
- 3.4.1. SLI Battery Segment to Dominate the Market
- 4. Market Factor Analysis
- 4.1. Porters Five Forces
- 4.2. Supply/Value Chain
- 4.3. PESTEL analysis
- 4.4. Market Entropy
- 4.5. Patent/Trademark Analysis
- 5. Global Lead Acid Battery Market Analysis, Insights and Forecast, 2019-2031
- 5.1. Market Analysis, Insights and Forecast - by Application
- 5.1.1. SLI (Starting, Lighting, Ignition) Batteries
- 5.1.2. Stationa
- 5.1.3. Portable Batteries (Consumer Electronics, etc.)
- 5.1.4. Other Applications
- 5.2. Market Analysis, Insights and Forecast - by Technology
- 5.2.1. Flooded
- 5.2.2. VRLA (Valve Regulated Lead-acid)
- 5.3. Market Analysis, Insights and Forecast - by Region
- 5.3.1. North America
- 5.3.2. Europe
- 5.3.3. Asia Pacific
- 5.3.4. Middle East and Africa
- 5.3.5. South America
- 5.1. Market Analysis, Insights and Forecast - by Application
- 6. North America Lead Acid Battery Market Analysis, Insights and Forecast, 2019-2031
- 6.1. Market Analysis, Insights and Forecast - by Application
- 6.1.1. SLI (Starting, Lighting, Ignition) Batteries
- 6.1.2. Stationa
- 6.1.3. Portable Batteries (Consumer Electronics, etc.)
- 6.1.4. Other Applications
- 6.2. Market Analysis, Insights and Forecast - by Technology
- 6.2.1. Flooded
- 6.2.2. VRLA (Valve Regulated Lead-acid)
- 6.1. Market Analysis, Insights and Forecast - by Application
- 7. Europe Lead Acid Battery Market Analysis, Insights and Forecast, 2019-2031
- 7.1. Market Analysis, Insights and Forecast - by Application
- 7.1.1. SLI (Starting, Lighting, Ignition) Batteries
- 7.1.2. Stationa
- 7.1.3. Portable Batteries (Consumer Electronics, etc.)
- 7.1.4. Other Applications
- 7.2. Market Analysis, Insights and Forecast - by Technology
- 7.2.1. Flooded
- 7.2.2. VRLA (Valve Regulated Lead-acid)
- 7.1. Market Analysis, Insights and Forecast - by Application
- 8. Asia Pacific Lead Acid Battery Market Analysis, Insights and Forecast, 2019-2031
- 8.1. Market Analysis, Insights and Forecast - by Application
- 8.1.1. SLI (Starting, Lighting, Ignition) Batteries
- 8.1.2. Stationa
- 8.1.3. Portable Batteries (Consumer Electronics, etc.)
- 8.1.4. Other Applications
- 8.2. Market Analysis, Insights and Forecast - by Technology
- 8.2.1. Flooded
- 8.2.2. VRLA (Valve Regulated Lead-acid)
- 8.1. Market Analysis, Insights and Forecast - by Application
- 9. Middle East and Africa Lead Acid Battery Market Analysis, Insights and Forecast, 2019-2031
- 9.1. Market Analysis, Insights and Forecast - by Application
- 9.1.1. SLI (Starting, Lighting, Ignition) Batteries
- 9.1.2. Stationa
- 9.1.3. Portable Batteries (Consumer Electronics, etc.)
- 9.1.4. Other Applications
- 9.2. Market Analysis, Insights and Forecast - by Technology
- 9.2.1. Flooded
- 9.2.2. VRLA (Valve Regulated Lead-acid)
- 9.1. Market Analysis, Insights and Forecast - by Application
- 10. South America Lead Acid Battery Market Analysis, Insights and Forecast, 2019-2031
- 10.1. Market Analysis, Insights and Forecast - by Application
- 10.1.1. SLI (Starting, Lighting, Ignition) Batteries
- 10.1.2. Stationa
- 10.1.3. Portable Batteries (Consumer Electronics, etc.)
- 10.1.4. Other Applications
- 10.2. Market Analysis, Insights and Forecast - by Technology
- 10.2.1. Flooded
- 10.2.2. VRLA (Valve Regulated Lead-acid)
- 10.1. Market Analysis, Insights and Forecast - by Application
- 11. North America Lead Acid Battery Market Analysis, Insights and Forecast, 2019-2031
- 11.1. Market Analysis, Insights and Forecast - By Country/Sub-region
- 11.1.1 United States
- 11.1.2 Canada
- 11.1.3 Rest of North America
- 12. Europe Lead Acid Battery Market Analysis, Insights and Forecast, 2019-2031
- 12.1. Market Analysis, Insights and Forecast - By Country/Sub-region
- 12.1.1 Germany
- 12.1.2 France
- 12.1.3 Italy
- 12.1.4 United Kingdom
- 12.1.5 Russian Federation
- 12.1.6 Rest of Europe
- 13. Asia Pacific Lead Acid Battery Market Analysis, Insights and Forecast, 2019-2031
- 13.1. Market Analysis, Insights and Forecast - By Country/Sub-region
- 13.1.1 China
- 13.1.2 India
- 13.1.3 Japan
- 13.1.4 South Korea
- 13.1.5 Rest of Asia Pacific
- 14. Middle East and Africa Lead Acid Battery Market Analysis, Insights and Forecast, 2019-2031
- 14.1. Market Analysis, Insights and Forecast - By Country/Sub-region
- 14.1.1 Saudi Arabia
- 14.1.2 United Arab Emirates
- 14.1.3 South Africa
- 14.1.4 Rest of Middle East and Africa
- 15. South America Lead Acid Battery Market Analysis, Insights and Forecast, 2019-2031
- 15.1. Market Analysis, Insights and Forecast - By Country/Sub-region
- 15.1.1 Brazil
- 15.1.2 Argentina
- 15.1.3 Rest of South America
- 16. Competitive Analysis
- 16.1. Global Market Share Analysis 2024
- 16.2. Company Profiles
- 16.2.1 EnerSys
- 16.2.1.1. Overview
- 16.2.1.2. Products
- 16.2.1.3. SWOT Analysis
- 16.2.1.4. Recent Developments
- 16.2.1.5. Financials (Based on Availability)
- 16.2.2 Johnson Controls International PLC
- 16.2.2.1. Overview
- 16.2.2.2. Products
- 16.2.2.3. SWOT Analysis
- 16.2.2.4. Recent Developments
- 16.2.2.5. Financials (Based on Availability)
- 16.2.3 Leoch International Technology Limited
- 16.2.3.1. Overview
- 16.2.3.2. Products
- 16.2.3.3. SWOT Analysis
- 16.2.3.4. Recent Developments
- 16.2.3.5. Financials (Based on Availability)
- 16.2.4 Amara Raja Batteries Ltd
- 16.2.4.1. Overview
- 16.2.4.2. Products
- 16.2.4.3. SWOT Analysis
- 16.2.4.4. Recent Developments
- 16.2.4.5. Financials (Based on Availability)
- 16.2.5 Panasonic Corporation
- 16.2.5.1. Overview
- 16.2.5.2. Products
- 16.2.5.3. SWOT Analysis
- 16.2.5.4. Recent Developments
- 16.2.5.5. Financials (Based on Availability)
- 16.2.6 East Penn Manufacturing Co
- 16.2.6.1. Overview
- 16.2.6.2. Products
- 16.2.6.3. SWOT Analysis
- 16.2.6.4. Recent Developments
- 16.2.6.5. Financials (Based on Availability)
- 16.2.7 C&D Technologies Inc
- 16.2.7.1. Overview
- 16.2.7.2. Products
- 16.2.7.3. SWOT Analysis
- 16.2.7.4. Recent Developments
- 16.2.7.5. Financials (Based on Availability)
- 16.2.8 GS Yuasa Corporation
- 16.2.8.1. Overview
- 16.2.8.2. Products
- 16.2.8.3. SWOT Analysis
- 16.2.8.4. Recent Developments
- 16.2.8.5. Financials (Based on Availability)
- 16.2.9 Exide Technologies Inc
- 16.2.9.1. Overview
- 16.2.9.2. Products
- 16.2.9.3. SWOT Analysis
- 16.2.9.4. Recent Developments
- 16.2.9.5. Financials (Based on Availability)
- 16.2.1 EnerSys
List of Figures
- Figure 1: Global Lead Acid Battery Market Revenue Breakdown (Million, %) by Region 2024 & 2032
- Figure 2: Global Lead Acid Battery Market Volume Breakdown (K Unit, %) by Region 2024 & 2032
- Figure 3: North America Lead Acid Battery Market Revenue (Million), by Country 2024 & 2032
- Figure 4: North America Lead Acid Battery Market Volume (K Unit), by Country 2024 & 2032
- Figure 5: North America Lead Acid Battery Market Revenue Share (%), by Country 2024 & 2032
- Figure 6: North America Lead Acid Battery Market Volume Share (%), by Country 2024 & 2032
- Figure 7: Europe Lead Acid Battery Market Revenue (Million), by Country 2024 & 2032
- Figure 8: Europe Lead Acid Battery Market Volume (K Unit), by Country 2024 & 2032
- Figure 9: Europe Lead Acid Battery Market Revenue Share (%), by Country 2024 & 2032
- Figure 10: Europe Lead Acid Battery Market Volume Share (%), by Country 2024 & 2032
- Figure 11: Asia Pacific Lead Acid Battery Market Revenue (Million), by Country 2024 & 2032
- Figure 12: Asia Pacific Lead Acid Battery Market Volume (K Unit), by Country 2024 & 2032
- Figure 13: Asia Pacific Lead Acid Battery Market Revenue Share (%), by Country 2024 & 2032
- Figure 14: Asia Pacific Lead Acid Battery Market Volume Share (%), by Country 2024 & 2032
- Figure 15: Middle East and Africa Lead Acid Battery Market Revenue (Million), by Country 2024 & 2032
- Figure 16: Middle East and Africa Lead Acid Battery Market Volume (K Unit), by Country 2024 & 2032
- Figure 17: Middle East and Africa Lead Acid Battery Market Revenue Share (%), by Country 2024 & 2032
- Figure 18: Middle East and Africa Lead Acid Battery Market Volume Share (%), by Country 2024 & 2032
- Figure 19: South America Lead Acid Battery Market Revenue (Million), by Country 2024 & 2032
- Figure 20: South America Lead Acid Battery Market Volume (K Unit), by Country 2024 & 2032
- Figure 21: South America Lead Acid Battery Market Revenue Share (%), by Country 2024 & 2032
- Figure 22: South America Lead Acid Battery Market Volume Share (%), by Country 2024 & 2032
- Figure 23: North America Lead Acid Battery Market Revenue (Million), by Application 2024 & 2032
- Figure 24: North America Lead Acid Battery Market Volume (K Unit), by Application 2024 & 2032
- Figure 25: North America Lead Acid Battery Market Revenue Share (%), by Application 2024 & 2032
- Figure 26: North America Lead Acid Battery Market Volume Share (%), by Application 2024 & 2032
- Figure 27: North America Lead Acid Battery Market Revenue (Million), by Technology 2024 & 2032
- Figure 28: North America Lead Acid Battery Market Volume (K Unit), by Technology 2024 & 2032
- Figure 29: North America Lead Acid Battery Market Revenue Share (%), by Technology 2024 & 2032
- Figure 30: North America Lead Acid Battery Market Volume Share (%), by Technology 2024 & 2032
- Figure 31: North America Lead Acid Battery Market Revenue (Million), by Country 2024 & 2032
- Figure 32: North America Lead Acid Battery Market Volume (K Unit), by Country 2024 & 2032
- Figure 33: North America Lead Acid Battery Market Revenue Share (%), by Country 2024 & 2032
- Figure 34: North America Lead Acid Battery Market Volume Share (%), by Country 2024 & 2032
- Figure 35: Europe Lead Acid Battery Market Revenue (Million), by Application 2024 & 2032
- Figure 36: Europe Lead Acid Battery Market Volume (K Unit), by Application 2024 & 2032
- Figure 37: Europe Lead Acid Battery Market Revenue Share (%), by Application 2024 & 2032
- Figure 38: Europe Lead Acid Battery Market Volume Share (%), by Application 2024 & 2032
- Figure 39: Europe Lead Acid Battery Market Revenue (Million), by Technology 2024 & 2032
- Figure 40: Europe Lead Acid Battery Market Volume (K Unit), by Technology 2024 & 2032
- Figure 41: Europe Lead Acid Battery Market Revenue Share (%), by Technology 2024 & 2032
- Figure 42: Europe Lead Acid Battery Market Volume Share (%), by Technology 2024 & 2032
- Figure 43: Europe Lead Acid Battery Market Revenue (Million), by Country 2024 & 2032
- Figure 44: Europe Lead Acid Battery Market Volume (K Unit), by Country 2024 & 2032
- Figure 45: Europe Lead Acid Battery Market Revenue Share (%), by Country 2024 & 2032
- Figure 46: Europe Lead Acid Battery Market Volume Share (%), by Country 2024 & 2032
- Figure 47: Asia Pacific Lead Acid Battery Market Revenue (Million), by Application 2024 & 2032
- Figure 48: Asia Pacific Lead Acid Battery Market Volume (K Unit), by Application 2024 & 2032
- Figure 49: Asia Pacific Lead Acid Battery Market Revenue Share (%), by Application 2024 & 2032
- Figure 50: Asia Pacific Lead Acid Battery Market Volume Share (%), by Application 2024 & 2032
- Figure 51: Asia Pacific Lead Acid Battery Market Revenue (Million), by Technology 2024 & 2032
- Figure 52: Asia Pacific Lead Acid Battery Market Volume (K Unit), by Technology 2024 & 2032
- Figure 53: Asia Pacific Lead Acid Battery Market Revenue Share (%), by Technology 2024 & 2032
- Figure 54: Asia Pacific Lead Acid Battery Market Volume Share (%), by Technology 2024 & 2032
- Figure 55: Asia Pacific Lead Acid Battery Market Revenue (Million), by Country 2024 & 2032
- Figure 56: Asia Pacific Lead Acid Battery Market Volume (K Unit), by Country 2024 & 2032
- Figure 57: Asia Pacific Lead Acid Battery Market Revenue Share (%), by Country 2024 & 2032
- Figure 58: Asia Pacific Lead Acid Battery Market Volume Share (%), by Country 2024 & 2032
- Figure 59: Middle East and Africa Lead Acid Battery Market Revenue (Million), by Application 2024 & 2032
- Figure 60: Middle East and Africa Lead Acid Battery Market Volume (K Unit), by Application 2024 & 2032
- Figure 61: Middle East and Africa Lead Acid Battery Market Revenue Share (%), by Application 2024 & 2032
- Figure 62: Middle East and Africa Lead Acid Battery Market Volume Share (%), by Application 2024 & 2032
- Figure 63: Middle East and Africa Lead Acid Battery Market Revenue (Million), by Technology 2024 & 2032
- Figure 64: Middle East and Africa Lead Acid Battery Market Volume (K Unit), by Technology 2024 & 2032
- Figure 65: Middle East and Africa Lead Acid Battery Market Revenue Share (%), by Technology 2024 & 2032
- Figure 66: Middle East and Africa Lead Acid Battery Market Volume Share (%), by Technology 2024 & 2032
- Figure 67: Middle East and Africa Lead Acid Battery Market Revenue (Million), by Country 2024 & 2032
- Figure 68: Middle East and Africa Lead Acid Battery Market Volume (K Unit), by Country 2024 & 2032
- Figure 69: Middle East and Africa Lead Acid Battery Market Revenue Share (%), by Country 2024 & 2032
- Figure 70: Middle East and Africa Lead Acid Battery Market Volume Share (%), by Country 2024 & 2032
- Figure 71: South America Lead Acid Battery Market Revenue (Million), by Application 2024 & 2032
- Figure 72: South America Lead Acid Battery Market Volume (K Unit), by Application 2024 & 2032
- Figure 73: South America Lead Acid Battery Market Revenue Share (%), by Application 2024 & 2032
- Figure 74: South America Lead Acid Battery Market Volume Share (%), by Application 2024 & 2032
- Figure 75: South America Lead Acid Battery Market Revenue (Million), by Technology 2024 & 2032
- Figure 76: South America Lead Acid Battery Market Volume (K Unit), by Technology 2024 & 2032
- Figure 77: South America Lead Acid Battery Market Revenue Share (%), by Technology 2024 & 2032
- Figure 78: South America Lead Acid Battery Market Volume Share (%), by Technology 2024 & 2032
- Figure 79: South America Lead Acid Battery Market Revenue (Million), by Country 2024 & 2032
- Figure 80: South America Lead Acid Battery Market Volume (K Unit), by Country 2024 & 2032
- Figure 81: South America Lead Acid Battery Market Revenue Share (%), by Country 2024 & 2032
- Figure 82: South America Lead Acid Battery Market Volume Share (%), by Country 2024 & 2032
List of Tables
- Table 1: Global Lead Acid Battery Market Revenue Million Forecast, by Region 2019 & 2032
- Table 2: Global Lead Acid Battery Market Volume K Unit Forecast, by Region 2019 & 2032
- Table 3: Global Lead Acid Battery Market Revenue Million Forecast, by Application 2019 & 2032
- Table 4: Global Lead Acid Battery Market Volume K Unit Forecast, by Application 2019 & 2032
- Table 5: Global Lead Acid Battery Market Revenue Million Forecast, by Technology 2019 & 2032
- Table 6: Global Lead Acid Battery Market Volume K Unit Forecast, by Technology 2019 & 2032
- Table 7: Global Lead Acid Battery Market Revenue Million Forecast, by Region 2019 & 2032
- Table 8: Global Lead Acid Battery Market Volume K Unit Forecast, by Region 2019 & 2032
- Table 9: Global Lead Acid Battery Market Revenue Million Forecast, by Country 2019 & 2032
- Table 10: Global Lead Acid Battery Market Volume K Unit Forecast, by Country 2019 & 2032
- Table 11: United States Lead Acid Battery Market Revenue (Million) Forecast, by Application 2019 & 2032
- Table 12: United States Lead Acid Battery Market Volume (K Unit) Forecast, by Application 2019 & 2032
- Table 13: Canada Lead Acid Battery Market Revenue (Million) Forecast, by Application 2019 & 2032
- Table 14: Canada Lead Acid Battery Market Volume (K Unit) Forecast, by Application 2019 & 2032
- Table 15: Rest of North America Lead Acid Battery Market Revenue (Million) Forecast, by Application 2019 & 2032
- Table 16: Rest of North America Lead Acid Battery Market Volume (K Unit) Forecast, by Application 2019 & 2032
- Table 17: Global Lead Acid Battery Market Revenue Million Forecast, by Country 2019 & 2032
- Table 18: Global Lead Acid Battery Market Volume K Unit Forecast, by Country 2019 & 2032
- Table 19: Germany Lead Acid Battery Market Revenue (Million) Forecast, by Application 2019 & 2032
- Table 20: Germany Lead Acid Battery Market Volume (K Unit) Forecast, by Application 2019 & 2032
- Table 21: France Lead Acid Battery Market Revenue (Million) Forecast, by Application 2019 & 2032
- Table 22: France Lead Acid Battery Market Volume (K Unit) Forecast, by Application 2019 & 2032
- Table 23: Italy Lead Acid Battery Market Revenue (Million) Forecast, by Application 2019 & 2032
- Table 24: Italy Lead Acid Battery Market Volume (K Unit) Forecast, by Application 2019 & 2032
- Table 25: United Kingdom Lead Acid Battery Market Revenue (Million) Forecast, by Application 2019 & 2032
- Table 26: United Kingdom Lead Acid Battery Market Volume (K Unit) Forecast, by Application 2019 & 2032
- Table 27: Russian Federation Lead Acid Battery Market Revenue (Million) Forecast, by Application 2019 & 2032
- Table 28: Russian Federation Lead Acid Battery Market Volume (K Unit) Forecast, by Application 2019 & 2032
- Table 29: Rest of Europe Lead Acid Battery Market Revenue (Million) Forecast, by Application 2019 & 2032
- Table 30: Rest of Europe Lead Acid Battery Market Volume (K Unit) Forecast, by Application 2019 & 2032
- Table 31: Global Lead Acid Battery Market Revenue Million Forecast, by Country 2019 & 2032
- Table 32: Global Lead Acid Battery Market Volume K Unit Forecast, by Country 2019 & 2032
- Table 33: China Lead Acid Battery Market Revenue (Million) Forecast, by Application 2019 & 2032
- Table 34: China Lead Acid Battery Market Volume (K Unit) Forecast, by Application 2019 & 2032
- Table 35: India Lead Acid Battery Market Revenue (Million) Forecast, by Application 2019 & 2032
- Table 36: India Lead Acid Battery Market Volume (K Unit) Forecast, by Application 2019 & 2032
- Table 37: Japan Lead Acid Battery Market Revenue (Million) Forecast, by Application 2019 & 2032
- Table 38: Japan Lead Acid Battery Market Volume (K Unit) Forecast, by Application 2019 & 2032
- Table 39: South Korea Lead Acid Battery Market Revenue (Million) Forecast, by Application 2019 & 2032
- Table 40: South Korea Lead Acid Battery Market Volume (K Unit) Forecast, by Application 2019 & 2032
- Table 41: Rest of Asia Pacific Lead Acid Battery Market Revenue (Million) Forecast, by Application 2019 & 2032
- Table 42: Rest of Asia Pacific Lead Acid Battery Market Volume (K Unit) Forecast, by Application 2019 & 2032
- Table 43: Global Lead Acid Battery Market Revenue Million Forecast, by Country 2019 & 2032
- Table 44: Global Lead Acid Battery Market Volume K Unit Forecast, by Country 2019 & 2032
- Table 45: Saudi Arabia Lead Acid Battery Market Revenue (Million) Forecast, by Application 2019 & 2032
- Table 46: Saudi Arabia Lead Acid Battery Market Volume (K Unit) Forecast, by Application 2019 & 2032
- Table 47: United Arab Emirates Lead Acid Battery Market Revenue (Million) Forecast, by Application 2019 & 2032
- Table 48: United Arab Emirates Lead Acid Battery Market Volume (K Unit) Forecast, by Application 2019 & 2032
- Table 49: South Africa Lead Acid Battery Market Revenue (Million) Forecast, by Application 2019 & 2032
- Table 50: South Africa Lead Acid Battery Market Volume (K Unit) Forecast, by Application 2019 & 2032
- Table 51: Rest of Middle East and Africa Lead Acid Battery Market Revenue (Million) Forecast, by Application 2019 & 2032
- Table 52: Rest of Middle East and Africa Lead Acid Battery Market Volume (K Unit) Forecast, by Application 2019 & 2032
- Table 53: Global Lead Acid Battery Market Revenue Million Forecast, by Country 2019 & 2032
- Table 54: Global Lead Acid Battery Market Volume K Unit Forecast, by Country 2019 & 2032
- Table 55: Brazil Lead Acid Battery Market Revenue (Million) Forecast, by Application 2019 & 2032
- Table 56: Brazil Lead Acid Battery Market Volume (K Unit) Forecast, by Application 2019 & 2032
- Table 57: Argentina Lead Acid Battery Market Revenue (Million) Forecast, by Application 2019 & 2032
- Table 58: Argentina Lead Acid Battery Market Volume (K Unit) Forecast, by Application 2019 & 2032
- Table 59: Rest of South America Lead Acid Battery Market Revenue (Million) Forecast, by Application 2019 & 2032
- Table 60: Rest of South America Lead Acid Battery Market Volume (K Unit) Forecast, by Application 2019 & 2032
- Table 61: Global Lead Acid Battery Market Revenue Million Forecast, by Application 2019 & 2032
- Table 62: Global Lead Acid Battery Market Volume K Unit Forecast, by Application 2019 & 2032
- Table 63: Global Lead Acid Battery Market Revenue Million Forecast, by Technology 2019 & 2032
- Table 64: Global Lead Acid Battery Market Volume K Unit Forecast, by Technology 2019 & 2032
- Table 65: Global Lead Acid Battery Market Revenue Million Forecast, by Country 2019 & 2032
- Table 66: Global Lead Acid Battery Market Volume K Unit Forecast, by Country 2019 & 2032
- Table 67: United States Lead Acid Battery Market Revenue (Million) Forecast, by Application 2019 & 2032
- Table 68: United States Lead Acid Battery Market Volume (K Unit) Forecast, by Application 2019 & 2032
- Table 69: Canada Lead Acid Battery Market Revenue (Million) Forecast, by Application 2019 & 2032
- Table 70: Canada Lead Acid Battery Market Volume (K Unit) Forecast, by Application 2019 & 2032
- Table 71: Rest of North America Lead Acid Battery Market Revenue (Million) Forecast, by Application 2019 & 2032
- Table 72: Rest of North America Lead Acid Battery Market Volume (K Unit) Forecast, by Application 2019 & 2032
- Table 73: Global Lead Acid Battery Market Revenue Million Forecast, by Application 2019 & 2032
- Table 74: Global Lead Acid Battery Market Volume K Unit Forecast, by Application 2019 & 2032
- Table 75: Global Lead Acid Battery Market Revenue Million Forecast, by Technology 2019 & 2032
- Table 76: Global Lead Acid Battery Market Volume K Unit Forecast, by Technology 2019 & 2032
- Table 77: Global Lead Acid Battery Market Revenue Million Forecast, by Country 2019 & 2032
- Table 78: Global Lead Acid Battery Market Volume K Unit Forecast, by Country 2019 & 2032
- Table 79: Germany Lead Acid Battery Market Revenue (Million) Forecast, by Application 2019 & 2032
- Table 80: Germany Lead Acid Battery Market Volume (K Unit) Forecast, by Application 2019 & 2032
- Table 81: France Lead Acid Battery Market Revenue (Million) Forecast, by Application 2019 & 2032
- Table 82: France Lead Acid Battery Market Volume (K Unit) Forecast, by Application 2019 & 2032
- Table 83: Italy Lead Acid Battery Market Revenue (Million) Forecast, by Application 2019 & 2032
- Table 84: Italy Lead Acid Battery Market Volume (K Unit) Forecast, by Application 2019 & 2032
- Table 85: United Kingdom Lead Acid Battery Market Revenue (Million) Forecast, by Application 2019 & 2032
- Table 86: United Kingdom Lead Acid Battery Market Volume (K Unit) Forecast, by Application 2019 & 2032
- Table 87: Russian Federation Lead Acid Battery Market Revenue (Million) Forecast, by Application 2019 & 2032
- Table 88: Russian Federation Lead Acid Battery Market Volume (K Unit) Forecast, by Application 2019 & 2032
- Table 89: Rest of Europe Lead Acid Battery Market Revenue (Million) Forecast, by Application 2019 & 2032
- Table 90: Rest of Europe Lead Acid Battery Market Volume (K Unit) Forecast, by Application 2019 & 2032
- Table 91: Global Lead Acid Battery Market Revenue Million Forecast, by Application 2019 & 2032
- Table 92: Global Lead Acid Battery Market Volume K Unit Forecast, by Application 2019 & 2032
- Table 93: Global Lead Acid Battery Market Revenue Million Forecast, by Technology 2019 & 2032
- Table 94: Global Lead Acid Battery Market Volume K Unit Forecast, by Technology 2019 & 2032
- Table 95: Global Lead Acid Battery Market Revenue Million Forecast, by Country 2019 & 2032
- Table 96: Global Lead Acid Battery Market Volume K Unit Forecast, by Country 2019 & 2032
- Table 97: China Lead Acid Battery Market Revenue (Million) Forecast, by Application 2019 & 2032
- Table 98: China Lead Acid Battery Market Volume (K Unit) Forecast, by Application 2019 & 2032
- Table 99: India Lead Acid Battery Market Revenue (Million) Forecast, by Application 2019 & 2032
- Table 100: India Lead Acid Battery Market Volume (K Unit) Forecast, by Application 2019 & 2032
- Table 101: Japan Lead Acid Battery Market Revenue (Million) Forecast, by Application 2019 & 2032
- Table 102: Japan Lead Acid Battery Market Volume (K Unit) Forecast, by Application 2019 & 2032
- Table 103: South Korea Lead Acid Battery Market Revenue (Million) Forecast, by Application 2019 & 2032
- Table 104: South Korea Lead Acid Battery Market Volume (K Unit) Forecast, by Application 2019 & 2032
- Table 105: Rest of Asia Pacific Lead Acid Battery Market Revenue (Million) Forecast, by Application 2019 & 2032
- Table 106: Rest of Asia Pacific Lead Acid Battery Market Volume (K Unit) Forecast, by Application 2019 & 2032
- Table 107: Global Lead Acid Battery Market Revenue Million Forecast, by Application 2019 & 2032
- Table 108: Global Lead Acid Battery Market Volume K Unit Forecast, by Application 2019 & 2032
- Table 109: Global Lead Acid Battery Market Revenue Million Forecast, by Technology 2019 & 2032
- Table 110: Global Lead Acid Battery Market Volume K Unit Forecast, by Technology 2019 & 2032
- Table 111: Global Lead Acid Battery Market Revenue Million Forecast, by Country 2019 & 2032
- Table 112: Global Lead Acid Battery Market Volume K Unit Forecast, by Country 2019 & 2032
- Table 113: Saudi Arabia Lead Acid Battery Market Revenue (Million) Forecast, by Application 2019 & 2032
- Table 114: Saudi Arabia Lead Acid Battery Market Volume (K Unit) Forecast, by Application 2019 & 2032
- Table 115: United Arab Emirates Lead Acid Battery Market Revenue (Million) Forecast, by Application 2019 & 2032
- Table 116: United Arab Emirates Lead Acid Battery Market Volume (K Unit) Forecast, by Application 2019 & 2032
- Table 117: South Africa Lead Acid Battery Market Revenue (Million) Forecast, by Application 2019 & 2032
- Table 118: South Africa Lead Acid Battery Market Volume (K Unit) Forecast, by Application 2019 & 2032
- Table 119: Rest of Middle East and Africa Lead Acid Battery Market Revenue (Million) Forecast, by Application 2019 & 2032
- Table 120: Rest of Middle East and Africa Lead Acid Battery Market Volume (K Unit) Forecast, by Application 2019 & 2032
- Table 121: Global Lead Acid Battery Market Revenue Million Forecast, by Application 2019 & 2032
- Table 122: Global Lead Acid Battery Market Volume K Unit Forecast, by Application 2019 & 2032
- Table 123: Global Lead Acid Battery Market Revenue Million Forecast, by Technology 2019 & 2032
- Table 124: Global Lead Acid Battery Market Volume K Unit Forecast, by Technology 2019 & 2032
- Table 125: Global Lead Acid Battery Market Revenue Million Forecast, by Country 2019 & 2032
- Table 126: Global Lead Acid Battery Market Volume K Unit Forecast, by Country 2019 & 2032
- Table 127: Brazil Lead Acid Battery Market Revenue (Million) Forecast, by Application 2019 & 2032
- Table 128: Brazil Lead Acid Battery Market Volume (K Unit) Forecast, by Application 2019 & 2032
- Table 129: Argentina Lead Acid Battery Market Revenue (Million) Forecast, by Application 2019 & 2032
- Table 130: Argentina Lead Acid Battery Market Volume (K Unit) Forecast, by Application 2019 & 2032
- Table 131: Rest of South America Lead Acid Battery Market Revenue (Million) Forecast, by Application 2019 & 2032
- Table 132: Rest of South America Lead Acid Battery Market Volume (K Unit) Forecast, by Application 2019 & 2032
Frequently Asked Questions
1. What is the projected Compound Annual Growth Rate (CAGR) of the Lead Acid Battery Market?
The projected CAGR is approximately 4.40%.
2. Which companies are prominent players in the Lead Acid Battery Market?
Key companies in the market include EnerSys, Johnson Controls International PLC, Leoch International Technology Limited, Amara Raja Batteries Ltd, Panasonic Corporation, East Penn Manufacturing Co, C&D Technologies Inc, GS Yuasa Corporation, Exide Technologies Inc.
3. What are the main segments of the Lead Acid Battery Market?
The market segments include Application, Technology.
4. Can you provide details about the market size?
The market size is estimated to be USD 47.29 Million as of 2022.
5. What are some drivers contributing to market growth?
Presence of Stringent Regulation for Air Quality Management.
6. What are the notable trends driving market growth?
SLI Battery Segment to Dominate the Market.
7. Are there any restraints impacting market growth?
High Capital is Required for the Installation of an Air Quality Control System.
8. Can you provide examples of recent developments in the market?
October 2022: BAE USA's stationary lead-acid battery energy storage system got certified for the third edition of ANSI/CAN/UL 1973. A US testing, inspection, and certification company, UL Solutions, certified the ESS's capability.
9. What pricing options are available for accessing the report?
Pricing options include single-user, multi-user, and enterprise licenses priced at USD 4750, USD 5250, and USD 8750 respectively.
10. Is the market size provided in terms of value or volume?
The market size is provided in terms of value, measured in Million and volume, measured in K Unit.
11. Are there any specific market keywords associated with the report?
Yes, the market keyword associated with the report is "Lead Acid Battery Market," which aids in identifying and referencing the specific market segment covered.
12. How do I determine which pricing option suits my needs best?
The pricing options vary based on user requirements and access needs. Individual users may opt for single-user licenses, while businesses requiring broader access may choose multi-user or enterprise licenses for cost-effective access to the report.
13. Are there any additional resources or data provided in the Lead Acid Battery Market report?
While the report offers comprehensive insights, it's advisable to review the specific contents or supplementary materials provided to ascertain if additional resources or data are available.
14. How can I stay updated on further developments or reports in the Lead Acid Battery Market?
To stay informed about further developments, trends, and reports in the Lead Acid Battery Market, consider subscribing to industry newsletters, following relevant companies and organizations, or regularly checking reputable industry news sources and publications.
Methodology
Step 1 - Identification of Relevant Samples Size from Population Database


Step 2 - Approaches for Defining Global Market Size (Value, Volume* & Price*)

Note*: In applicable scenarios
Step 3 - Data Sources
Primary Research
- Web Analytics
- Survey Reports
- Research Institute
- Latest Research Reports
- Opinion Leaders
Secondary Research
- Annual Reports
- White Paper
- Latest Press Release
- Industry Association
- Paid Database
- Investor Presentations

Step 4 - Data Triangulation
Involves using different sources of information in order to increase the validity of a study
These sources are likely to be stakeholders in a program - participants, other researchers, program staff, other community members, and so on.
Then we put all data in single framework & apply various statistical tools to find out the dynamic on the market.
During the analysis stage, feedback from the stakeholder groups would be compared to determine areas of agreement as well as areas of divergence


