
Key Insights
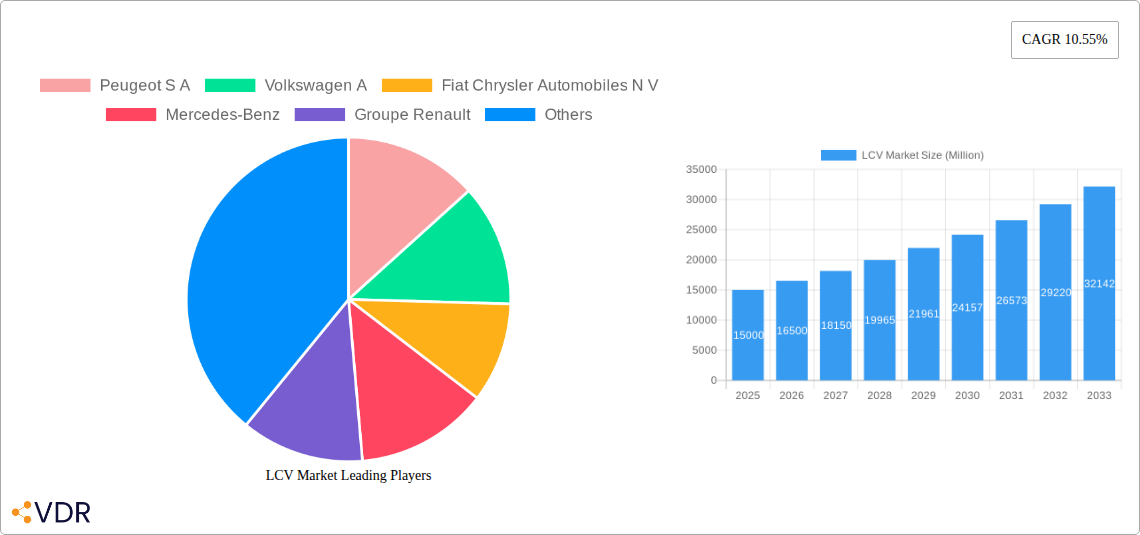
The European Light Commercial Vehicle (LCV) market, encompassing countries like Germany, France, the UK, and others, is experiencing robust growth, projected to maintain a Compound Annual Growth Rate (CAGR) of 10.55% from 2025 to 2033. This expansion is driven by several key factors. The rising e-commerce sector fuels demand for efficient last-mile delivery solutions, boosting LCV sales. Furthermore, advancements in hybrid and electric propulsion systems are making LCVs more environmentally friendly and cost-effective in the long run, attracting environmentally conscious businesses. Government incentives and regulations promoting sustainable transportation further contribute to market growth. While the market faces challenges like supply chain disruptions and fluctuating fuel prices, the overall outlook remains positive, particularly for vehicles incorporating alternative fuel technologies like LPG and electric powertrains. The market segmentation reveals strong performance in countries with well-developed logistics networks and robust economies. Leading manufacturers like Volkswagen, Peugeot, and Mercedes-Benz are actively investing in research and development to cater to evolving customer needs and maintain their market share in this competitive landscape. The growing popularity of commercial vehicles optimized for specific applications, such as refrigerated transport or specialized cargo handling, also contributes to market diversification and growth.
The segment dominated by hybrid and electric LCVs is expected to witness the most significant growth during the forecast period, driven by increasing environmental concerns and governmental regulations. The market share of countries like Germany, France, and the UK is substantial, reflecting their developed economies and large logistics sectors. However, emerging markets within Europe are also showcasing promising growth potential. Competition amongst established automotive manufacturers is fierce, with continuous innovation in vehicle technology, fleet management solutions, and after-sales services playing a crucial role in securing market share. The forecast for the next decade suggests a continued upward trajectory, with the market size expected to substantially increase, driven by factors including technological advancements, changing consumer preferences, and a supportive regulatory environment.
Light Commercial Vehicle (LCV) Market: A Comprehensive Report (2019-2033)
This in-depth report provides a comprehensive analysis of the Light Commercial Vehicle (LCV) market, encompassing market dynamics, growth trends, regional performance, product landscapes, and key player strategies across Europe. The study period covers 2019-2033, with a focus on the base year 2025 and a forecast period of 2025-2033. The report leverages extensive primary and secondary research to deliver actionable insights for industry professionals. Key segments analyzed include Hybrid and Electric Vehicles, LPG, and Commercial Vehicles across Austria, Belgium, Czech Republic, Denmark, Estonia, France, Germany, Ireland, Italy, Latvia, Lithuania, Norway, Poland, Russia, Spain, Sweden, UK, and Rest-of-Europe. Major players such as Peugeot S A, Volkswagen A, Fiat Chrysler Automobiles N V, Mercedes-Benz, Groupe Renault, Toyota Motor Corporation, and Ford Motor Company are profiled. The total market size in 2025 is estimated at xx Million Units.
LCV Market Market Dynamics & Structure
The European LCV market is characterized by moderate concentration, with a few major players holding significant market share. Technological innovation, particularly in electric and hybrid propulsion systems, is a key driver, alongside stringent regulatory frameworks promoting fuel efficiency and emission reduction. LPG vehicles offer a transitional alternative, while increasing competition from alternative transportation solutions such as cargo bikes and drones present challenges. The market is influenced by end-user demographics, with a growing demand from e-commerce and last-mile delivery services. The M&A landscape has witnessed moderate activity in recent years, driven by strategic partnerships and expansion efforts.
- Market Concentration: The top 5 players hold approximately xx% of the market share in 2025.
- Technological Innovation: Electric and hybrid LCVs are witnessing rapid growth, driven by government incentives and environmental concerns.
- Regulatory Framework: Stringent emission standards and fuel efficiency regulations are shaping the market landscape.
- Competitive Substitutes: Alternative transportation solutions, such as cargo bikes and drones, are emerging as competitors.
- M&A Activity: Approximately xx M&A deals related to LCVs were recorded between 2019 and 2024.
LCV Market Growth Trends & Insights
The European LCV market experienced [mention the growth trend, e.g., steady growth] between 2019 and 2024. The market size is projected to reach xx Million Units by 2033, exhibiting a CAGR of xx% during the forecast period. The adoption rate of electric and hybrid LCVs is accelerating, driven by technological advancements, decreasing battery costs, and supportive government policies. Consumer behavior is shifting towards fuel-efficient and environmentally friendly vehicles, further boosting market growth. Technological disruptions, such as autonomous driving features and connected vehicle technologies, are also shaping the market. The increasing demand for last-mile delivery services and the growth of e-commerce are key factors driving market expansion.

Dominant Regions, Countries, or Segments in LCV Market
Western European countries like Germany, France, and the UK remain dominant in the LCV market, driven by robust economies, well-developed infrastructure, and high vehicle ownership rates. The demand for commercial vehicles in these regions is spurred by the thriving logistics and transportation sectors. Hybrid and electric vehicle adoption is higher in countries with strong government support and favorable environmental policies, such as Norway and the Netherlands. LPG vehicles are more prevalent in regions with readily available infrastructure and competitive pricing.
- Key Drivers: Strong economies, well-developed infrastructure, supportive government policies, and increasing demand from logistics and delivery sectors.
- Germany: Holds the largest market share in Europe, attributed to its strong manufacturing sector and robust logistics network. xx Million units in 2025.
- France: Second largest market, benefiting from a robust automotive industry and substantial government investments in electric vehicle infrastructure. xx Million units in 2025.
- UK: Significant market size propelled by a large transportation sector and continuous investment in fleet modernization. xx Million units in 2025.
LCV Market Product Landscape
The LCV market offers a diverse range of products catering to varying needs, including vans, pickups, and specialized commercial vehicles. Recent innovations focus on enhancing fuel efficiency, improving cargo capacity, and integrating advanced technologies such as telematics and driver-assistance systems. The adoption of hybrid and electric powertrains is rapidly transforming the product landscape. Key selling propositions include enhanced fuel economy, reduced emissions, and improved safety features. Technological advancements in areas like battery technology, charging infrastructure, and autonomous driving systems are pivotal to future growth.
Key Drivers, Barriers & Challenges in LCV Market
Key Drivers: Increasing demand from e-commerce and logistics, government incentives promoting electric vehicles, and advancements in battery technology are propelling market growth. Stringent emission regulations are also pushing the adoption of cleaner vehicles.
Key Challenges: High upfront costs of electric and hybrid LCVs, limited charging infrastructure in certain regions, and supply chain disruptions pose significant challenges. Competition from alternative transportation solutions and regulatory uncertainty also create barriers. The impact of these challenges is estimated to constrain market growth by approximately xx% in 2025.
Emerging Opportunities in LCV Market
Emerging opportunities include the growth of the last-mile delivery market, increasing adoption of connected vehicle technologies, and the potential for autonomous driving in LCVs. Untapped markets in Eastern Europe present significant growth potential. Innovative applications, such as specialized LCVs for specific industries (e.g., refrigerated delivery vans), also offer attractive opportunities. The shift towards subscription models for LCVs is gaining traction, presenting new business models.
Growth Accelerators in the LCV Market Industry
Technological breakthroughs in battery technology and charging infrastructure are crucial catalysts for market growth. Strategic partnerships between automotive manufacturers and technology providers are accelerating the development and deployment of innovative LCV solutions. Expanding into new markets and offering customized solutions for niche industries further fuels market expansion.
Key Players Shaping the LCV Market Market
- Peugeot S A
- Volkswagen A
- Fiat Chrysler Automobiles N V
- Mercedes-Benz
- Groupe Renault
- Toyota Motor Corporation
- Ford Motor Company
Notable Milestones in LCV Market Sector
- May 2023: Mercedes Benz Vans launches its electric small van, eCitan, for inner-city deliveries.
- June 2023: FORD NEXT launches a pilot program providing flexible electric vehicle leasing options for Uber drivers in select U.S. markets.
- June 2023: Mercedes-Benz expands the availability of its DRIVE PILOT Level 3 autonomous driving system to California.
In-Depth LCV Market Market Outlook
The future of the LCV market is promising, driven by sustained demand from the logistics and e-commerce sectors, alongside technological innovations in electric and autonomous driving technologies. Strategic partnerships and investments in charging infrastructure will play a pivotal role in accelerating market growth. Expanding into emerging markets and offering customized solutions will be key for players seeking to capture significant market share in the years to come. The market is poised for significant expansion, with the potential to reach xx Million Units by 2033.
LCV Market Segmentation
-
1. Vehicle Type
-
1.1. Commercial Vehicles
- 1.1.1. Light Commercial Pick-up Trucks
- 1.1.2. Light Commercial Vans
-
1.1. Commercial Vehicles
-
2. Propulsion Type
-
2.1. Hybrid and Electric Vehicles
-
2.1.1. By Fuel Category
- 2.1.1.1. BEV
- 2.1.1.2. FCEV
- 2.1.1.3. HEV
- 2.1.1.4. PHEV
-
2.1.1. By Fuel Category
-
2.2. ICE
- 2.2.1. CNG
- 2.2.2. Diesel
- 2.2.3. Gasoline
- 2.2.4. LPG
-
2.1. Hybrid and Electric Vehicles
LCV Market Segmentation By Geography
-
1. North America
- 1.1. United States
- 1.2. Canada
- 1.3. Mexico
-
2. South America
- 2.1. Brazil
- 2.2. Argentina
- 2.3. Rest of South America
-
3. Europe
- 3.1. United Kingdom
- 3.2. Germany
- 3.3. France
- 3.4. Italy
- 3.5. Spain
- 3.6. Russia
- 3.7. Benelux
- 3.8. Nordics
- 3.9. Rest of Europe
-
4. Middle East & Africa
- 4.1. Turkey
- 4.2. Israel
- 4.3. GCC
- 4.4. North Africa
- 4.5. South Africa
- 4.6. Rest of Middle East & Africa
-
5. Asia Pacific
- 5.1. China
- 5.2. India
- 5.3. Japan
- 5.4. South Korea
- 5.5. ASEAN
- 5.6. Oceania
- 5.7. Rest of Asia Pacific

LCV Market REPORT HIGHLIGHTS
| Aspects | Details |
|---|---|
| Study Period | 2019-2033 |
| Base Year | 2024 |
| Estimated Year | 2025 |
| Forecast Period | 2025-2033 |
| Historical Period | 2019-2024 |
| Growth Rate | CAGR of 10.55% from 2019-2033 |
| Segmentation |
|
Table of Contents
- 1. Introduction
- 1.1. Research Scope
- 1.2. Market Segmentation
- 1.3. Research Methodology
- 1.4. Definitions and Assumptions
- 2. Executive Summary
- 2.1. Introduction
- 3. Market Dynamics
- 3.1. Introduction
- 3.2. Market Drivers
- 3.2.1. Growing Travel and Tourism Industry is Driving the Car Rental Market
- 3.3. Market Restrains
- 3.3.1. Increasing Popularity of Ride-Sharing Services Pose Challenges for the Conventional Car Rental Market
- 3.4. Market Trends
- 3.4.1. OTHER KEY INDUSTRY TRENDS COVERED IN THE REPORT
- 4. Market Factor Analysis
- 4.1. Porters Five Forces
- 4.2. Supply/Value Chain
- 4.3. PESTEL analysis
- 4.4. Market Entropy
- 4.5. Patent/Trademark Analysis
- 5. Global LCV Market Analysis, Insights and Forecast, 2019-2031
- 5.1. Market Analysis, Insights and Forecast - by Vehicle Type
- 5.1.1. Commercial Vehicles
- 5.1.1.1. Light Commercial Pick-up Trucks
- 5.1.1.2. Light Commercial Vans
- 5.1.1. Commercial Vehicles
- 5.2. Market Analysis, Insights and Forecast - by Propulsion Type
- 5.2.1. Hybrid and Electric Vehicles
- 5.2.1.1. By Fuel Category
- 5.2.1.1.1. BEV
- 5.2.1.1.2. FCEV
- 5.2.1.1.3. HEV
- 5.2.1.1.4. PHEV
- 5.2.1.1. By Fuel Category
- 5.2.2. ICE
- 5.2.2.1. CNG
- 5.2.2.2. Diesel
- 5.2.2.3. Gasoline
- 5.2.2.4. LPG
- 5.2.1. Hybrid and Electric Vehicles
- 5.3. Market Analysis, Insights and Forecast - by Region
- 5.3.1. North America
- 5.3.2. South America
- 5.3.3. Europe
- 5.3.4. Middle East & Africa
- 5.3.5. Asia Pacific
- 5.1. Market Analysis, Insights and Forecast - by Vehicle Type
- 6. North America LCV Market Analysis, Insights and Forecast, 2019-2031
- 6.1. Market Analysis, Insights and Forecast - by Vehicle Type
- 6.1.1. Commercial Vehicles
- 6.1.1.1. Light Commercial Pick-up Trucks
- 6.1.1.2. Light Commercial Vans
- 6.1.1. Commercial Vehicles
- 6.2. Market Analysis, Insights and Forecast - by Propulsion Type
- 6.2.1. Hybrid and Electric Vehicles
- 6.2.1.1. By Fuel Category
- 6.2.1.1.1. BEV
- 6.2.1.1.2. FCEV
- 6.2.1.1.3. HEV
- 6.2.1.1.4. PHEV
- 6.2.1.1. By Fuel Category
- 6.2.2. ICE
- 6.2.2.1. CNG
- 6.2.2.2. Diesel
- 6.2.2.3. Gasoline
- 6.2.2.4. LPG
- 6.2.1. Hybrid and Electric Vehicles
- 6.1. Market Analysis, Insights and Forecast - by Vehicle Type
- 7. South America LCV Market Analysis, Insights and Forecast, 2019-2031
- 7.1. Market Analysis, Insights and Forecast - by Vehicle Type
- 7.1.1. Commercial Vehicles
- 7.1.1.1. Light Commercial Pick-up Trucks
- 7.1.1.2. Light Commercial Vans
- 7.1.1. Commercial Vehicles
- 7.2. Market Analysis, Insights and Forecast - by Propulsion Type
- 7.2.1. Hybrid and Electric Vehicles
- 7.2.1.1. By Fuel Category
- 7.2.1.1.1. BEV
- 7.2.1.1.2. FCEV
- 7.2.1.1.3. HEV
- 7.2.1.1.4. PHEV
- 7.2.1.1. By Fuel Category
- 7.2.2. ICE
- 7.2.2.1. CNG
- 7.2.2.2. Diesel
- 7.2.2.3. Gasoline
- 7.2.2.4. LPG
- 7.2.1. Hybrid and Electric Vehicles
- 7.1. Market Analysis, Insights and Forecast - by Vehicle Type
- 8. Europe LCV Market Analysis, Insights and Forecast, 2019-2031
- 8.1. Market Analysis, Insights and Forecast - by Vehicle Type
- 8.1.1. Commercial Vehicles
- 8.1.1.1. Light Commercial Pick-up Trucks
- 8.1.1.2. Light Commercial Vans
- 8.1.1. Commercial Vehicles
- 8.2. Market Analysis, Insights and Forecast - by Propulsion Type
- 8.2.1. Hybrid and Electric Vehicles
- 8.2.1.1. By Fuel Category
- 8.2.1.1.1. BEV
- 8.2.1.1.2. FCEV
- 8.2.1.1.3. HEV
- 8.2.1.1.4. PHEV
- 8.2.1.1. By Fuel Category
- 8.2.2. ICE
- 8.2.2.1. CNG
- 8.2.2.2. Diesel
- 8.2.2.3. Gasoline
- 8.2.2.4. LPG
- 8.2.1. Hybrid and Electric Vehicles
- 8.1. Market Analysis, Insights and Forecast - by Vehicle Type
- 9. Middle East & Africa LCV Market Analysis, Insights and Forecast, 2019-2031
- 9.1. Market Analysis, Insights and Forecast - by Vehicle Type
- 9.1.1. Commercial Vehicles
- 9.1.1.1. Light Commercial Pick-up Trucks
- 9.1.1.2. Light Commercial Vans
- 9.1.1. Commercial Vehicles
- 9.2. Market Analysis, Insights and Forecast - by Propulsion Type
- 9.2.1. Hybrid and Electric Vehicles
- 9.2.1.1. By Fuel Category
- 9.2.1.1.1. BEV
- 9.2.1.1.2. FCEV
- 9.2.1.1.3. HEV
- 9.2.1.1.4. PHEV
- 9.2.1.1. By Fuel Category
- 9.2.2. ICE
- 9.2.2.1. CNG
- 9.2.2.2. Diesel
- 9.2.2.3. Gasoline
- 9.2.2.4. LPG
- 9.2.1. Hybrid and Electric Vehicles
- 9.1. Market Analysis, Insights and Forecast - by Vehicle Type
- 10. Asia Pacific LCV Market Analysis, Insights and Forecast, 2019-2031
- 10.1. Market Analysis, Insights and Forecast - by Vehicle Type
- 10.1.1. Commercial Vehicles
- 10.1.1.1. Light Commercial Pick-up Trucks
- 10.1.1.2. Light Commercial Vans
- 10.1.1. Commercial Vehicles
- 10.2. Market Analysis, Insights and Forecast - by Propulsion Type
- 10.2.1. Hybrid and Electric Vehicles
- 10.2.1.1. By Fuel Category
- 10.2.1.1.1. BEV
- 10.2.1.1.2. FCEV
- 10.2.1.1.3. HEV
- 10.2.1.1.4. PHEV
- 10.2.1.1. By Fuel Category
- 10.2.2. ICE
- 10.2.2.1. CNG
- 10.2.2.2. Diesel
- 10.2.2.3. Gasoline
- 10.2.2.4. LPG
- 10.2.1. Hybrid and Electric Vehicles
- 10.1. Market Analysis, Insights and Forecast - by Vehicle Type
- 11. Competitive Analysis
- 11.1. Global Market Share Analysis 2024
- 11.2. Company Profiles
- 11.2.1 Peugeot S A
- 11.2.1.1. Overview
- 11.2.1.2. Products
- 11.2.1.3. SWOT Analysis
- 11.2.1.4. Recent Developments
- 11.2.1.5. Financials (Based on Availability)
- 11.2.2 Volkswagen A
- 11.2.2.1. Overview
- 11.2.2.2. Products
- 11.2.2.3. SWOT Analysis
- 11.2.2.4. Recent Developments
- 11.2.2.5. Financials (Based on Availability)
- 11.2.3 Fiat Chrysler Automobiles N V
- 11.2.3.1. Overview
- 11.2.3.2. Products
- 11.2.3.3. SWOT Analysis
- 11.2.3.4. Recent Developments
- 11.2.3.5. Financials (Based on Availability)
- 11.2.4 Mercedes-Benz
- 11.2.4.1. Overview
- 11.2.4.2. Products
- 11.2.4.3. SWOT Analysis
- 11.2.4.4. Recent Developments
- 11.2.4.5. Financials (Based on Availability)
- 11.2.5 Groupe Renault
- 11.2.5.1. Overview
- 11.2.5.2. Products
- 11.2.5.3. SWOT Analysis
- 11.2.5.4. Recent Developments
- 11.2.5.5. Financials (Based on Availability)
- 11.2.6 Toyota Motor Corporation
- 11.2.6.1. Overview
- 11.2.6.2. Products
- 11.2.6.3. SWOT Analysis
- 11.2.6.4. Recent Developments
- 11.2.6.5. Financials (Based on Availability)
- 11.2.7 Ford Motor Company
- 11.2.7.1. Overview
- 11.2.7.2. Products
- 11.2.7.3. SWOT Analysis
- 11.2.7.4. Recent Developments
- 11.2.7.5. Financials (Based on Availability)
- 11.2.1 Peugeot S A
List of Figures
- Figure 1: Global LCV Market Revenue Breakdown (Million, %) by Region 2024 & 2032
- Figure 2: North America LCV Market Revenue (Million), by Vehicle Type 2024 & 2032
- Figure 3: North America LCV Market Revenue Share (%), by Vehicle Type 2024 & 2032
- Figure 4: North America LCV Market Revenue (Million), by Propulsion Type 2024 & 2032
- Figure 5: North America LCV Market Revenue Share (%), by Propulsion Type 2024 & 2032
- Figure 6: North America LCV Market Revenue (Million), by Country 2024 & 2032
- Figure 7: North America LCV Market Revenue Share (%), by Country 2024 & 2032
- Figure 8: South America LCV Market Revenue (Million), by Vehicle Type 2024 & 2032
- Figure 9: South America LCV Market Revenue Share (%), by Vehicle Type 2024 & 2032
- Figure 10: South America LCV Market Revenue (Million), by Propulsion Type 2024 & 2032
- Figure 11: South America LCV Market Revenue Share (%), by Propulsion Type 2024 & 2032
- Figure 12: South America LCV Market Revenue (Million), by Country 2024 & 2032
- Figure 13: South America LCV Market Revenue Share (%), by Country 2024 & 2032
- Figure 14: Europe LCV Market Revenue (Million), by Vehicle Type 2024 & 2032
- Figure 15: Europe LCV Market Revenue Share (%), by Vehicle Type 2024 & 2032
- Figure 16: Europe LCV Market Revenue (Million), by Propulsion Type 2024 & 2032
- Figure 17: Europe LCV Market Revenue Share (%), by Propulsion Type 2024 & 2032
- Figure 18: Europe LCV Market Revenue (Million), by Country 2024 & 2032
- Figure 19: Europe LCV Market Revenue Share (%), by Country 2024 & 2032
- Figure 20: Middle East & Africa LCV Market Revenue (Million), by Vehicle Type 2024 & 2032
- Figure 21: Middle East & Africa LCV Market Revenue Share (%), by Vehicle Type 2024 & 2032
- Figure 22: Middle East & Africa LCV Market Revenue (Million), by Propulsion Type 2024 & 2032
- Figure 23: Middle East & Africa LCV Market Revenue Share (%), by Propulsion Type 2024 & 2032
- Figure 24: Middle East & Africa LCV Market Revenue (Million), by Country 2024 & 2032
- Figure 25: Middle East & Africa LCV Market Revenue Share (%), by Country 2024 & 2032
- Figure 26: Asia Pacific LCV Market Revenue (Million), by Vehicle Type 2024 & 2032
- Figure 27: Asia Pacific LCV Market Revenue Share (%), by Vehicle Type 2024 & 2032
- Figure 28: Asia Pacific LCV Market Revenue (Million), by Propulsion Type 2024 & 2032
- Figure 29: Asia Pacific LCV Market Revenue Share (%), by Propulsion Type 2024 & 2032
- Figure 30: Asia Pacific LCV Market Revenue (Million), by Country 2024 & 2032
- Figure 31: Asia Pacific LCV Market Revenue Share (%), by Country 2024 & 2032
List of Tables
- Table 1: Global LCV Market Revenue Million Forecast, by Region 2019 & 2032
- Table 2: Global LCV Market Revenue Million Forecast, by Vehicle Type 2019 & 2032
- Table 3: Global LCV Market Revenue Million Forecast, by Propulsion Type 2019 & 2032
- Table 4: Global LCV Market Revenue Million Forecast, by Region 2019 & 2032
- Table 5: Global LCV Market Revenue Million Forecast, by Vehicle Type 2019 & 2032
- Table 6: Global LCV Market Revenue Million Forecast, by Propulsion Type 2019 & 2032
- Table 7: Global LCV Market Revenue Million Forecast, by Country 2019 & 2032
- Table 8: United States LCV Market Revenue (Million) Forecast, by Application 2019 & 2032
- Table 9: Canada LCV Market Revenue (Million) Forecast, by Application 2019 & 2032
- Table 10: Mexico LCV Market Revenue (Million) Forecast, by Application 2019 & 2032
- Table 11: Global LCV Market Revenue Million Forecast, by Vehicle Type 2019 & 2032
- Table 12: Global LCV Market Revenue Million Forecast, by Propulsion Type 2019 & 2032
- Table 13: Global LCV Market Revenue Million Forecast, by Country 2019 & 2032
- Table 14: Brazil LCV Market Revenue (Million) Forecast, by Application 2019 & 2032
- Table 15: Argentina LCV Market Revenue (Million) Forecast, by Application 2019 & 2032
- Table 16: Rest of South America LCV Market Revenue (Million) Forecast, by Application 2019 & 2032
- Table 17: Global LCV Market Revenue Million Forecast, by Vehicle Type 2019 & 2032
- Table 18: Global LCV Market Revenue Million Forecast, by Propulsion Type 2019 & 2032
- Table 19: Global LCV Market Revenue Million Forecast, by Country 2019 & 2032
- Table 20: United Kingdom LCV Market Revenue (Million) Forecast, by Application 2019 & 2032
- Table 21: Germany LCV Market Revenue (Million) Forecast, by Application 2019 & 2032
- Table 22: France LCV Market Revenue (Million) Forecast, by Application 2019 & 2032
- Table 23: Italy LCV Market Revenue (Million) Forecast, by Application 2019 & 2032
- Table 24: Spain LCV Market Revenue (Million) Forecast, by Application 2019 & 2032
- Table 25: Russia LCV Market Revenue (Million) Forecast, by Application 2019 & 2032
- Table 26: Benelux LCV Market Revenue (Million) Forecast, by Application 2019 & 2032
- Table 27: Nordics LCV Market Revenue (Million) Forecast, by Application 2019 & 2032
- Table 28: Rest of Europe LCV Market Revenue (Million) Forecast, by Application 2019 & 2032
- Table 29: Global LCV Market Revenue Million Forecast, by Vehicle Type 2019 & 2032
- Table 30: Global LCV Market Revenue Million Forecast, by Propulsion Type 2019 & 2032
- Table 31: Global LCV Market Revenue Million Forecast, by Country 2019 & 2032
- Table 32: Turkey LCV Market Revenue (Million) Forecast, by Application 2019 & 2032
- Table 33: Israel LCV Market Revenue (Million) Forecast, by Application 2019 & 2032
- Table 34: GCC LCV Market Revenue (Million) Forecast, by Application 2019 & 2032
- Table 35: North Africa LCV Market Revenue (Million) Forecast, by Application 2019 & 2032
- Table 36: South Africa LCV Market Revenue (Million) Forecast, by Application 2019 & 2032
- Table 37: Rest of Middle East & Africa LCV Market Revenue (Million) Forecast, by Application 2019 & 2032
- Table 38: Global LCV Market Revenue Million Forecast, by Vehicle Type 2019 & 2032
- Table 39: Global LCV Market Revenue Million Forecast, by Propulsion Type 2019 & 2032
- Table 40: Global LCV Market Revenue Million Forecast, by Country 2019 & 2032
- Table 41: China LCV Market Revenue (Million) Forecast, by Application 2019 & 2032
- Table 42: India LCV Market Revenue (Million) Forecast, by Application 2019 & 2032
- Table 43: Japan LCV Market Revenue (Million) Forecast, by Application 2019 & 2032
- Table 44: South Korea LCV Market Revenue (Million) Forecast, by Application 2019 & 2032
- Table 45: ASEAN LCV Market Revenue (Million) Forecast, by Application 2019 & 2032
- Table 46: Oceania LCV Market Revenue (Million) Forecast, by Application 2019 & 2032
- Table 47: Rest of Asia Pacific LCV Market Revenue (Million) Forecast, by Application 2019 & 2032
Frequently Asked Questions
1. What is the projected Compound Annual Growth Rate (CAGR) of the LCV Market?
The projected CAGR is approximately 10.55%.
2. Which companies are prominent players in the LCV Market?
Key companies in the market include Peugeot S A, Volkswagen A, Fiat Chrysler Automobiles N V, Mercedes-Benz, Groupe Renault, Toyota Motor Corporation, Ford Motor Company.
3. What are the main segments of the LCV Market?
The market segments include Vehicle Type, Propulsion Type.
4. Can you provide details about the market size?
The market size is estimated to be USD XX Million as of 2022.
5. What are some drivers contributing to market growth?
Growing Travel and Tourism Industry is Driving the Car Rental Market.
6. What are the notable trends driving market growth?
OTHER KEY INDUSTRY TRENDS COVERED IN THE REPORT.
7. Are there any restraints impacting market growth?
Increasing Popularity of Ride-Sharing Services Pose Challenges for the Conventional Car Rental Market.
8. Can you provide examples of recent developments in the market?
June 2023: FORD NEXT launches New pilot program creates flexible electric solutions for drivers who use the Uber platform in select U.S. markets, allowing them to lease a vehicle for more customized time periods.June 2023: Mercedes-Benz DRIVE PILOT expands U.S. availability to California and introduce a SAE Level 3 system in a standard-production vehicle for use on public freeways in the most populous state in the U.S.May 2023: Mercedes Benz Vans is launching its electric small van for innercity deliveries and servicing operations. eCitan is a vehicle panel with 2 options such as the compact version of 4498 mm and 5922 mm.
9. What pricing options are available for accessing the report?
Pricing options include single-user, multi-user, and enterprise licenses priced at USD 3800, USD 4500, and USD 5800 respectively.
10. Is the market size provided in terms of value or volume?
The market size is provided in terms of value, measured in Million.
11. Are there any specific market keywords associated with the report?
Yes, the market keyword associated with the report is "LCV Market," which aids in identifying and referencing the specific market segment covered.
12. How do I determine which pricing option suits my needs best?
The pricing options vary based on user requirements and access needs. Individual users may opt for single-user licenses, while businesses requiring broader access may choose multi-user or enterprise licenses for cost-effective access to the report.
13. Are there any additional resources or data provided in the LCV Market report?
While the report offers comprehensive insights, it's advisable to review the specific contents or supplementary materials provided to ascertain if additional resources or data are available.
14. How can I stay updated on further developments or reports in the LCV Market?
To stay informed about further developments, trends, and reports in the LCV Market, consider subscribing to industry newsletters, following relevant companies and organizations, or regularly checking reputable industry news sources and publications.
Methodology
Step 1 - Identification of Relevant Samples Size from Population Database


Step 2 - Approaches for Defining Global Market Size (Value, Volume* & Price*)

Note*: In applicable scenarios
Step 3 - Data Sources
Primary Research
- Web Analytics
- Survey Reports
- Research Institute
- Latest Research Reports
- Opinion Leaders
Secondary Research
- Annual Reports
- White Paper
- Latest Press Release
- Industry Association
- Paid Database
- Investor Presentations

Step 4 - Data Triangulation
Involves using different sources of information in order to increase the validity of a study
These sources are likely to be stakeholders in a program - participants, other researchers, program staff, other community members, and so on.
Then we put all data in single framework & apply various statistical tools to find out the dynamic on the market.
During the analysis stage, feedback from the stakeholder groups would be compared to determine areas of agreement as well as areas of divergence


