
Key Insights
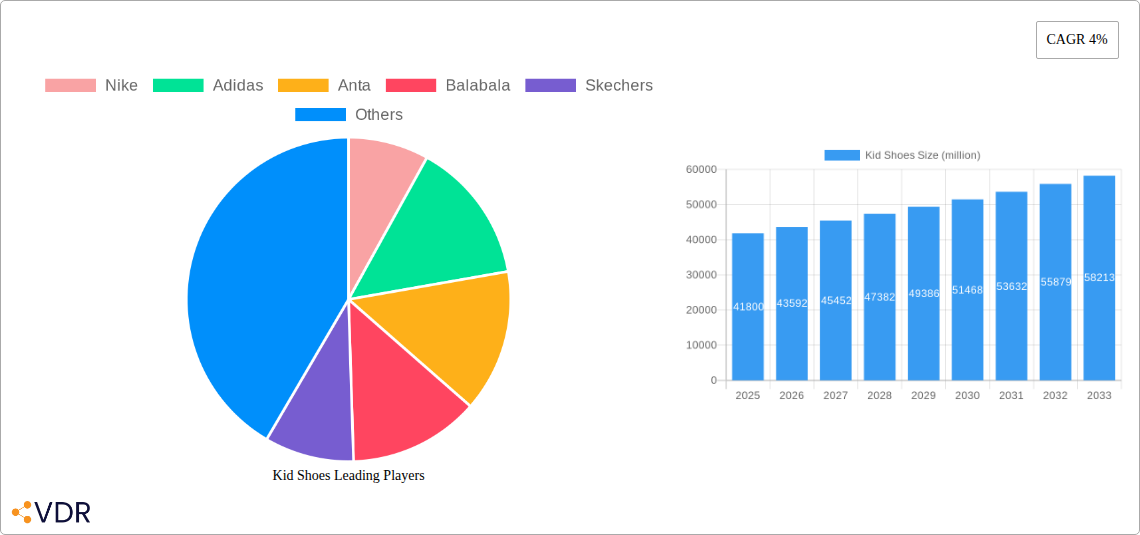
The global kid's shoe market, valued at $41.8 billion in 2025, is projected to experience steady growth, driven by factors such as rising disposable incomes in developing economies, increasing awareness of children's foot health, and the growing popularity of athletic and lifestyle footwear among children. The market's Compound Annual Growth Rate (CAGR) of 4% from 2025 to 2033 indicates a consistent expansion, although the rate might fluctuate based on macroeconomic conditions and evolving consumer preferences. Key players like Nike, Adidas, and Anta are leveraging brand recognition and innovative designs to maintain their market share, while emerging brands like Balabala and 361° are gaining traction through competitive pricing and targeted marketing strategies. The market is segmented by various factors including shoe type (sneakers, sandals, boots), material (leather, synthetic), price point, and distribution channels (online, retail stores). Growth is expected to be fueled by parents' increasing willingness to spend on high-quality, comfortable, and stylish footwear for their children, as well as the rising trend of specialized footwear designed for specific activities like running, sports, and casual wear.
The competitive landscape is dynamic, with established international brands facing competition from both domestic and international players. Success in this market requires a keen understanding of evolving children's preferences, adapting to technological advancements in shoe design and manufacturing, and effectively managing supply chains. While potential restraints include economic downturns affecting consumer spending and fluctuations in raw material prices, the overall outlook for the kid's shoe market remains positive, driven by consistent population growth and a long-term focus on children's well-being and comfort. Regional variations in growth will likely be influenced by factors like economic development, cultural trends, and government policies related to children's health and education. The market is anticipated to witness a rise in e-commerce penetration, requiring brands to strengthen their online presence and optimize their digital marketing strategies.
Kid Shoes Market Report: 2019-2033 - A Comprehensive Analysis for Parents and Industry Professionals
This comprehensive report provides an in-depth analysis of the global Kid Shoes market, offering invaluable insights for parents seeking the best footwear for their children and industry professionals strategizing for future growth. The report covers the period 2019-2033, with a focus on 2025 (base and estimated year) and forecasts extending to 2033. Market values are presented in million units.
Kid Shoes Market Dynamics & Structure
The global kid shoes market, valued at xx million units in 2024, exhibits a moderately concentrated structure with key players like Nike, Adidas, and Anta holding significant market share. Technological innovation, particularly in materials science (e.g., breathable fabrics, enhanced cushioning) and manufacturing processes (e.g., 3D printing), are key drivers. Stringent safety and quality regulations, varying across regions, significantly influence market dynamics. Competitive substitutes, such as sandals and casual footwear, also impact market growth. End-user demographics, primarily focused on children aged 0-14, dictate design and functionality trends. The market has witnessed several M&A activities in recent years, with xx deals valued at approximately xx million units recorded between 2019 and 2024.
- Market Concentration: High, with top 5 players holding approximately 60% market share in 2024.
- Technological Innovation: Focus on sustainable materials and enhanced comfort features.
- Regulatory Framework: Stringent safety standards vary by region, impacting manufacturing costs.
- Competitive Substitutes: Growing popularity of casual footwear poses a challenge.
- M&A Activity: xx deals between 2019-2024, totaling approximately xx million units in value.
- Innovation Barriers: High R&D costs and stringent safety regulations.
Kid Shoes Growth Trends & Insights
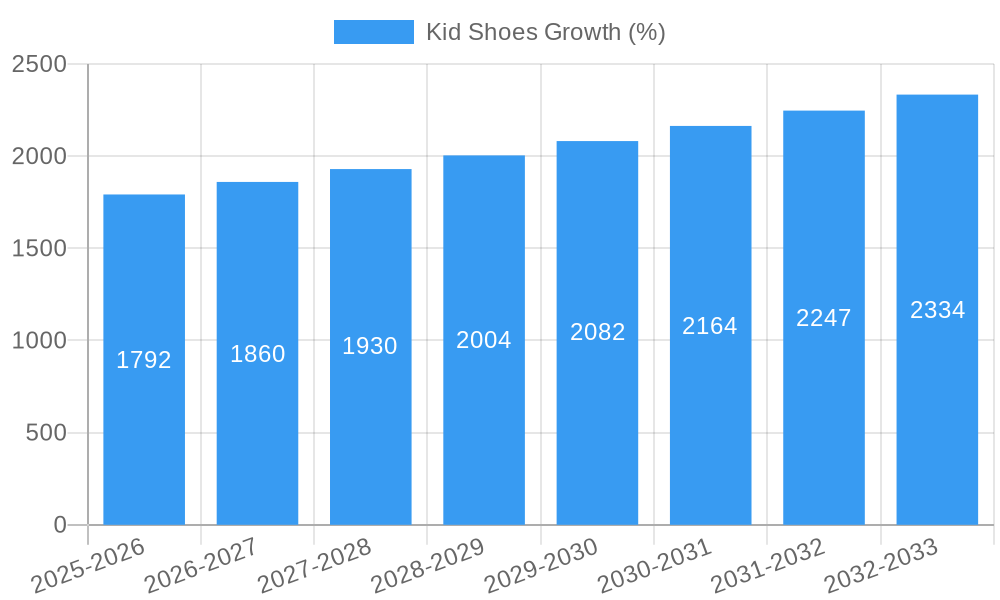
The kid shoes market experienced robust growth during the historical period (2019-2024), driven by rising disposable incomes, increasing awareness of children's foot health, and expanding e-commerce penetration. The market is expected to maintain a healthy CAGR of xx% during the forecast period (2025-2033), reaching xx million units by 2033. Technological disruptions, such as the introduction of smart insoles and personalized footwear designs, are contributing to market expansion. Consumer behavior is shifting towards prioritizing comfort, durability, and sustainable materials. Market penetration in developing economies remains significant growth opportunity.
Dominant Regions, Countries, or Segments in Kid Shoes
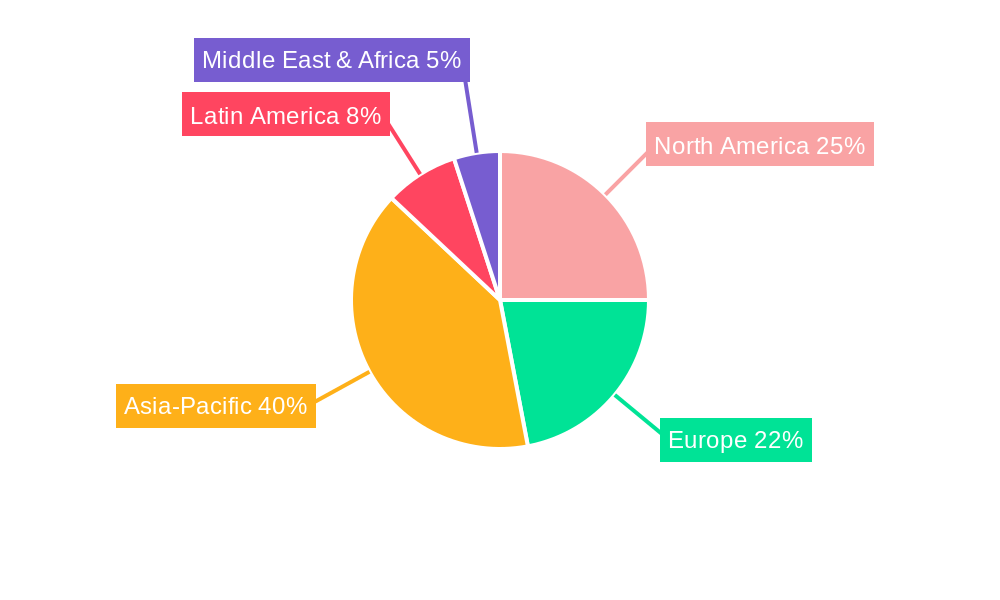
The Asia-Pacific region dominates the global kid shoes market, driven by high population density, rising middle-class incomes, and increasing demand for branded footwear. China and India are leading national markets within this region. The athletic segment holds the largest market share, followed by casual and formal footwear.
- Key Drivers (Asia-Pacific): Rapid economic growth, increasing disposable incomes, and a large child population.
- Dominance Factors: High demand for both athletic and casual footwear. Significant market share held by domestic and international brands.
- Growth Potential: Untapped markets in rural areas of developing economies.
Kid Shoes Product Landscape
Kid shoes are increasingly incorporating advanced materials like breathable mesh, shock-absorbing midsoles, and durable outsoles. Innovative designs focus on ergonomic support and adjustable fit. Key performance metrics include comfort, durability, and style. Unique selling propositions include specialized designs for specific activities (e.g., running, sports) and sustainable manufacturing processes.
Key Drivers, Barriers & Challenges in Kid Shoes
Key Drivers: Rising disposable incomes in emerging markets, growing awareness of children's foot health, increasing preference for branded footwear, and technological advancements in materials and design.
Key Challenges: Fluctuating raw material prices, stringent environmental regulations, intense competition, and potential supply chain disruptions due to geopolitical instability. These challenges could impact profit margins by approximately xx% by 2030.
Emerging Opportunities in Kid Shoes
Emerging opportunities lie in personalized footwear design using 3D scanning technology, expansion into untapped markets in Africa and Latin America, and increased focus on sustainable and ethically sourced materials. The growing interest in smart shoes that track activity and foot health also presents lucrative opportunities.
Growth Accelerators in the Kid Shoes Industry
Strategic partnerships between footwear brands and technology companies, expansion into omnichannel distribution models, and investments in sustainable manufacturing practices are crucial growth catalysts. Technological breakthroughs in materials science and manufacturing processes will continue to drive innovation and market expansion.
Key Players Shaping the Kid Shoes Market
- Nike
- Adidas
- Anta
- Balabala
- Skechers
- Syunsoku
- Warrior
- XTEP
- 361°
- Bobdog
- Crtartu
- New Balance
- ABC KIDS
- Dr. Kong
- Smipou
- Ginoble
- Red Dragonfly Footwear
Notable Milestones in Kid Shoes Sector
- 2020: Increased adoption of e-commerce channels by major players.
- 2021: Launch of several sustainable footwear lines by leading brands.
- 2022: Significant investments in R&D for innovative materials and designs.
- 2023: Several mergers and acquisitions within the industry consolidating market share.
In-Depth Kid Shoes Market Outlook
The kid shoes market is poised for sustained growth, driven by ongoing technological advancements, increasing consumer demand for comfort and durability, and the expansion into new markets. Strategic investments in research and development, sustainable manufacturing, and omnichannel distribution will be crucial for long-term success. The market is projected to reach xx million units by 2033, presenting significant opportunities for both established players and new entrants.
Kid Shoes Segmentation
-
1. Application
- 1.1. 6-14 Years Old
- 1.2. 3-6 Years Old
- 1.3. Under 3 Years Old
-
2. Types
- 2.1. Sports Shoes
- 2.2. Casual Shoes
- 2.3. Kids Sandals
- 2.4. Toddler Shoes
- 2.5. Others
Kid Shoes Segmentation By Geography
-
1. North America
- 1.1. United States
- 1.2. Canada
- 1.3. Mexico
-
2. South America
- 2.1. Brazil
- 2.2. Argentina
- 2.3. Rest of South America
-
3. Europe
- 3.1. United Kingdom
- 3.2. Germany
- 3.3. France
- 3.4. Italy
- 3.5. Spain
- 3.6. Russia
- 3.7. Benelux
- 3.8. Nordics
- 3.9. Rest of Europe
-
4. Middle East & Africa
- 4.1. Turkey
- 4.2. Israel
- 4.3. GCC
- 4.4. North Africa
- 4.5. South Africa
- 4.6. Rest of Middle East & Africa
-
5. Asia Pacific
- 5.1. China
- 5.2. India
- 5.3. Japan
- 5.4. South Korea
- 5.5. ASEAN
- 5.6. Oceania
- 5.7. Rest of Asia Pacific
Kid Shoes REPORT HIGHLIGHTS
| Aspects | Details |
|---|---|
| Study Period | 2019-2033 |
| Base Year | 2024 |
| Estimated Year | 2025 |
| Forecast Period | 2025-2033 |
| Historical Period | 2019-2024 |
| Growth Rate | CAGR of 4% from 2019-2033 |
| Segmentation |
|
Table of Contents
- 1. Introduction
- 1.1. Research Scope
- 1.2. Market Segmentation
- 1.3. Research Methodology
- 1.4. Definitions and Assumptions
- 2. Executive Summary
- 2.1. Introduction
- 3. Market Dynamics
- 3.1. Introduction
- 3.2. Market Drivers
- 3.3. Market Restrains
- 3.4. Market Trends
- 4. Market Factor Analysis
- 4.1. Porters Five Forces
- 4.2. Supply/Value Chain
- 4.3. PESTEL analysis
- 4.4. Market Entropy
- 4.5. Patent/Trademark Analysis
- 5. Global Kid Shoes Analysis, Insights and Forecast, 2019-2031
- 5.1. Market Analysis, Insights and Forecast - by Application
- 5.1.1. 6-14 Years Old
- 5.1.2. 3-6 Years Old
- 5.1.3. Under 3 Years Old
- 5.2. Market Analysis, Insights and Forecast - by Types
- 5.2.1. Sports Shoes
- 5.2.2. Casual Shoes
- 5.2.3. Kids Sandals
- 5.2.4. Toddler Shoes
- 5.2.5. Others
- 5.3. Market Analysis, Insights and Forecast - by Region
- 5.3.1. North America
- 5.3.2. South America
- 5.3.3. Europe
- 5.3.4. Middle East & Africa
- 5.3.5. Asia Pacific
- 5.1. Market Analysis, Insights and Forecast - by Application
- 6. North America Kid Shoes Analysis, Insights and Forecast, 2019-2031
- 6.1. Market Analysis, Insights and Forecast - by Application
- 6.1.1. 6-14 Years Old
- 6.1.2. 3-6 Years Old
- 6.1.3. Under 3 Years Old
- 6.2. Market Analysis, Insights and Forecast - by Types
- 6.2.1. Sports Shoes
- 6.2.2. Casual Shoes
- 6.2.3. Kids Sandals
- 6.2.4. Toddler Shoes
- 6.2.5. Others
- 6.1. Market Analysis, Insights and Forecast - by Application
- 7. South America Kid Shoes Analysis, Insights and Forecast, 2019-2031
- 7.1. Market Analysis, Insights and Forecast - by Application
- 7.1.1. 6-14 Years Old
- 7.1.2. 3-6 Years Old
- 7.1.3. Under 3 Years Old
- 7.2. Market Analysis, Insights and Forecast - by Types
- 7.2.1. Sports Shoes
- 7.2.2. Casual Shoes
- 7.2.3. Kids Sandals
- 7.2.4. Toddler Shoes
- 7.2.5. Others
- 7.1. Market Analysis, Insights and Forecast - by Application
- 8. Europe Kid Shoes Analysis, Insights and Forecast, 2019-2031
- 8.1. Market Analysis, Insights and Forecast - by Application
- 8.1.1. 6-14 Years Old
- 8.1.2. 3-6 Years Old
- 8.1.3. Under 3 Years Old
- 8.2. Market Analysis, Insights and Forecast - by Types
- 8.2.1. Sports Shoes
- 8.2.2. Casual Shoes
- 8.2.3. Kids Sandals
- 8.2.4. Toddler Shoes
- 8.2.5. Others
- 8.1. Market Analysis, Insights and Forecast - by Application
- 9. Middle East & Africa Kid Shoes Analysis, Insights and Forecast, 2019-2031
- 9.1. Market Analysis, Insights and Forecast - by Application
- 9.1.1. 6-14 Years Old
- 9.1.2. 3-6 Years Old
- 9.1.3. Under 3 Years Old
- 9.2. Market Analysis, Insights and Forecast - by Types
- 9.2.1. Sports Shoes
- 9.2.2. Casual Shoes
- 9.2.3. Kids Sandals
- 9.2.4. Toddler Shoes
- 9.2.5. Others
- 9.1. Market Analysis, Insights and Forecast - by Application
- 10. Asia Pacific Kid Shoes Analysis, Insights and Forecast, 2019-2031
- 10.1. Market Analysis, Insights and Forecast - by Application
- 10.1.1. 6-14 Years Old
- 10.1.2. 3-6 Years Old
- 10.1.3. Under 3 Years Old
- 10.2. Market Analysis, Insights and Forecast - by Types
- 10.2.1. Sports Shoes
- 10.2.2. Casual Shoes
- 10.2.3. Kids Sandals
- 10.2.4. Toddler Shoes
- 10.2.5. Others
- 10.1. Market Analysis, Insights and Forecast - by Application
- 11. Competitive Analysis
- 11.1. Global Market Share Analysis 2024
- 11.2. Company Profiles
- 11.2.1 Nike
- 11.2.1.1. Overview
- 11.2.1.2. Products
- 11.2.1.3. SWOT Analysis
- 11.2.1.4. Recent Developments
- 11.2.1.5. Financials (Based on Availability)
- 11.2.2 Adidas
- 11.2.2.1. Overview
- 11.2.2.2. Products
- 11.2.2.3. SWOT Analysis
- 11.2.2.4. Recent Developments
- 11.2.2.5. Financials (Based on Availability)
- 11.2.3 Anta
- 11.2.3.1. Overview
- 11.2.3.2. Products
- 11.2.3.3. SWOT Analysis
- 11.2.3.4. Recent Developments
- 11.2.3.5. Financials (Based on Availability)
- 11.2.4 Balabala
- 11.2.4.1. Overview
- 11.2.4.2. Products
- 11.2.4.3. SWOT Analysis
- 11.2.4.4. Recent Developments
- 11.2.4.5. Financials (Based on Availability)
- 11.2.5 Skechers
- 11.2.5.1. Overview
- 11.2.5.2. Products
- 11.2.5.3. SWOT Analysis
- 11.2.5.4. Recent Developments
- 11.2.5.5. Financials (Based on Availability)
- 11.2.6 Syunsoku
- 11.2.6.1. Overview
- 11.2.6.2. Products
- 11.2.6.3. SWOT Analysis
- 11.2.6.4. Recent Developments
- 11.2.6.5. Financials (Based on Availability)
- 11.2.7 Warrior
- 11.2.7.1. Overview
- 11.2.7.2. Products
- 11.2.7.3. SWOT Analysis
- 11.2.7.4. Recent Developments
- 11.2.7.5. Financials (Based on Availability)
- 11.2.8 XTEP
- 11.2.8.1. Overview
- 11.2.8.2. Products
- 11.2.8.3. SWOT Analysis
- 11.2.8.4. Recent Developments
- 11.2.8.5. Financials (Based on Availability)
- 11.2.9 361°
- 11.2.9.1. Overview
- 11.2.9.2. Products
- 11.2.9.3. SWOT Analysis
- 11.2.9.4. Recent Developments
- 11.2.9.5. Financials (Based on Availability)
- 11.2.10 Bobdog
- 11.2.10.1. Overview
- 11.2.10.2. Products
- 11.2.10.3. SWOT Analysis
- 11.2.10.4. Recent Developments
- 11.2.10.5. Financials (Based on Availability)
- 11.2.11 Crtartu
- 11.2.11.1. Overview
- 11.2.11.2. Products
- 11.2.11.3. SWOT Analysis
- 11.2.11.4. Recent Developments
- 11.2.11.5. Financials (Based on Availability)
- 11.2.12 New Balance
- 11.2.12.1. Overview
- 11.2.12.2. Products
- 11.2.12.3. SWOT Analysis
- 11.2.12.4. Recent Developments
- 11.2.12.5. Financials (Based on Availability)
- 11.2.13 ABC KIDS
- 11.2.13.1. Overview
- 11.2.13.2. Products
- 11.2.13.3. SWOT Analysis
- 11.2.13.4. Recent Developments
- 11.2.13.5. Financials (Based on Availability)
- 11.2.14 Dr. Kong
- 11.2.14.1. Overview
- 11.2.14.2. Products
- 11.2.14.3. SWOT Analysis
- 11.2.14.4. Recent Developments
- 11.2.14.5. Financials (Based on Availability)
- 11.2.15 Smipou
- 11.2.15.1. Overview
- 11.2.15.2. Products
- 11.2.15.3. SWOT Analysis
- 11.2.15.4. Recent Developments
- 11.2.15.5. Financials (Based on Availability)
- 11.2.16 Ginoble
- 11.2.16.1. Overview
- 11.2.16.2. Products
- 11.2.16.3. SWOT Analysis
- 11.2.16.4. Recent Developments
- 11.2.16.5. Financials (Based on Availability)
- 11.2.17 Red Dragonfly Footwear
- 11.2.17.1. Overview
- 11.2.17.2. Products
- 11.2.17.3. SWOT Analysis
- 11.2.17.4. Recent Developments
- 11.2.17.5. Financials (Based on Availability)
- 11.2.1 Nike
List of Figures
- Figure 1: Global Kid Shoes Revenue Breakdown (million, %) by Region 2024 & 2032
- Figure 2: North America Kid Shoes Revenue (million), by Application 2024 & 2032
- Figure 3: North America Kid Shoes Revenue Share (%), by Application 2024 & 2032
- Figure 4: North America Kid Shoes Revenue (million), by Types 2024 & 2032
- Figure 5: North America Kid Shoes Revenue Share (%), by Types 2024 & 2032
- Figure 6: North America Kid Shoes Revenue (million), by Country 2024 & 2032
- Figure 7: North America Kid Shoes Revenue Share (%), by Country 2024 & 2032
- Figure 8: South America Kid Shoes Revenue (million), by Application 2024 & 2032
- Figure 9: South America Kid Shoes Revenue Share (%), by Application 2024 & 2032
- Figure 10: South America Kid Shoes Revenue (million), by Types 2024 & 2032
- Figure 11: South America Kid Shoes Revenue Share (%), by Types 2024 & 2032
- Figure 12: South America Kid Shoes Revenue (million), by Country 2024 & 2032
- Figure 13: South America Kid Shoes Revenue Share (%), by Country 2024 & 2032
- Figure 14: Europe Kid Shoes Revenue (million), by Application 2024 & 2032
- Figure 15: Europe Kid Shoes Revenue Share (%), by Application 2024 & 2032
- Figure 16: Europe Kid Shoes Revenue (million), by Types 2024 & 2032
- Figure 17: Europe Kid Shoes Revenue Share (%), by Types 2024 & 2032
- Figure 18: Europe Kid Shoes Revenue (million), by Country 2024 & 2032
- Figure 19: Europe Kid Shoes Revenue Share (%), by Country 2024 & 2032
- Figure 20: Middle East & Africa Kid Shoes Revenue (million), by Application 2024 & 2032
- Figure 21: Middle East & Africa Kid Shoes Revenue Share (%), by Application 2024 & 2032
- Figure 22: Middle East & Africa Kid Shoes Revenue (million), by Types 2024 & 2032
- Figure 23: Middle East & Africa Kid Shoes Revenue Share (%), by Types 2024 & 2032
- Figure 24: Middle East & Africa Kid Shoes Revenue (million), by Country 2024 & 2032
- Figure 25: Middle East & Africa Kid Shoes Revenue Share (%), by Country 2024 & 2032
- Figure 26: Asia Pacific Kid Shoes Revenue (million), by Application 2024 & 2032
- Figure 27: Asia Pacific Kid Shoes Revenue Share (%), by Application 2024 & 2032
- Figure 28: Asia Pacific Kid Shoes Revenue (million), by Types 2024 & 2032
- Figure 29: Asia Pacific Kid Shoes Revenue Share (%), by Types 2024 & 2032
- Figure 30: Asia Pacific Kid Shoes Revenue (million), by Country 2024 & 2032
- Figure 31: Asia Pacific Kid Shoes Revenue Share (%), by Country 2024 & 2032
List of Tables
- Table 1: Global Kid Shoes Revenue million Forecast, by Region 2019 & 2032
- Table 2: Global Kid Shoes Revenue million Forecast, by Application 2019 & 2032
- Table 3: Global Kid Shoes Revenue million Forecast, by Types 2019 & 2032
- Table 4: Global Kid Shoes Revenue million Forecast, by Region 2019 & 2032
- Table 5: Global Kid Shoes Revenue million Forecast, by Application 2019 & 2032
- Table 6: Global Kid Shoes Revenue million Forecast, by Types 2019 & 2032
- Table 7: Global Kid Shoes Revenue million Forecast, by Country 2019 & 2032
- Table 8: United States Kid Shoes Revenue (million) Forecast, by Application 2019 & 2032
- Table 9: Canada Kid Shoes Revenue (million) Forecast, by Application 2019 & 2032
- Table 10: Mexico Kid Shoes Revenue (million) Forecast, by Application 2019 & 2032
- Table 11: Global Kid Shoes Revenue million Forecast, by Application 2019 & 2032
- Table 12: Global Kid Shoes Revenue million Forecast, by Types 2019 & 2032
- Table 13: Global Kid Shoes Revenue million Forecast, by Country 2019 & 2032
- Table 14: Brazil Kid Shoes Revenue (million) Forecast, by Application 2019 & 2032
- Table 15: Argentina Kid Shoes Revenue (million) Forecast, by Application 2019 & 2032
- Table 16: Rest of South America Kid Shoes Revenue (million) Forecast, by Application 2019 & 2032
- Table 17: Global Kid Shoes Revenue million Forecast, by Application 2019 & 2032
- Table 18: Global Kid Shoes Revenue million Forecast, by Types 2019 & 2032
- Table 19: Global Kid Shoes Revenue million Forecast, by Country 2019 & 2032
- Table 20: United Kingdom Kid Shoes Revenue (million) Forecast, by Application 2019 & 2032
- Table 21: Germany Kid Shoes Revenue (million) Forecast, by Application 2019 & 2032
- Table 22: France Kid Shoes Revenue (million) Forecast, by Application 2019 & 2032
- Table 23: Italy Kid Shoes Revenue (million) Forecast, by Application 2019 & 2032
- Table 24: Spain Kid Shoes Revenue (million) Forecast, by Application 2019 & 2032
- Table 25: Russia Kid Shoes Revenue (million) Forecast, by Application 2019 & 2032
- Table 26: Benelux Kid Shoes Revenue (million) Forecast, by Application 2019 & 2032
- Table 27: Nordics Kid Shoes Revenue (million) Forecast, by Application 2019 & 2032
- Table 28: Rest of Europe Kid Shoes Revenue (million) Forecast, by Application 2019 & 2032
- Table 29: Global Kid Shoes Revenue million Forecast, by Application 2019 & 2032
- Table 30: Global Kid Shoes Revenue million Forecast, by Types 2019 & 2032
- Table 31: Global Kid Shoes Revenue million Forecast, by Country 2019 & 2032
- Table 32: Turkey Kid Shoes Revenue (million) Forecast, by Application 2019 & 2032
- Table 33: Israel Kid Shoes Revenue (million) Forecast, by Application 2019 & 2032
- Table 34: GCC Kid Shoes Revenue (million) Forecast, by Application 2019 & 2032
- Table 35: North Africa Kid Shoes Revenue (million) Forecast, by Application 2019 & 2032
- Table 36: South Africa Kid Shoes Revenue (million) Forecast, by Application 2019 & 2032
- Table 37: Rest of Middle East & Africa Kid Shoes Revenue (million) Forecast, by Application 2019 & 2032
- Table 38: Global Kid Shoes Revenue million Forecast, by Application 2019 & 2032
- Table 39: Global Kid Shoes Revenue million Forecast, by Types 2019 & 2032
- Table 40: Global Kid Shoes Revenue million Forecast, by Country 2019 & 2032
- Table 41: China Kid Shoes Revenue (million) Forecast, by Application 2019 & 2032
- Table 42: India Kid Shoes Revenue (million) Forecast, by Application 2019 & 2032
- Table 43: Japan Kid Shoes Revenue (million) Forecast, by Application 2019 & 2032
- Table 44: South Korea Kid Shoes Revenue (million) Forecast, by Application 2019 & 2032
- Table 45: ASEAN Kid Shoes Revenue (million) Forecast, by Application 2019 & 2032
- Table 46: Oceania Kid Shoes Revenue (million) Forecast, by Application 2019 & 2032
- Table 47: Rest of Asia Pacific Kid Shoes Revenue (million) Forecast, by Application 2019 & 2032
Frequently Asked Questions
1. What is the projected Compound Annual Growth Rate (CAGR) of the Kid Shoes?
The projected CAGR is approximately 4%.
2. Which companies are prominent players in the Kid Shoes?
Key companies in the market include Nike, Adidas, Anta, Balabala, Skechers, Syunsoku, Warrior, XTEP, 361°, Bobdog, Crtartu, New Balance, ABC KIDS, Dr. Kong, Smipou, Ginoble, Red Dragonfly Footwear.
3. What are the main segments of the Kid Shoes?
The market segments include Application, Types.
4. Can you provide details about the market size?
The market size is estimated to be USD 41800 million as of 2022.
5. What are some drivers contributing to market growth?
N/A
6. What are the notable trends driving market growth?
N/A
7. Are there any restraints impacting market growth?
N/A
8. Can you provide examples of recent developments in the market?
N/A
9. What pricing options are available for accessing the report?
Pricing options include single-user, multi-user, and enterprise licenses priced at USD 2900.00, USD 4350.00, and USD 5800.00 respectively.
10. Is the market size provided in terms of value or volume?
The market size is provided in terms of value, measured in million.
11. Are there any specific market keywords associated with the report?
Yes, the market keyword associated with the report is "Kid Shoes," which aids in identifying and referencing the specific market segment covered.
12. How do I determine which pricing option suits my needs best?
The pricing options vary based on user requirements and access needs. Individual users may opt for single-user licenses, while businesses requiring broader access may choose multi-user or enterprise licenses for cost-effective access to the report.
13. Are there any additional resources or data provided in the Kid Shoes report?
While the report offers comprehensive insights, it's advisable to review the specific contents or supplementary materials provided to ascertain if additional resources or data are available.
14. How can I stay updated on further developments or reports in the Kid Shoes?
To stay informed about further developments, trends, and reports in the Kid Shoes, consider subscribing to industry newsletters, following relevant companies and organizations, or regularly checking reputable industry news sources and publications.
Methodology
Step 1 - Identification of Relevant Samples Size from Population Database


Step 2 - Approaches for Defining Global Market Size (Value, Volume* & Price*)

Note*: In applicable scenarios
Step 3 - Data Sources
Primary Research
- Web Analytics
- Survey Reports
- Research Institute
- Latest Research Reports
- Opinion Leaders
Secondary Research
- Annual Reports
- White Paper
- Latest Press Release
- Industry Association
- Paid Database
- Investor Presentations

Step 4 - Data Triangulation
Involves using different sources of information in order to increase the validity of a study
These sources are likely to be stakeholders in a program - participants, other researchers, program staff, other community members, and so on.
Then we put all data in single framework & apply various statistical tools to find out the dynamic on the market.
During the analysis stage, feedback from the stakeholder groups would be compared to determine areas of agreement as well as areas of divergence


