
Key Insights
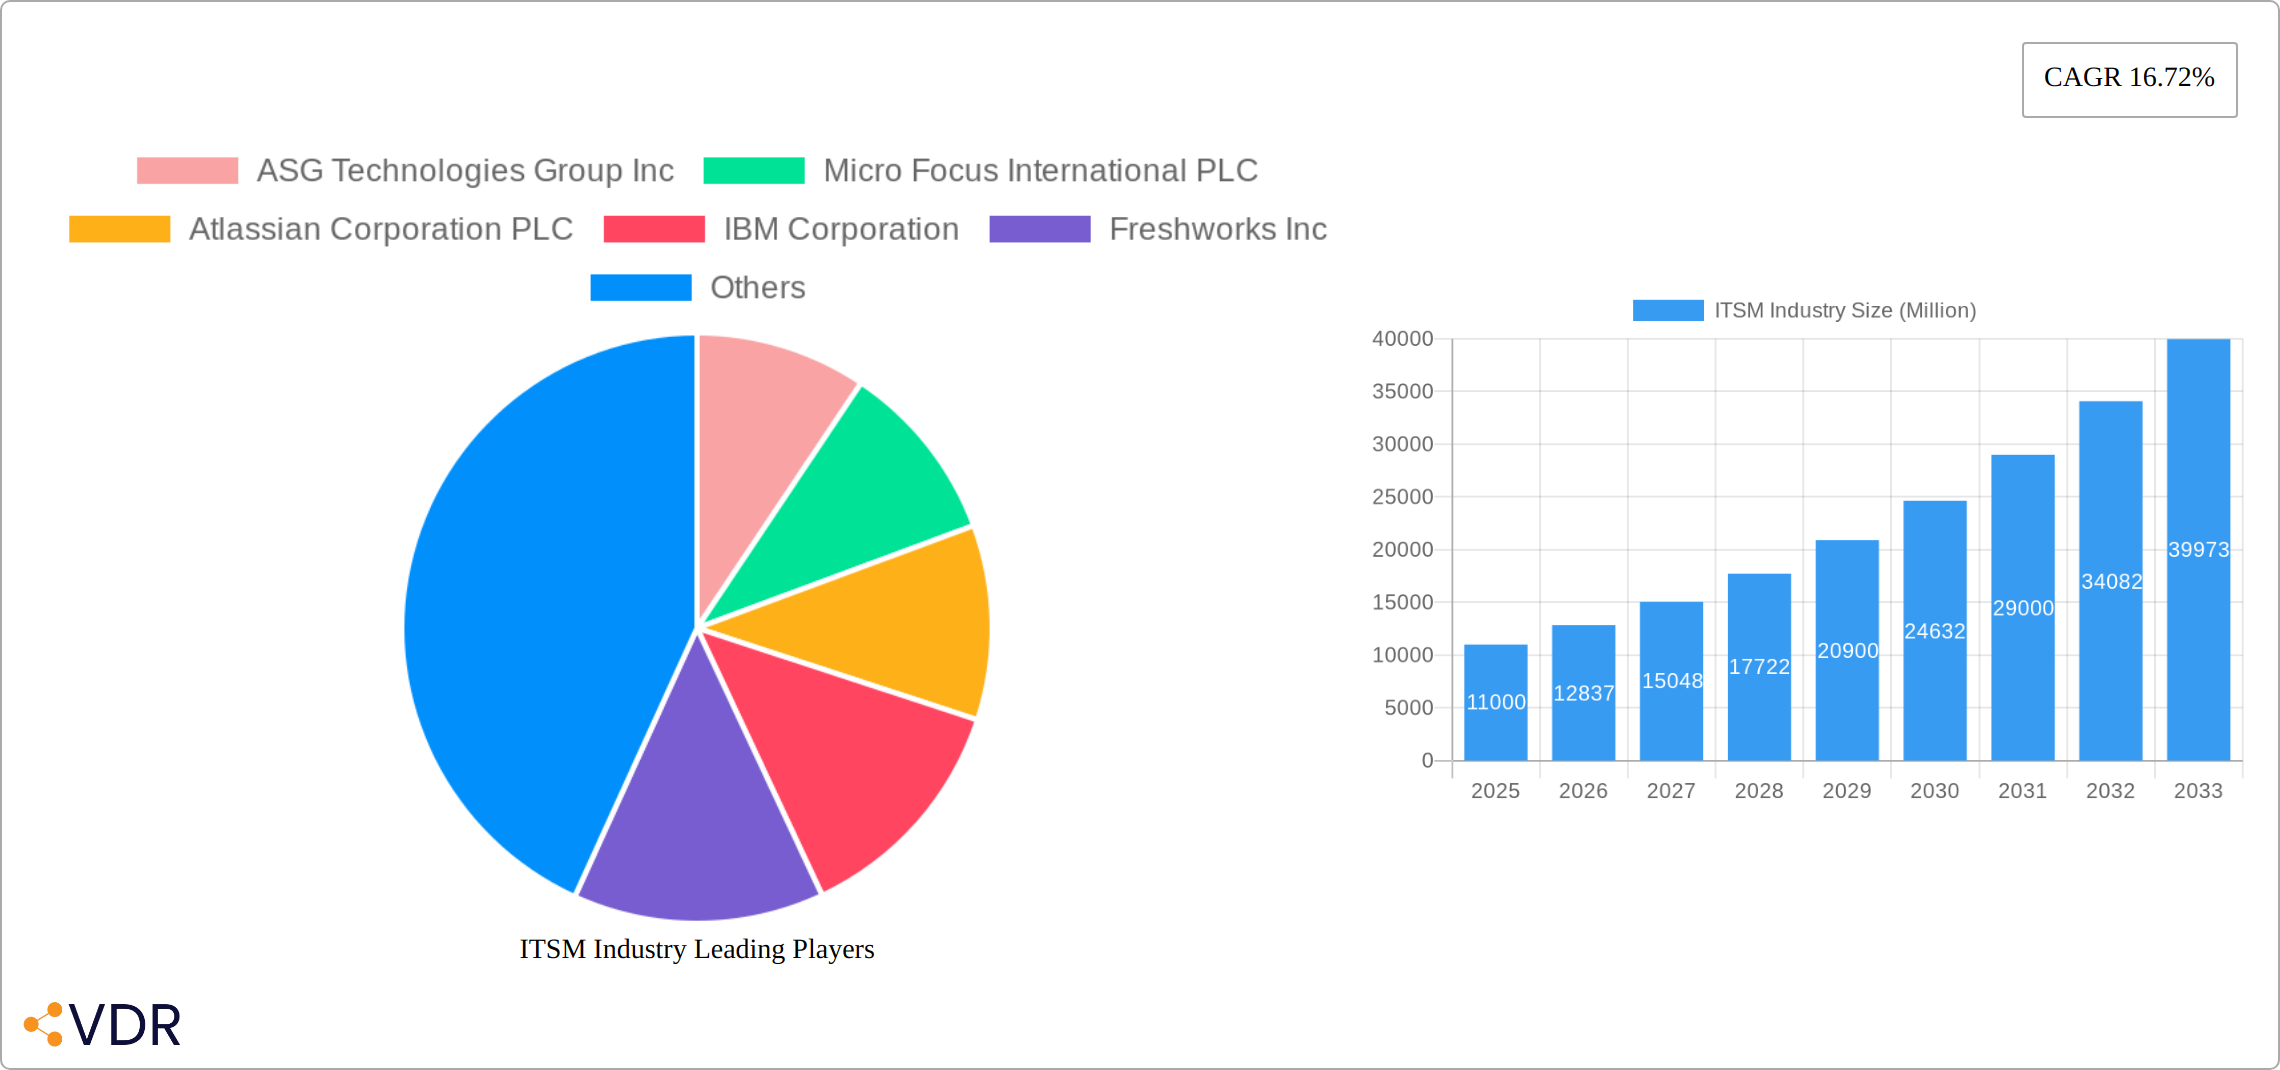
The IT Service Management (ITSM) market is experiencing robust growth, projected to reach a market size of $11 billion in 2025 and exhibiting a Compound Annual Growth Rate (CAGR) of 16.72%. This expansion is driven by several key factors. The increasing adoption of cloud-based solutions is significantly impacting the market, offering scalability, cost-effectiveness, and improved accessibility for businesses of all sizes. Furthermore, the growing complexity of IT infrastructures, coupled with the rising demand for enhanced digital experiences, necessitates robust ITSM solutions for efficient management and problem resolution. The integration of Artificial Intelligence (AI) and Machine Learning (ML) within ITSM platforms is further accelerating growth, enabling predictive analytics, automated incident management, and improved service delivery. Key segments driving growth include Configuration Management, Performance Management, and Network Management, particularly within the BFSI, IT and Telecommunication, and Government and Education sectors. The shift towards cloud deployment models continues to be a dominant trend, while potential restraints include the high initial investment costs associated with implementing comprehensive ITSM systems and the need for skilled IT personnel to effectively manage these systems. The market is highly competitive, with established players like IBM and Micro Focus alongside emerging innovators like Freshworks and ServiceNow vying for market share. Geographical distribution shows North America and Europe currently dominating the market, but the Asia-Pacific region is poised for substantial growth fueled by increasing digitalization and economic expansion.
The forecast period (2025-2033) anticipates continued expansion, propelled by sustained investments in digital transformation across various industries. The ongoing adoption of agile methodologies and DevOps practices is further integrating ITSM into broader organizational strategies. The increasing focus on security and compliance also contributes to market growth, as organizations seek robust ITSM solutions to manage security risks and ensure regulatory compliance. While competition remains intense, the market’s overall trajectory indicates a positive outlook, driven by the fundamental need for efficient and effective IT service management in an increasingly digital world. Differentiation among vendors will likely center on advanced capabilities like AI-powered automation, robust analytics dashboards, and seamless integration with other enterprise systems.
ITSM Industry Market Report: 2019-2033
This comprehensive report provides a detailed analysis of the IT Service Management (ITSM) industry, encompassing market dynamics, growth trends, regional dominance, product landscape, and key players. The study period covers 2019-2033, with 2025 as the base and estimated year. The report utilizes data from both the parent market (IT services) and the child market (ITSM) to offer a holistic view. This report is crucial for businesses, investors, and industry professionals seeking to understand and navigate the evolving ITSM landscape. The market is expected to reach xx Million by 2033.
ITSM Industry Market Dynamics & Structure
The ITSM market is characterized by a moderately concentrated structure, with key players like ServiceNow, IBM, and Micro Focus holding significant market share. However, the market also exhibits a high degree of dynamism, driven by rapid technological innovation, particularly in areas like AI-powered automation and cloud-based solutions. Regulatory frameworks, such as GDPR and CCPA, are influencing data security and compliance requirements within the industry. Competitive product substitutes, including open-source solutions and custom-built systems, exert pressure on established vendors. The end-user demographic is expanding across various sectors, with growing adoption across BFSI, Manufacturing, and Healthcare. M&A activity is significantly shaping the competitive landscape.
- Market Concentration: ServiceNow holds an estimated xx% market share in 2025, followed by IBM (xx%) and Micro Focus (xx%).
- Technological Drivers: AI, automation, cloud computing, and DevOps are driving innovation.
- Regulatory Influence: GDPR and CCPA are impacting data security practices.
- M&A Activity: The past five years have seen xx M&A deals, with an average deal value of xx Million. Examples include the acquisitions of StatusCast by 4me and Gorilla Services BV by Lyvia Group.
- Innovation Barriers: High initial investment costs, integration complexities, and skill gaps represent challenges for new entrants.
ITSM Industry Growth Trends & Insights
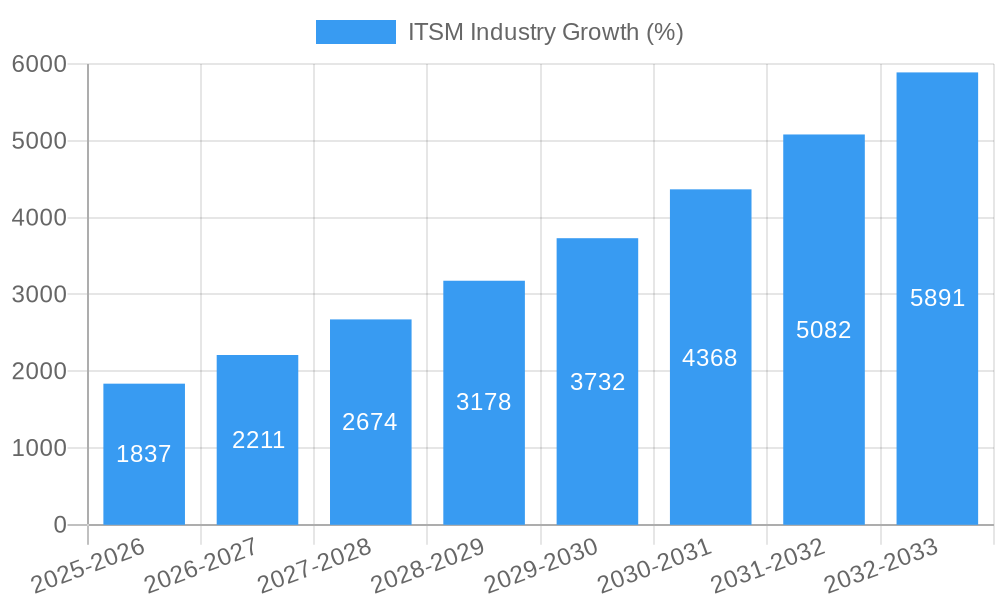
The ITSM market is experiencing robust growth, driven by factors such as increasing digital transformation initiatives, the rising adoption of cloud-based solutions, and growing demand for improved IT service efficiency. From 2019 to 2024, the market witnessed a CAGR of xx%, reaching a value of xx Million in 2024. This growth is projected to continue at a CAGR of xx% during the forecast period (2025-2033), with the market anticipated to reach xx Million by 2033. The increasing adoption of agile methodologies and DevOps practices is further accelerating market expansion. Consumer behavior shifts towards greater reliance on cloud services and SaaS solutions are fueling demand. Technological disruptions like the rise of AIOps (AI for IT Operations) are transforming ITSM capabilities.
Dominant Regions, Countries, or Segments in ITSM Industry
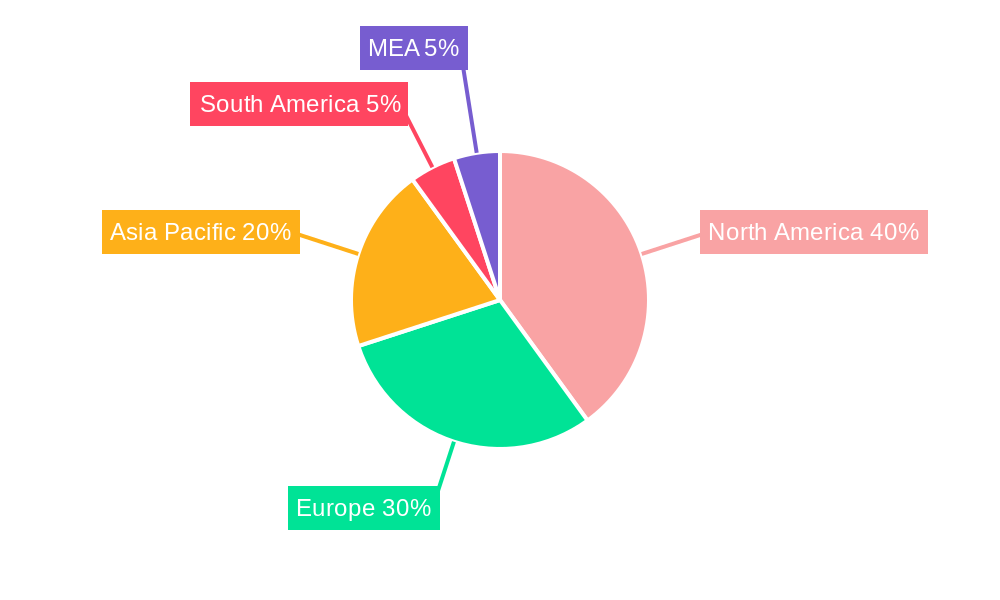
North America currently holds the largest market share in the ITSM industry, driven by high IT spending, robust digital infrastructure, and early adoption of advanced technologies. Within applications, Configuration Management and Performance Management dominate, accounting for a combined xx% of the market in 2025. Among end-user industries, BFSI and IT & Telecommunication are the leading segments, owing to their critical reliance on robust IT infrastructure and services. The Cloud deployment model is witnessing significant traction, as businesses leverage its scalability, cost-effectiveness, and accessibility.
- Leading Region: North America (xx% market share in 2025)
- Leading Application Segment: Configuration Management (xx% in 2025)
- Leading End-user Industry: BFSI (xx% in 2025)
- Leading Deployment Model: Cloud (xx% in 2025)
- Key Growth Drivers: Government investments in IT infrastructure, increasing digitalization across various sectors, and supportive economic policies.
ITSM Industry Product Landscape
The ITSM product landscape is characterized by a wide range of solutions, from basic help desk ticketing systems to sophisticated AI-powered platforms. Vendors are focusing on integrating AI, machine learning, and automation to improve service delivery, enhance self-service capabilities, and provide predictive analytics. Key features include robust reporting and analytics dashboards, seamless integration with other enterprise applications, and personalized user experiences. The emphasis is on improving efficiency, reducing costs, and enhancing overall IT service quality.
Key Drivers, Barriers & Challenges in ITSM Industry
Key Drivers:
- Increased focus on digital transformation across industries.
- Rising demand for improved IT service efficiency and cost optimization.
- Growing adoption of cloud-based solutions and SaaS models.
- Advancements in AI and automation technologies.
Challenges:
- Integration complexities with existing IT infrastructure.
- Lack of skilled personnel to implement and manage advanced ITSM solutions.
- Data security and compliance concerns related to sensitive customer data.
- Competition from open-source and custom-built ITSM solutions. The competitive pressure negatively impacted the market size by xx Million in 2024.
Emerging Opportunities in ITSM Industry
- Expansion into untapped markets in developing economies.
- Integration of ITSM with emerging technologies like IoT and blockchain.
- Growth of AIOps and predictive analytics for proactive IT service management.
- Development of specialized ITSM solutions for niche industries.
Growth Accelerators in the ITSM Industry
Technological breakthroughs, particularly in AI and automation, are significantly driving the growth of the ITSM market. Strategic partnerships between ITSM vendors and other technology providers are expanding market reach and creating innovative solutions. Market expansion strategies, such as entering new geographical regions and targeting underserved industries, are also contributing to growth.
Key Players Shaping the ITSM Industry Market
- ASG Technologies Group Inc
- Micro Focus International PLC
- Atlassian Corporation PLC
- IBM Corporation
- Freshworks Inc
- ServiceNow Inc
- Ivanti Inc
- Broadcom Inc
- BMC Software Inc (Kohlberg Kravis Roberts & Co LP)
- Axios Systems
Notable Milestones in ITSM Industry Sector
- April 2024: 4me acquires StatusCast, strengthening its position in cloud-based incident management.
- February 2024: Lyvia Group acquires Gorilla Services BV, expanding its presence in the Benelux region and boosting its ITSM capabilities.
In-Depth ITSM Industry Market Outlook
The ITSM market is poised for continued growth, driven by the ongoing digital transformation initiatives across various industries and the increasing adoption of cloud-based ITSM solutions. Strategic partnerships and the development of innovative solutions leveraging AI and automation will further propel market expansion. The focus on enhancing service efficiency, improving customer experience, and ensuring data security will create significant opportunities for ITSM vendors in the coming years.
ITSM Industry Segmentation
-
1. Deployment
- 1.1. Cloud
- 1.2. On-premise
-
2. Application
- 2.1. Configuration Management
- 2.2. Performance Management
- 2.3. Network Management
- 2.4. Database Management Systems
- 2.5. Other Applications
-
3. End-user Industry
- 3.1. BFSI
- 3.2. Manufacturing
- 3.3. Government and Education
- 3.4. IT and Telecommunication
- 3.5. Retail
- 3.6. Travel and Hospitality
- 3.7. Healthcare
- 3.8. Other End-user Industries
ITSM Industry Segmentation By Geography
- 1. North America
- 2. Europe
- 3. Asia Pacific
- 4. Latin America
- 5. Middle East and Africa
ITSM Industry REPORT HIGHLIGHTS
| Aspects | Details |
|---|---|
| Study Period | 2019-2033 |
| Base Year | 2024 |
| Estimated Year | 2025 |
| Forecast Period | 2025-2033 |
| Historical Period | 2019-2024 |
| Growth Rate | CAGR of 16.72% from 2019-2033 |
| Segmentation |
|
Table of Contents
- 1. Introduction
- 1.1. Research Scope
- 1.2. Market Segmentation
- 1.3. Research Methodology
- 1.4. Definitions and Assumptions
- 2. Executive Summary
- 2.1. Introduction
- 3. Market Dynamics
- 3.1. Introduction
- 3.2. Market Drivers
- 3.2.1. Rising Adoption of Updated IT Infrastructure Across End-user Industries; Increasing Demand for a Unified Platform to Manage and Monitor IT Infrastructure Performance
- 3.3. Market Restrains
- 3.3.1. Issues in ITSM Implementation and Lack of Quality Standards in Service-level Agreement
- 3.4. Market Trends
- 3.4.1. The IT and Telecommunication Segment is Expected to Hold a Significant Market Share
- 4. Market Factor Analysis
- 4.1. Porters Five Forces
- 4.2. Supply/Value Chain
- 4.3. PESTEL analysis
- 4.4. Market Entropy
- 4.5. Patent/Trademark Analysis
- 5. Global ITSM Industry Analysis, Insights and Forecast, 2019-2031
- 5.1. Market Analysis, Insights and Forecast - by Deployment
- 5.1.1. Cloud
- 5.1.2. On-premise
- 5.2. Market Analysis, Insights and Forecast - by Application
- 5.2.1. Configuration Management
- 5.2.2. Performance Management
- 5.2.3. Network Management
- 5.2.4. Database Management Systems
- 5.2.5. Other Applications
- 5.3. Market Analysis, Insights and Forecast - by End-user Industry
- 5.3.1. BFSI
- 5.3.2. Manufacturing
- 5.3.3. Government and Education
- 5.3.4. IT and Telecommunication
- 5.3.5. Retail
- 5.3.6. Travel and Hospitality
- 5.3.7. Healthcare
- 5.3.8. Other End-user Industries
- 5.4. Market Analysis, Insights and Forecast - by Region
- 5.4.1. North America
- 5.4.2. Europe
- 5.4.3. Asia Pacific
- 5.4.4. Latin America
- 5.4.5. Middle East and Africa
- 5.1. Market Analysis, Insights and Forecast - by Deployment
- 6. North America ITSM Industry Analysis, Insights and Forecast, 2019-2031
- 6.1. Market Analysis, Insights and Forecast - by Deployment
- 6.1.1. Cloud
- 6.1.2. On-premise
- 6.2. Market Analysis, Insights and Forecast - by Application
- 6.2.1. Configuration Management
- 6.2.2. Performance Management
- 6.2.3. Network Management
- 6.2.4. Database Management Systems
- 6.2.5. Other Applications
- 6.3. Market Analysis, Insights and Forecast - by End-user Industry
- 6.3.1. BFSI
- 6.3.2. Manufacturing
- 6.3.3. Government and Education
- 6.3.4. IT and Telecommunication
- 6.3.5. Retail
- 6.3.6. Travel and Hospitality
- 6.3.7. Healthcare
- 6.3.8. Other End-user Industries
- 6.1. Market Analysis, Insights and Forecast - by Deployment
- 7. Europe ITSM Industry Analysis, Insights and Forecast, 2019-2031
- 7.1. Market Analysis, Insights and Forecast - by Deployment
- 7.1.1. Cloud
- 7.1.2. On-premise
- 7.2. Market Analysis, Insights and Forecast - by Application
- 7.2.1. Configuration Management
- 7.2.2. Performance Management
- 7.2.3. Network Management
- 7.2.4. Database Management Systems
- 7.2.5. Other Applications
- 7.3. Market Analysis, Insights and Forecast - by End-user Industry
- 7.3.1. BFSI
- 7.3.2. Manufacturing
- 7.3.3. Government and Education
- 7.3.4. IT and Telecommunication
- 7.3.5. Retail
- 7.3.6. Travel and Hospitality
- 7.3.7. Healthcare
- 7.3.8. Other End-user Industries
- 7.1. Market Analysis, Insights and Forecast - by Deployment
- 8. Asia Pacific ITSM Industry Analysis, Insights and Forecast, 2019-2031
- 8.1. Market Analysis, Insights and Forecast - by Deployment
- 8.1.1. Cloud
- 8.1.2. On-premise
- 8.2. Market Analysis, Insights and Forecast - by Application
- 8.2.1. Configuration Management
- 8.2.2. Performance Management
- 8.2.3. Network Management
- 8.2.4. Database Management Systems
- 8.2.5. Other Applications
- 8.3. Market Analysis, Insights and Forecast - by End-user Industry
- 8.3.1. BFSI
- 8.3.2. Manufacturing
- 8.3.3. Government and Education
- 8.3.4. IT and Telecommunication
- 8.3.5. Retail
- 8.3.6. Travel and Hospitality
- 8.3.7. Healthcare
- 8.3.8. Other End-user Industries
- 8.1. Market Analysis, Insights and Forecast - by Deployment
- 9. Latin America ITSM Industry Analysis, Insights and Forecast, 2019-2031
- 9.1. Market Analysis, Insights and Forecast - by Deployment
- 9.1.1. Cloud
- 9.1.2. On-premise
- 9.2. Market Analysis, Insights and Forecast - by Application
- 9.2.1. Configuration Management
- 9.2.2. Performance Management
- 9.2.3. Network Management
- 9.2.4. Database Management Systems
- 9.2.5. Other Applications
- 9.3. Market Analysis, Insights and Forecast - by End-user Industry
- 9.3.1. BFSI
- 9.3.2. Manufacturing
- 9.3.3. Government and Education
- 9.3.4. IT and Telecommunication
- 9.3.5. Retail
- 9.3.6. Travel and Hospitality
- 9.3.7. Healthcare
- 9.3.8. Other End-user Industries
- 9.1. Market Analysis, Insights and Forecast - by Deployment
- 10. Middle East and Africa ITSM Industry Analysis, Insights and Forecast, 2019-2031
- 10.1. Market Analysis, Insights and Forecast - by Deployment
- 10.1.1. Cloud
- 10.1.2. On-premise
- 10.2. Market Analysis, Insights and Forecast - by Application
- 10.2.1. Configuration Management
- 10.2.2. Performance Management
- 10.2.3. Network Management
- 10.2.4. Database Management Systems
- 10.2.5. Other Applications
- 10.3. Market Analysis, Insights and Forecast - by End-user Industry
- 10.3.1. BFSI
- 10.3.2. Manufacturing
- 10.3.3. Government and Education
- 10.3.4. IT and Telecommunication
- 10.3.5. Retail
- 10.3.6. Travel and Hospitality
- 10.3.7. Healthcare
- 10.3.8. Other End-user Industries
- 10.1. Market Analysis, Insights and Forecast - by Deployment
- 11. North America ITSM Industry Analysis, Insights and Forecast, 2019-2031
- 11.1. Market Analysis, Insights and Forecast - By Country/Sub-region
- 11.1.1 United States
- 11.1.2 Canada
- 11.1.3 Mexico
- 12. Europe ITSM Industry Analysis, Insights and Forecast, 2019-2031
- 12.1. Market Analysis, Insights and Forecast - By Country/Sub-region
- 12.1.1 Germany
- 12.1.2 United Kingdom
- 12.1.3 France
- 12.1.4 Spain
- 12.1.5 Italy
- 12.1.6 Spain
- 12.1.7 Belgium
- 12.1.8 Netherland
- 12.1.9 Nordics
- 12.1.10 Rest of Europe
- 13. Asia Pacific ITSM Industry Analysis, Insights and Forecast, 2019-2031
- 13.1. Market Analysis, Insights and Forecast - By Country/Sub-region
- 13.1.1 China
- 13.1.2 Japan
- 13.1.3 India
- 13.1.4 South Korea
- 13.1.5 Southeast Asia
- 13.1.6 Australia
- 13.1.7 Indonesia
- 13.1.8 Phillipes
- 13.1.9 Singapore
- 13.1.10 Thailandc
- 13.1.11 Rest of Asia Pacific
- 14. South America ITSM Industry Analysis, Insights and Forecast, 2019-2031
- 14.1. Market Analysis, Insights and Forecast - By Country/Sub-region
- 14.1.1 Brazil
- 14.1.2 Argentina
- 14.1.3 Peru
- 14.1.4 Chile
- 14.1.5 Colombia
- 14.1.6 Ecuador
- 14.1.7 Venezuela
- 14.1.8 Rest of South America
- 15. North America ITSM Industry Analysis, Insights and Forecast, 2019-2031
- 15.1. Market Analysis, Insights and Forecast - By Country/Sub-region
- 15.1.1 United States
- 15.1.2 Canada
- 15.1.3 Mexico
- 16. MEA ITSM Industry Analysis, Insights and Forecast, 2019-2031
- 16.1. Market Analysis, Insights and Forecast - By Country/Sub-region
- 16.1.1 United Arab Emirates
- 16.1.2 Saudi Arabia
- 16.1.3 South Africa
- 16.1.4 Rest of Middle East and Africa
- 17. Competitive Analysis
- 17.1. Global Market Share Analysis 2024
- 17.2. Company Profiles
- 17.2.1 ASG Technologies Group Inc
- 17.2.1.1. Overview
- 17.2.1.2. Products
- 17.2.1.3. SWOT Analysis
- 17.2.1.4. Recent Developments
- 17.2.1.5. Financials (Based on Availability)
- 17.2.2 Micro Focus International PLC
- 17.2.2.1. Overview
- 17.2.2.2. Products
- 17.2.2.3. SWOT Analysis
- 17.2.2.4. Recent Developments
- 17.2.2.5. Financials (Based on Availability)
- 17.2.3 Atlassian Corporation PLC
- 17.2.3.1. Overview
- 17.2.3.2. Products
- 17.2.3.3. SWOT Analysis
- 17.2.3.4. Recent Developments
- 17.2.3.5. Financials (Based on Availability)
- 17.2.4 IBM Corporation
- 17.2.4.1. Overview
- 17.2.4.2. Products
- 17.2.4.3. SWOT Analysis
- 17.2.4.4. Recent Developments
- 17.2.4.5. Financials (Based on Availability)
- 17.2.5 Freshworks Inc
- 17.2.5.1. Overview
- 17.2.5.2. Products
- 17.2.5.3. SWOT Analysis
- 17.2.5.4. Recent Developments
- 17.2.5.5. Financials (Based on Availability)
- 17.2.6 ServiceNow Inc *List Not Exhaustive
- 17.2.6.1. Overview
- 17.2.6.2. Products
- 17.2.6.3. SWOT Analysis
- 17.2.6.4. Recent Developments
- 17.2.6.5. Financials (Based on Availability)
- 17.2.7 Ivanti Inc
- 17.2.7.1. Overview
- 17.2.7.2. Products
- 17.2.7.3. SWOT Analysis
- 17.2.7.4. Recent Developments
- 17.2.7.5. Financials (Based on Availability)
- 17.2.8 Broadcom Inc
- 17.2.8.1. Overview
- 17.2.8.2. Products
- 17.2.8.3. SWOT Analysis
- 17.2.8.4. Recent Developments
- 17.2.8.5. Financials (Based on Availability)
- 17.2.9 BMC Software Inc (Kohlberg Kravis Roberts & Co LP )
- 17.2.9.1. Overview
- 17.2.9.2. Products
- 17.2.9.3. SWOT Analysis
- 17.2.9.4. Recent Developments
- 17.2.9.5. Financials (Based on Availability)
- 17.2.10 Axios Systems
- 17.2.10.1. Overview
- 17.2.10.2. Products
- 17.2.10.3. SWOT Analysis
- 17.2.10.4. Recent Developments
- 17.2.10.5. Financials (Based on Availability)
- 17.2.1 ASG Technologies Group Inc
List of Figures
- Figure 1: Global ITSM Industry Revenue Breakdown (Million, %) by Region 2024 & 2032
- Figure 2: North America ITSM Industry Revenue (Million), by Country 2024 & 2032
- Figure 3: North America ITSM Industry Revenue Share (%), by Country 2024 & 2032
- Figure 4: Europe ITSM Industry Revenue (Million), by Country 2024 & 2032
- Figure 5: Europe ITSM Industry Revenue Share (%), by Country 2024 & 2032
- Figure 6: Asia Pacific ITSM Industry Revenue (Million), by Country 2024 & 2032
- Figure 7: Asia Pacific ITSM Industry Revenue Share (%), by Country 2024 & 2032
- Figure 8: South America ITSM Industry Revenue (Million), by Country 2024 & 2032
- Figure 9: South America ITSM Industry Revenue Share (%), by Country 2024 & 2032
- Figure 10: North America ITSM Industry Revenue (Million), by Country 2024 & 2032
- Figure 11: North America ITSM Industry Revenue Share (%), by Country 2024 & 2032
- Figure 12: MEA ITSM Industry Revenue (Million), by Country 2024 & 2032
- Figure 13: MEA ITSM Industry Revenue Share (%), by Country 2024 & 2032
- Figure 14: North America ITSM Industry Revenue (Million), by Deployment 2024 & 2032
- Figure 15: North America ITSM Industry Revenue Share (%), by Deployment 2024 & 2032
- Figure 16: North America ITSM Industry Revenue (Million), by Application 2024 & 2032
- Figure 17: North America ITSM Industry Revenue Share (%), by Application 2024 & 2032
- Figure 18: North America ITSM Industry Revenue (Million), by End-user Industry 2024 & 2032
- Figure 19: North America ITSM Industry Revenue Share (%), by End-user Industry 2024 & 2032
- Figure 20: North America ITSM Industry Revenue (Million), by Country 2024 & 2032
- Figure 21: North America ITSM Industry Revenue Share (%), by Country 2024 & 2032
- Figure 22: Europe ITSM Industry Revenue (Million), by Deployment 2024 & 2032
- Figure 23: Europe ITSM Industry Revenue Share (%), by Deployment 2024 & 2032
- Figure 24: Europe ITSM Industry Revenue (Million), by Application 2024 & 2032
- Figure 25: Europe ITSM Industry Revenue Share (%), by Application 2024 & 2032
- Figure 26: Europe ITSM Industry Revenue (Million), by End-user Industry 2024 & 2032
- Figure 27: Europe ITSM Industry Revenue Share (%), by End-user Industry 2024 & 2032
- Figure 28: Europe ITSM Industry Revenue (Million), by Country 2024 & 2032
- Figure 29: Europe ITSM Industry Revenue Share (%), by Country 2024 & 2032
- Figure 30: Asia Pacific ITSM Industry Revenue (Million), by Deployment 2024 & 2032
- Figure 31: Asia Pacific ITSM Industry Revenue Share (%), by Deployment 2024 & 2032
- Figure 32: Asia Pacific ITSM Industry Revenue (Million), by Application 2024 & 2032
- Figure 33: Asia Pacific ITSM Industry Revenue Share (%), by Application 2024 & 2032
- Figure 34: Asia Pacific ITSM Industry Revenue (Million), by End-user Industry 2024 & 2032
- Figure 35: Asia Pacific ITSM Industry Revenue Share (%), by End-user Industry 2024 & 2032
- Figure 36: Asia Pacific ITSM Industry Revenue (Million), by Country 2024 & 2032
- Figure 37: Asia Pacific ITSM Industry Revenue Share (%), by Country 2024 & 2032
- Figure 38: Latin America ITSM Industry Revenue (Million), by Deployment 2024 & 2032
- Figure 39: Latin America ITSM Industry Revenue Share (%), by Deployment 2024 & 2032
- Figure 40: Latin America ITSM Industry Revenue (Million), by Application 2024 & 2032
- Figure 41: Latin America ITSM Industry Revenue Share (%), by Application 2024 & 2032
- Figure 42: Latin America ITSM Industry Revenue (Million), by End-user Industry 2024 & 2032
- Figure 43: Latin America ITSM Industry Revenue Share (%), by End-user Industry 2024 & 2032
- Figure 44: Latin America ITSM Industry Revenue (Million), by Country 2024 & 2032
- Figure 45: Latin America ITSM Industry Revenue Share (%), by Country 2024 & 2032
- Figure 46: Middle East and Africa ITSM Industry Revenue (Million), by Deployment 2024 & 2032
- Figure 47: Middle East and Africa ITSM Industry Revenue Share (%), by Deployment 2024 & 2032
- Figure 48: Middle East and Africa ITSM Industry Revenue (Million), by Application 2024 & 2032
- Figure 49: Middle East and Africa ITSM Industry Revenue Share (%), by Application 2024 & 2032
- Figure 50: Middle East and Africa ITSM Industry Revenue (Million), by End-user Industry 2024 & 2032
- Figure 51: Middle East and Africa ITSM Industry Revenue Share (%), by End-user Industry 2024 & 2032
- Figure 52: Middle East and Africa ITSM Industry Revenue (Million), by Country 2024 & 2032
- Figure 53: Middle East and Africa ITSM Industry Revenue Share (%), by Country 2024 & 2032
List of Tables
- Table 1: Global ITSM Industry Revenue Million Forecast, by Region 2019 & 2032
- Table 2: Global ITSM Industry Revenue Million Forecast, by Deployment 2019 & 2032
- Table 3: Global ITSM Industry Revenue Million Forecast, by Application 2019 & 2032
- Table 4: Global ITSM Industry Revenue Million Forecast, by End-user Industry 2019 & 2032
- Table 5: Global ITSM Industry Revenue Million Forecast, by Region 2019 & 2032
- Table 6: Global ITSM Industry Revenue Million Forecast, by Country 2019 & 2032
- Table 7: United States ITSM Industry Revenue (Million) Forecast, by Application 2019 & 2032
- Table 8: Canada ITSM Industry Revenue (Million) Forecast, by Application 2019 & 2032
- Table 9: Mexico ITSM Industry Revenue (Million) Forecast, by Application 2019 & 2032
- Table 10: Global ITSM Industry Revenue Million Forecast, by Country 2019 & 2032
- Table 11: Germany ITSM Industry Revenue (Million) Forecast, by Application 2019 & 2032
- Table 12: United Kingdom ITSM Industry Revenue (Million) Forecast, by Application 2019 & 2032
- Table 13: France ITSM Industry Revenue (Million) Forecast, by Application 2019 & 2032
- Table 14: Spain ITSM Industry Revenue (Million) Forecast, by Application 2019 & 2032
- Table 15: Italy ITSM Industry Revenue (Million) Forecast, by Application 2019 & 2032
- Table 16: Spain ITSM Industry Revenue (Million) Forecast, by Application 2019 & 2032
- Table 17: Belgium ITSM Industry Revenue (Million) Forecast, by Application 2019 & 2032
- Table 18: Netherland ITSM Industry Revenue (Million) Forecast, by Application 2019 & 2032
- Table 19: Nordics ITSM Industry Revenue (Million) Forecast, by Application 2019 & 2032
- Table 20: Rest of Europe ITSM Industry Revenue (Million) Forecast, by Application 2019 & 2032
- Table 21: Global ITSM Industry Revenue Million Forecast, by Country 2019 & 2032
- Table 22: China ITSM Industry Revenue (Million) Forecast, by Application 2019 & 2032
- Table 23: Japan ITSM Industry Revenue (Million) Forecast, by Application 2019 & 2032
- Table 24: India ITSM Industry Revenue (Million) Forecast, by Application 2019 & 2032
- Table 25: South Korea ITSM Industry Revenue (Million) Forecast, by Application 2019 & 2032
- Table 26: Southeast Asia ITSM Industry Revenue (Million) Forecast, by Application 2019 & 2032
- Table 27: Australia ITSM Industry Revenue (Million) Forecast, by Application 2019 & 2032
- Table 28: Indonesia ITSM Industry Revenue (Million) Forecast, by Application 2019 & 2032
- Table 29: Phillipes ITSM Industry Revenue (Million) Forecast, by Application 2019 & 2032
- Table 30: Singapore ITSM Industry Revenue (Million) Forecast, by Application 2019 & 2032
- Table 31: Thailandc ITSM Industry Revenue (Million) Forecast, by Application 2019 & 2032
- Table 32: Rest of Asia Pacific ITSM Industry Revenue (Million) Forecast, by Application 2019 & 2032
- Table 33: Global ITSM Industry Revenue Million Forecast, by Country 2019 & 2032
- Table 34: Brazil ITSM Industry Revenue (Million) Forecast, by Application 2019 & 2032
- Table 35: Argentina ITSM Industry Revenue (Million) Forecast, by Application 2019 & 2032
- Table 36: Peru ITSM Industry Revenue (Million) Forecast, by Application 2019 & 2032
- Table 37: Chile ITSM Industry Revenue (Million) Forecast, by Application 2019 & 2032
- Table 38: Colombia ITSM Industry Revenue (Million) Forecast, by Application 2019 & 2032
- Table 39: Ecuador ITSM Industry Revenue (Million) Forecast, by Application 2019 & 2032
- Table 40: Venezuela ITSM Industry Revenue (Million) Forecast, by Application 2019 & 2032
- Table 41: Rest of South America ITSM Industry Revenue (Million) Forecast, by Application 2019 & 2032
- Table 42: Global ITSM Industry Revenue Million Forecast, by Country 2019 & 2032
- Table 43: United States ITSM Industry Revenue (Million) Forecast, by Application 2019 & 2032
- Table 44: Canada ITSM Industry Revenue (Million) Forecast, by Application 2019 & 2032
- Table 45: Mexico ITSM Industry Revenue (Million) Forecast, by Application 2019 & 2032
- Table 46: Global ITSM Industry Revenue Million Forecast, by Country 2019 & 2032
- Table 47: United Arab Emirates ITSM Industry Revenue (Million) Forecast, by Application 2019 & 2032
- Table 48: Saudi Arabia ITSM Industry Revenue (Million) Forecast, by Application 2019 & 2032
- Table 49: South Africa ITSM Industry Revenue (Million) Forecast, by Application 2019 & 2032
- Table 50: Rest of Middle East and Africa ITSM Industry Revenue (Million) Forecast, by Application 2019 & 2032
- Table 51: Global ITSM Industry Revenue Million Forecast, by Deployment 2019 & 2032
- Table 52: Global ITSM Industry Revenue Million Forecast, by Application 2019 & 2032
- Table 53: Global ITSM Industry Revenue Million Forecast, by End-user Industry 2019 & 2032
- Table 54: Global ITSM Industry Revenue Million Forecast, by Country 2019 & 2032
- Table 55: Global ITSM Industry Revenue Million Forecast, by Deployment 2019 & 2032
- Table 56: Global ITSM Industry Revenue Million Forecast, by Application 2019 & 2032
- Table 57: Global ITSM Industry Revenue Million Forecast, by End-user Industry 2019 & 2032
- Table 58: Global ITSM Industry Revenue Million Forecast, by Country 2019 & 2032
- Table 59: Global ITSM Industry Revenue Million Forecast, by Deployment 2019 & 2032
- Table 60: Global ITSM Industry Revenue Million Forecast, by Application 2019 & 2032
- Table 61: Global ITSM Industry Revenue Million Forecast, by End-user Industry 2019 & 2032
- Table 62: Global ITSM Industry Revenue Million Forecast, by Country 2019 & 2032
- Table 63: Global ITSM Industry Revenue Million Forecast, by Deployment 2019 & 2032
- Table 64: Global ITSM Industry Revenue Million Forecast, by Application 2019 & 2032
- Table 65: Global ITSM Industry Revenue Million Forecast, by End-user Industry 2019 & 2032
- Table 66: Global ITSM Industry Revenue Million Forecast, by Country 2019 & 2032
- Table 67: Global ITSM Industry Revenue Million Forecast, by Deployment 2019 & 2032
- Table 68: Global ITSM Industry Revenue Million Forecast, by Application 2019 & 2032
- Table 69: Global ITSM Industry Revenue Million Forecast, by End-user Industry 2019 & 2032
- Table 70: Global ITSM Industry Revenue Million Forecast, by Country 2019 & 2032
Frequently Asked Questions
1. What is the projected Compound Annual Growth Rate (CAGR) of the ITSM Industry?
The projected CAGR is approximately 16.72%.
2. Which companies are prominent players in the ITSM Industry?
Key companies in the market include ASG Technologies Group Inc, Micro Focus International PLC, Atlassian Corporation PLC, IBM Corporation, Freshworks Inc, ServiceNow Inc *List Not Exhaustive, Ivanti Inc, Broadcom Inc, BMC Software Inc (Kohlberg Kravis Roberts & Co LP ), Axios Systems.
3. What are the main segments of the ITSM Industry?
The market segments include Deployment, Application, End-user Industry.
4. Can you provide details about the market size?
The market size is estimated to be USD 11 Million as of 2022.
5. What are some drivers contributing to market growth?
Rising Adoption of Updated IT Infrastructure Across End-user Industries; Increasing Demand for a Unified Platform to Manage and Monitor IT Infrastructure Performance.
6. What are the notable trends driving market growth?
The IT and Telecommunication Segment is Expected to Hold a Significant Market Share.
7. Are there any restraints impacting market growth?
Issues in ITSM Implementation and Lack of Quality Standards in Service-level Agreement.
8. Can you provide examples of recent developments in the market?
April 2024: 4me, which has a software platform that covers everything from agile development to managed service providers (MSPs), consolidated its position in the fiercely competitive IT service management (ITSM) market by acquiring StatusCast, a provider of cloud-based incident management products.
9. What pricing options are available for accessing the report?
Pricing options include single-user, multi-user, and enterprise licenses priced at USD 4750, USD 5250, and USD 8750 respectively.
10. Is the market size provided in terms of value or volume?
The market size is provided in terms of value, measured in Million.
11. Are there any specific market keywords associated with the report?
Yes, the market keyword associated with the report is "ITSM Industry," which aids in identifying and referencing the specific market segment covered.
12. How do I determine which pricing option suits my needs best?
The pricing options vary based on user requirements and access needs. Individual users may opt for single-user licenses, while businesses requiring broader access may choose multi-user or enterprise licenses for cost-effective access to the report.
13. Are there any additional resources or data provided in the ITSM Industry report?
While the report offers comprehensive insights, it's advisable to review the specific contents or supplementary materials provided to ascertain if additional resources or data are available.
14. How can I stay updated on further developments or reports in the ITSM Industry?
To stay informed about further developments, trends, and reports in the ITSM Industry, consider subscribing to industry newsletters, following relevant companies and organizations, or regularly checking reputable industry news sources and publications.
Methodology
Step 1 - Identification of Relevant Samples Size from Population Database


Step 2 - Approaches for Defining Global Market Size (Value, Volume* & Price*)

Note*: In applicable scenarios
Step 3 - Data Sources
Primary Research
- Web Analytics
- Survey Reports
- Research Institute
- Latest Research Reports
- Opinion Leaders
Secondary Research
- Annual Reports
- White Paper
- Latest Press Release
- Industry Association
- Paid Database
- Investor Presentations

Step 4 - Data Triangulation
Involves using different sources of information in order to increase the validity of a study
These sources are likely to be stakeholders in a program - participants, other researchers, program staff, other community members, and so on.
Then we put all data in single framework & apply various statistical tools to find out the dynamic on the market.
During the analysis stage, feedback from the stakeholder groups would be compared to determine areas of agreement as well as areas of divergence


