

Key Insights
The IT Operation Analytics (ITOA) market is experiencing explosive growth, driven by the increasing complexity of IT environments and the escalating need for proactive performance management and cost optimization. The market size in 2024 stands at an impressive USD 13.16 billion, projected to surge at a compound annual growth rate (CAGR) of 22.6% through 2033. This robust expansion is fueled by the widespread adoption of cloud-based solutions, which offer scalability and flexibility for real-time data analysis, alongside the persistent demand for on-premise deployments in sectors requiring stringent data control. Key application segments, including application monitoring, business and IT services monitoring, and infrastructure monitoring, are all contributing to this upward trajectory as organizations seek to enhance user experience, ensure service availability, and gain deeper insights into their IT ecosystem's health.
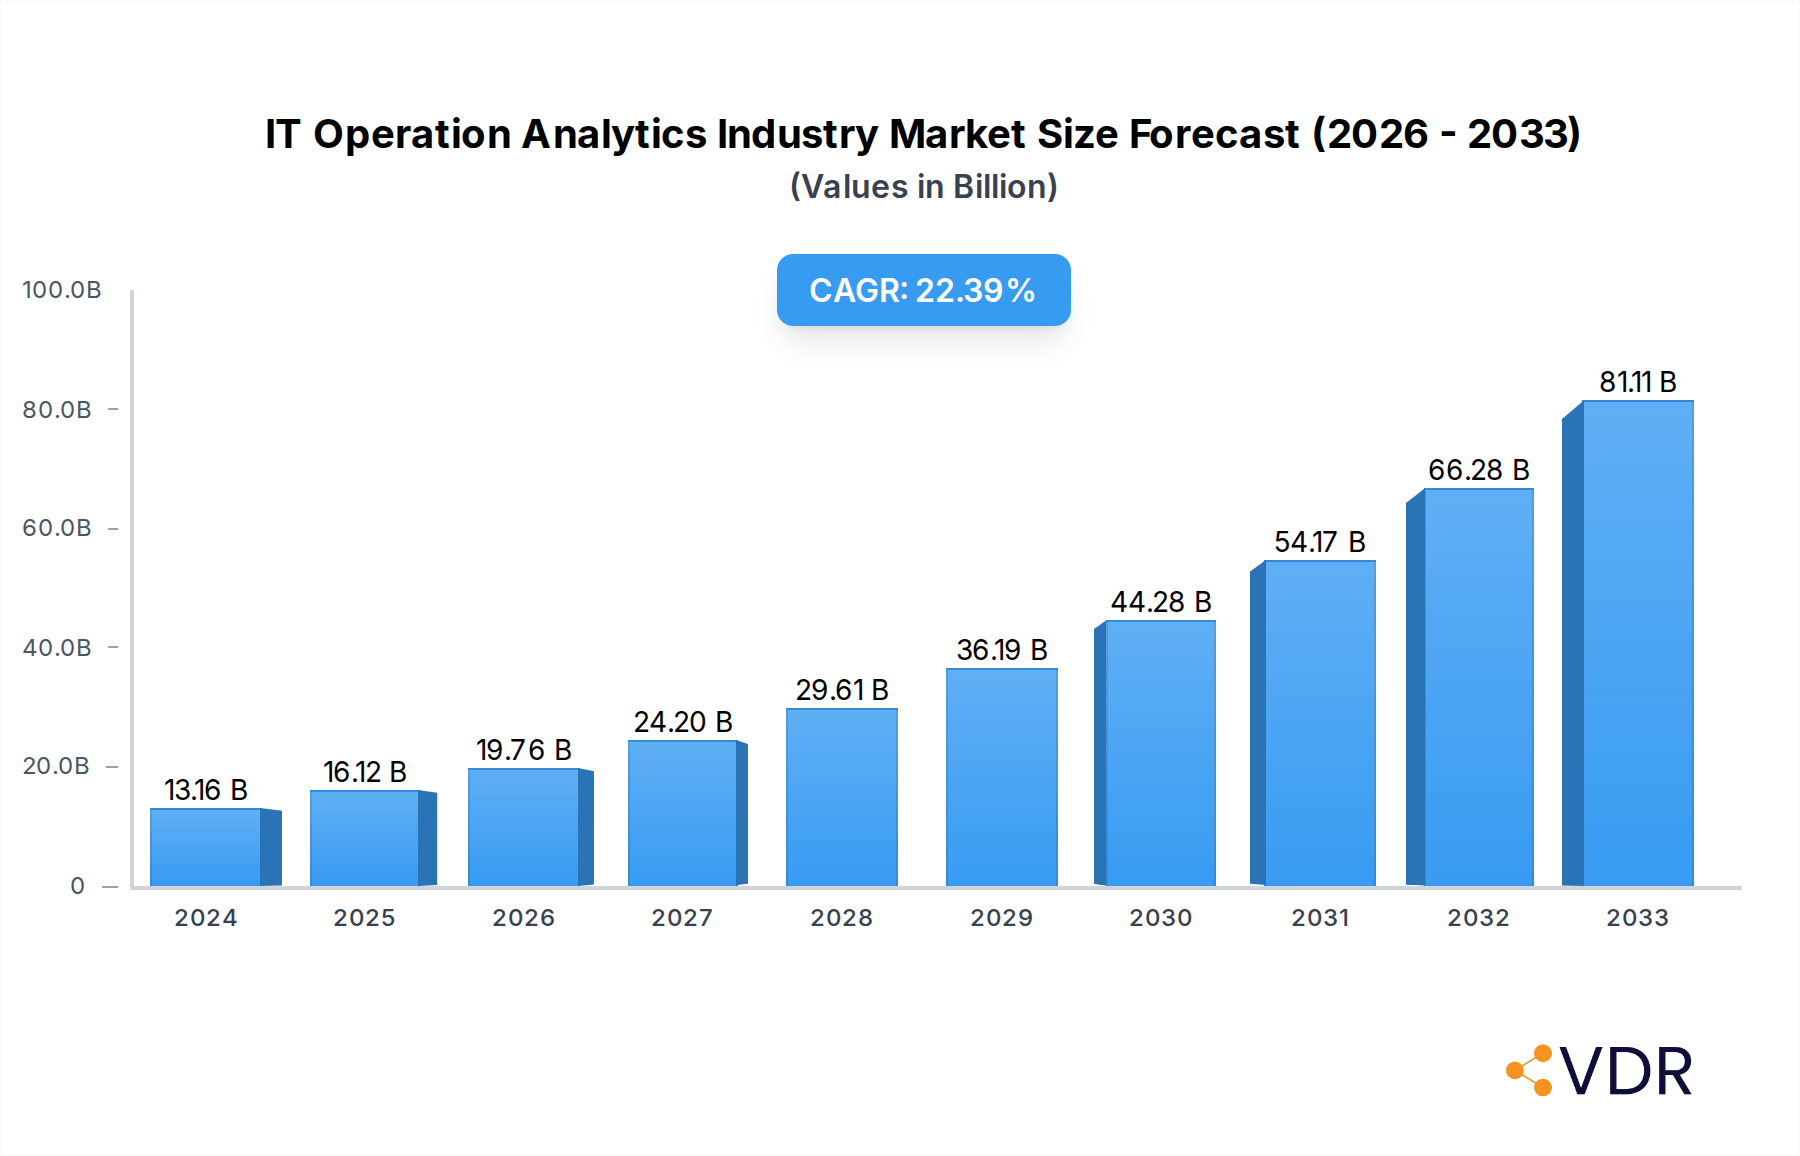
IT Operation Analytics Industry Market Size (In Billion)
The ITOA market's impressive growth is further propelled by its critical role in diverse end-user industries such as Banking, Financial Services, and Insurance (BFSI), Healthcare, Telecommunications, Retail, and Industrial sectors. These industries are leveraging ITOA to improve operational efficiency, mitigate risks, and gain a competitive edge by understanding critical performance metrics and anticipating potential disruptions. While the market benefits from strong demand drivers, certain restraints like the initial implementation cost and the need for skilled professionals to effectively manage and interpret the vast amounts of data generated, present challenges. However, the ongoing innovation in AI and machine learning within ITOA solutions is expected to address these limitations, leading to more intelligent automation and predictive capabilities. Prominent players like Splunk, IBM, Oracle, and BMC Software are at the forefront, continuously innovating to meet the evolving demands of this dynamic market.

IT Operation Analytics Industry Company Market Share
Unlocking IT Operational Excellence: A Comprehensive Analysis of the IT Operation Analytics Industry (2019–2033)
This in-depth report provides a definitive analysis of the global IT Operation Analytics (ITOA) industry, charting its evolution from 2019 to 2033. With a base year of 2025, the study offers critical insights into market dynamics, growth trajectories, key players, and emerging opportunities. Dive deep into how ITOA solutions are revolutionizing IT infrastructure management, enhancing application performance, and driving business outcomes across diverse end-user industries. This report is essential for IT leaders, technology providers, investors, and strategic planners seeking to navigate and capitalize on this rapidly expanding market.
IT Operation Analytics Industry Market Dynamics & Structure
The IT Operation Analytics industry is characterized by a dynamic market structure driven by continuous technological innovation and increasing demand for proactive IT management. While the market is moderately consolidated, with major players like IBM Corp, Oracle Corp, and Splunk Inc holding significant shares, there is substantial room for agile innovators. Key technological drivers include the proliferation of AI and Machine Learning (ML) for predictive analytics, the rise of AIOps platforms, and the growing adoption of hybrid and multi-cloud environments. Regulatory frameworks, particularly concerning data privacy and security (e.g., GDPR, CCPA), are increasingly shaping ITOA solution development, emphasizing compliance and robust data governance. Competitive product substitutes range from traditional monitoring tools to broader enterprise management suites, pushing ITOA vendors to differentiate through advanced capabilities and seamless integration. End-user demographics are shifting towards digital-native enterprises and legacy organizations undergoing digital transformation, all seeking improved operational efficiency and reduced downtime. Mergers and acquisitions (M&A) are a prevalent trend, with larger tech giants acquiring specialized ITOA companies to expand their portfolios and gain market share. For instance, the acquisition of specialized observability platforms by broader IT management vendors reflects a strategic consolidation. The market is projected to witness a compound annual growth rate (CAGR) of approximately 18% during the forecast period, with total market value reaching an estimated $35.5 billion by 2025.
- Market Concentration: Moderate consolidation with key players like IBM Corp, Oracle Corp, and Splunk Inc, alongside emerging specialized vendors.
- Technological Innovation Drivers: AI/ML for predictive analytics, AIOps, hybrid/multi-cloud support, containerization observability.
- Regulatory Frameworks: Emphasis on data privacy (GDPR, CCPA), security compliance, and data sovereignty.
- Competitive Product Substitutes: Traditional IT monitoring, network management tools, broader IT service management (ITSM) solutions.
- End-User Demographics: Digital-native enterprises, SMBs undergoing digital transformation, large enterprises optimizing existing infrastructure.
- M&A Trends: Strategic acquisitions by larger vendors to enhance AI/ML capabilities and expand product offerings.
IT Operation Analytics Industry Growth Trends & Insights
The IT Operation Analytics industry is experiencing an unprecedented surge in growth, fueled by the escalating complexity of modern IT infrastructures and the critical need for operational resilience. The global ITOA market is projected to reach approximately $35.5 billion in 2025, a significant leap from its historical performance. This expansion is primarily driven by the increasing adoption of cloud-based solutions, with cloud-based ITOA projected to capture over 70% of the market share by 2025. The surge in digital transformation initiatives across all sectors necessitates sophisticated tools for monitoring, analyzing, and optimizing IT performance, leading to higher adoption rates for ITOA platforms. Technological disruptions, such as the widespread integration of Artificial Intelligence and Machine Learning into ITOA solutions, are transforming reactive monitoring into predictive and prescriptive insights, significantly reducing mean time to resolution (MTTR). Consumer behavior shifts are evident as businesses increasingly prioritize user experience and service availability, making robust ITOA indispensable.
The historical period from 2019 to 2024 witnessed a CAGR of approximately 15%, laying a strong foundation for future growth. The estimated value of the ITOA market in 2025 stands at $35.5 billion. By 2033, the market is anticipated to reach an impressive $120.2 billion, exhibiting a CAGR of around 16.5% throughout the forecast period. This growth is underpinned by several key trends:
- Cloud Dominance: The migration of IT infrastructure to the cloud has made cloud-based ITOA the preferred deployment model due to its scalability, flexibility, and cost-effectiveness.
- AIOps Integration: The convergence of AI for IT Operations (AIOps) with ITOA is a major growth catalyst, enabling automated anomaly detection, root cause analysis, and proactive issue resolution.
- Observability Expansion: The shift from traditional monitoring to comprehensive observability, encompassing logs, metrics, and traces, is driving demand for advanced ITOA capabilities.
- Application Performance Management (APM) Focus: With the increasing reliance on complex applications, businesses are heavily investing in APM tools that leverage ITOA for deep performance insights and troubleshooting.
- Data Volume Growth: The exponential growth of data generated by IT systems requires sophisticated analytics to extract actionable intelligence.
- Digital Transformation Acceleration: Enterprises across all industries are accelerating their digital transformation journeys, creating a heightened demand for ITOA to ensure seamless operations.
The market penetration of ITOA solutions is expected to deepen significantly, moving from an estimated 35% in 2024 to over 60% by 2033 across major enterprise segments. This increased penetration signifies the maturation of the market and its recognition as a core component of IT strategy.
Dominant Regions, Countries, or Segments in IT Operation Analytics Industry
The IT Operation Analytics industry's dominance is currently spearheaded by the North America region, driven by its advanced technological infrastructure, high concentration of large enterprises, and aggressive adoption of cutting-edge IT solutions. Within North America, the United States stands out as the leading country, accounting for an estimated 45% of the global ITOA market share in 2025, valued at approximately $16.0 billion. This dominance is attributed to a robust ecosystem of technology providers, significant R&D investments, and a strong demand for efficient IT operations from its BFSI, Healthcare, and Technology sectors.
Among the deployment segments, Cloud-Based solutions are the clear frontrunner, projected to command over 70% of the market share in 2025, valued at an estimated $24.9 billion. This is propelled by the scalability, agility, and cost-effectiveness offered by cloud environments, aligning perfectly with the needs of modern businesses. The flexibility of cloud-based ITOA allows for seamless integration with other cloud services and facilitates remote management, crucial in today's distributed IT landscapes.
In terms of applications, Application Monitoring is a critical driver, expected to contribute an estimated $9.7 billion to the market in 2025. This segment's importance stems from the direct impact of application performance on customer experience and business revenue. As businesses increasingly rely on software for their operations, detailed insights into application behavior, performance bottlenecks, and user experience are paramount.
The BFSI (Banking, Financial Services, and Insurance) sector is a dominant end-user industry, with an estimated market share of 25% in 2025, valued at approximately $8.9 billion. This sector's reliance on highly secure, reliable, and performant IT systems, coupled with stringent regulatory requirements, makes ITOA an indispensable tool for risk management, fraud detection, and ensuring uninterrupted service delivery.
Key drivers fueling this regional and segmental dominance include:
- Economic Policies: Favorable government initiatives supporting digital innovation and technological adoption in North America.
- Infrastructure: Well-established and advanced IT infrastructure in the US enables seamless deployment and utilization of ITOA solutions.
- Technological Hubs: Presence of major technology companies and research institutions fostering innovation and talent development.
- Digital Transformation Mandate: A strong push for digital transformation across all industries, particularly in BFSI and Healthcare, necessitating advanced operational analytics.
- Cloud Adoption Rates: High propensity for cloud migration among North American businesses.
- Security and Compliance Demands: The critical need for robust security and compliance in highly regulated industries like BFSI.
The growth potential in these dominant segments is substantial, with ongoing advancements in AI/ML integration and the expansion of AIOps capabilities further solidifying their leading positions. The interplay between these factors ensures North America's continued leadership, cloud-based deployments' widespread acceptance, application monitoring's critical role, and the BFSI sector's consistent demand for ITOA solutions.
IT Operation Analytics Industry Product Landscape
The IT Operation Analytics industry's product landscape is marked by continuous innovation focused on delivering enhanced visibility, predictive capabilities, and automated remediation. Modern ITOA solutions are moving beyond basic performance monitoring to offer comprehensive observability across applications, infrastructure, and user experiences. Key product innovations include the integration of Artificial Intelligence and Machine Learning for anomaly detection, root cause analysis, and proactive issue prediction. Solutions now offer advanced capabilities like end-to-end transaction tracing, real-time performance dashboards, and intelligent alerting systems designed to minimize noise and prioritize critical issues. The performance metrics for these products are increasingly evaluated based on their ability to reduce Mean Time To Resolution (MTTR), improve system availability, enhance resource utilization, and provide actionable insights for IT optimization. Unique selling propositions often revolve around seamless integration with existing IT stacks, intuitive user interfaces, and the power of AI-driven insights that enable IT teams to shift from reactive firefighting to proactive operational management.
Key Drivers, Barriers & Challenges in IT Operation Analytics Industry
The IT Operation Analytics industry is propelled by several powerful drivers. The escalating complexity of modern IT environments, driven by cloud adoption, microservices, and IoT proliferation, necessitates advanced analytics for effective management. The increasing demand for seamless customer experiences and uninterrupted service availability is a primary growth catalyst, making proactive issue detection and resolution paramount. Furthermore, the integration of Artificial Intelligence (AI) and Machine Learning (ML) into ITOA platforms is transforming reactive monitoring into predictive and prescriptive insights, a significant technological advancement.
However, the industry faces substantial barriers and challenges. The high cost of implementing and maintaining sophisticated ITOA solutions can be a deterrent for small and medium-sized businesses (SMBs). A significant talent gap exists, with a shortage of skilled professionals capable of effectively utilizing and interpreting complex ITOA data. Data silos and integration complexities across diverse IT systems can hinder the delivery of unified insights. Regulatory compliance requirements, particularly concerning data privacy and security, add another layer of complexity. Competitive pressures from established players and emerging niche vendors also create a challenging market environment.
Emerging Opportunities in IT Operation Analytics Industry
Emerging opportunities within the IT Operation Analytics industry are ripe for exploitation. The burgeoning field of AIOps (Artificial Intelligence for IT Operations) presents a significant avenue for growth, with advanced AI/ML capabilities enabling hyper-automation of IT tasks and predictive maintenance. The expansion of edge computing and IoT devices creates a demand for specialized ITOA solutions capable of monitoring and managing distributed environments. Furthermore, the increasing focus on observability, which encompasses logs, metrics, and traces, offers a chance for vendors to provide holistic visibility into complex application architectures. Growing adoption of containerized environments (e.g., Kubernetes) also requires tailored ITOA solutions for monitoring microservices and container orchestration.
Growth Accelerators in the IT Operation Analytics Industry Industry
Several factors are accelerating the long-term growth of the IT Operation Analytics industry. The pervasive digital transformation initiatives across all sectors are creating an insatiable demand for tools that ensure operational efficiency and reliability. Strategic partnerships between ITOA vendors and cloud providers, as well as ITSM solution providers, are expanding market reach and enhancing product integration. The continuous evolution of AI and ML technologies, leading to more sophisticated predictive analytics and automated remediation capabilities, is a key accelerator. Furthermore, the increasing adoption of hybrid and multi-cloud strategies by enterprises necessitates robust ITOA solutions that can provide unified visibility across disparate environments. The growing emphasis on proactive IT management and the pursuit of business agility are further fueling market expansion.
Key Players Shaping the IT Operation Analytics Industry Market
- INETCO Systems Limited
- WNS (Holdings) Limited
- OpsDataStore Inc
- Evolven Software Inc
- XpoLog Ltd
- Micro Focus International PLC (HPE Software BU)
- CA Technology Inc (Broadcom Inc )
- IBM Corp
- BMC Software Inc
- Oracle Corp
- Interlink Software Services Ltd
- VMware Inc
- Splunk Inc
Notable Milestones in IT Operation Analytics Industry Sector
- 2019: Increased adoption of AI/ML in ITOA for predictive analytics begins to gain traction.
- 2020: Rise of observability platforms integrating logs, metrics, and traces, expanding beyond traditional monitoring.
- 2021: Significant M&A activity as larger vendors acquire specialized ITOA and AIOps companies to bolster their capabilities.
- 2022: Growing demand for cloud-native ITOA solutions to manage complex hybrid and multi-cloud environments.
- 2023: Enhanced focus on end-user experience monitoring (EUEM) as a critical component of ITOA.
- 2024: Maturation of AIOps platforms, moving towards automated root cause analysis and self-healing capabilities.
In-Depth IT Operation Analytics Industry Market Outlook
The IT Operation Analytics industry is poised for sustained and robust growth, driven by the accelerating pace of digital transformation and the increasing complexity of IT infrastructures. Key growth accelerators, including advancements in AI/ML, the rise of AIOps, and the pervasive adoption of cloud technologies, will continue to shape the market landscape. The industry's future lies in delivering increasingly intelligent, automated, and proactive solutions that empower organizations to not only monitor but also optimize their IT operations for peak performance and resilience. Strategic partnerships and ongoing product innovation will be crucial for vendors to capture market share. The outlook is exceptionally positive, with significant opportunities for companies offering comprehensive visibility and actionable insights across hybrid and multi-cloud environments, ensuring businesses can navigate the digital age with confidence.
IT Operation Analytics Industry Segmentation
-
1. Deployment
- 1.1. Cloud Based
- 1.2. On-premise
-
2. Application
- 2.1. Application Monitoring
- 2.2. Business & IT Services Monitoring
- 2.3. Infrastructure Monitoring
- 2.4. Other Applications
-
3. End-user Industry
- 3.1. BFSI
- 3.2. Healthcare
- 3.3. Telecommunication
- 3.4. Retail
- 3.5. Industrial
- 3.6. Other End-user Industries
IT Operation Analytics Industry Segmentation By Geography
- 1. North America
- 2. Europe
- 3. Asia Pacific
- 4. Rest of the World
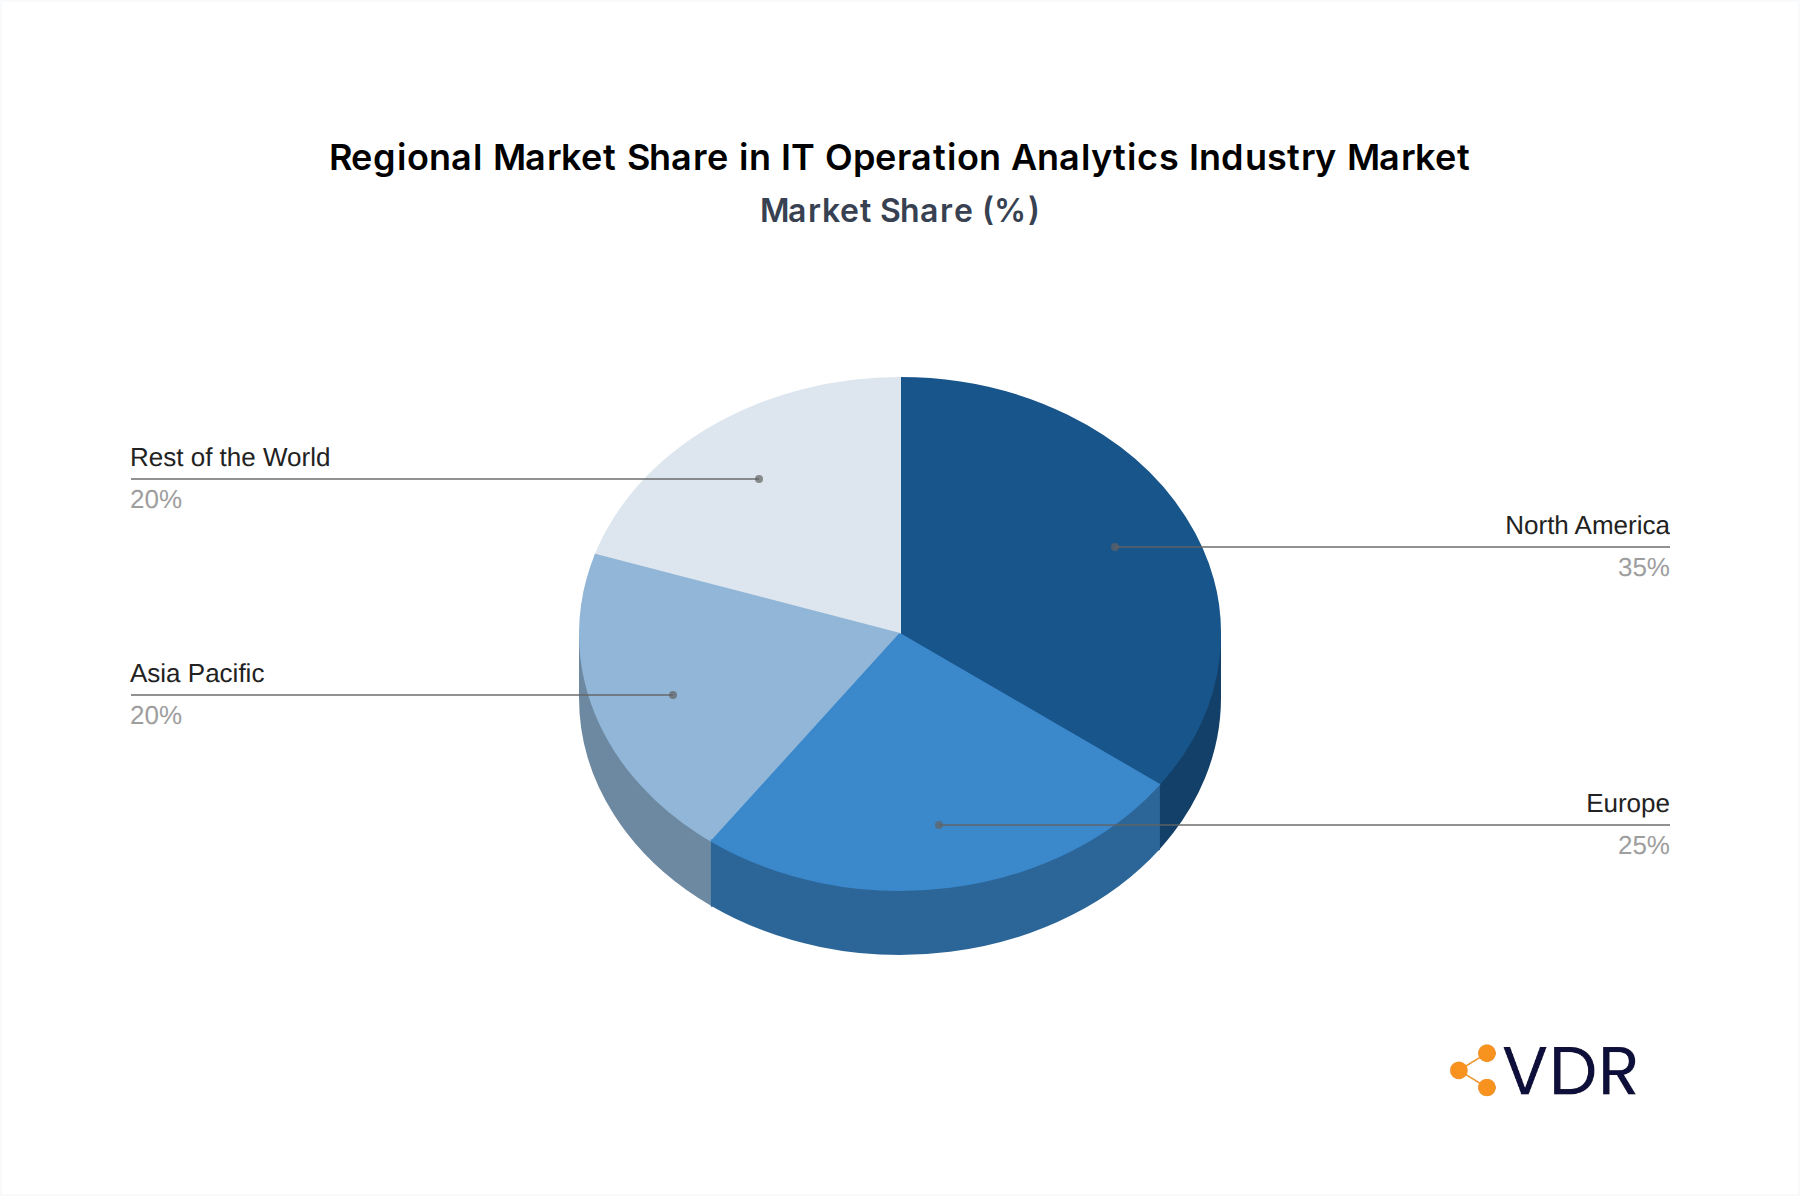
IT Operation Analytics Industry Regional Market Share
Geographic Coverage of IT Operation Analytics Industry
IT Operation Analytics Industry REPORT HIGHLIGHTS
| Aspects | Details |
|---|---|
| Study Period | 2020-2034 |
| Base Year | 2025 |
| Estimated Year | 2026 |
| Forecast Period | 2026-2034 |
| Historical Period | 2020-2025 |
| Growth Rate | CAGR of 22.6% from 2020-2034 |
| Segmentation |
|
Table of Contents
- 1. Introduction
- 1.1. Research Scope
- 1.2. Market Segmentation
- 1.3. Research Objective
- 1.4. Definitions and Assumptions
- 2. Executive Summary
- 2.1. Market Snapshot
- 3. Market Dynamics
- 3.1. Market Drivers
- 3.2. Market Restrains
- 3.3. Market Trends
- 3.4. Market Opportunities
- 4. Market Factor Analysis
- 4.1. Porters Five Forces
- 4.1.1. Bargaining Power of Suppliers
- 4.1.2. Bargaining Power of Buyers
- 4.1.3. Threat of New Entrants
- 4.1.4. Threat of Substitutes
- 4.1.5. Competitive Rivalry
- 4.2. PESTEL analysis
- 4.3. BCG Analysis
- 4.3.1. Stars (High Growth, High Market Share)
- 4.3.2. Cash Cows (Low Growth, High Market Share)
- 4.3.3. Question Mark (High Growth, Low Market Share)
- 4.3.4. Dogs (Low Growth, Low Market Share)
- 4.4. Ansoff Matrix Analysis
- 4.5. Supply Chain Analysis
- 4.6. Regulatory Landscape
- 4.7. Current Market Potential and Opportunity Assessment (TAM–SAM–SOM Framework)
- 4.8. VDR Analyst Note
- 4.1. Porters Five Forces
- 5. Market Analysis, Insights and Forecast 2021-2033
- 5.1. Market Analysis, Insights and Forecast - by Deployment
- 5.1.1. Cloud Based
- 5.1.2. On-premise
- 5.2. Market Analysis, Insights and Forecast - by Application
- 5.2.1. Application Monitoring
- 5.2.2. Business & IT Services Monitoring
- 5.2.3. Infrastructure Monitoring
- 5.2.4. Other Applications
- 5.3. Market Analysis, Insights and Forecast - by End-user Industry
- 5.3.1. BFSI
- 5.3.2. Healthcare
- 5.3.3. Telecommunication
- 5.3.4. Retail
- 5.3.5. Industrial
- 5.3.6. Other End-user Industries
- 5.4. Market Analysis, Insights and Forecast - by Region
- 5.4.1. North America
- 5.4.2. Europe
- 5.4.3. Asia Pacific
- 5.4.4. Rest of the World
- 5.1. Market Analysis, Insights and Forecast - by Deployment
- 6. Global IT Operation Analytics Industry Analysis, Insights and Forecast, 2021-2033
- 6.1. Market Analysis, Insights and Forecast - by Deployment
- 6.1.1. Cloud Based
- 6.1.2. On-premise
- 6.2. Market Analysis, Insights and Forecast - by Application
- 6.2.1. Application Monitoring
- 6.2.2. Business & IT Services Monitoring
- 6.2.3. Infrastructure Monitoring
- 6.2.4. Other Applications
- 6.3. Market Analysis, Insights and Forecast - by End-user Industry
- 6.3.1. BFSI
- 6.3.2. Healthcare
- 6.3.3. Telecommunication
- 6.3.4. Retail
- 6.3.5. Industrial
- 6.3.6. Other End-user Industries
- 6.1. Market Analysis, Insights and Forecast - by Deployment
- 7. North America IT Operation Analytics Industry Analysis, Insights and Forecast, 2021-2033
- 7.1. Market Analysis, Insights and Forecast - by Deployment
- 7.1.1. Cloud Based
- 7.1.2. On-premise
- 7.2. Market Analysis, Insights and Forecast - by Application
- 7.2.1. Application Monitoring
- 7.2.2. Business & IT Services Monitoring
- 7.2.3. Infrastructure Monitoring
- 7.2.4. Other Applications
- 7.3. Market Analysis, Insights and Forecast - by End-user Industry
- 7.3.1. BFSI
- 7.3.2. Healthcare
- 7.3.3. Telecommunication
- 7.3.4. Retail
- 7.3.5. Industrial
- 7.3.6. Other End-user Industries
- 7.1. Market Analysis, Insights and Forecast - by Deployment
- 8. Europe IT Operation Analytics Industry Analysis, Insights and Forecast, 2021-2033
- 8.1. Market Analysis, Insights and Forecast - by Deployment
- 8.1.1. Cloud Based
- 8.1.2. On-premise
- 8.2. Market Analysis, Insights and Forecast - by Application
- 8.2.1. Application Monitoring
- 8.2.2. Business & IT Services Monitoring
- 8.2.3. Infrastructure Monitoring
- 8.2.4. Other Applications
- 8.3. Market Analysis, Insights and Forecast - by End-user Industry
- 8.3.1. BFSI
- 8.3.2. Healthcare
- 8.3.3. Telecommunication
- 8.3.4. Retail
- 8.3.5. Industrial
- 8.3.6. Other End-user Industries
- 8.1. Market Analysis, Insights and Forecast - by Deployment
- 9. Asia Pacific IT Operation Analytics Industry Analysis, Insights and Forecast, 2021-2033
- 9.1. Market Analysis, Insights and Forecast - by Deployment
- 9.1.1. Cloud Based
- 9.1.2. On-premise
- 9.2. Market Analysis, Insights and Forecast - by Application
- 9.2.1. Application Monitoring
- 9.2.2. Business & IT Services Monitoring
- 9.2.3. Infrastructure Monitoring
- 9.2.4. Other Applications
- 9.3. Market Analysis, Insights and Forecast - by End-user Industry
- 9.3.1. BFSI
- 9.3.2. Healthcare
- 9.3.3. Telecommunication
- 9.3.4. Retail
- 9.3.5. Industrial
- 9.3.6. Other End-user Industries
- 9.1. Market Analysis, Insights and Forecast - by Deployment
- 10. Rest of the World IT Operation Analytics Industry Analysis, Insights and Forecast, 2021-2033
- 10.1. Market Analysis, Insights and Forecast - by Deployment
- 10.1.1. Cloud Based
- 10.1.2. On-premise
- 10.2. Market Analysis, Insights and Forecast - by Application
- 10.2.1. Application Monitoring
- 10.2.2. Business & IT Services Monitoring
- 10.2.3. Infrastructure Monitoring
- 10.2.4. Other Applications
- 10.3. Market Analysis, Insights and Forecast - by End-user Industry
- 10.3.1. BFSI
- 10.3.2. Healthcare
- 10.3.3. Telecommunication
- 10.3.4. Retail
- 10.3.5. Industrial
- 10.3.6. Other End-user Industries
- 10.1. Market Analysis, Insights and Forecast - by Deployment
- 11. Competitive Analysis
- 11.1. Company Profiles
- 11.1.1 INETCO Systems Limited
- 11.1.1.1. Company Overview
- 11.1.1.2. Products
- 11.1.1.3. Company Financials
- 11.1.1.4. SWOT Analysis
- 11.1.2 WNS (Holdings) Limited*List Not Exhaustive
- 11.1.2.1. Company Overview
- 11.1.2.2. Products
- 11.1.2.3. Company Financials
- 11.1.2.4. SWOT Analysis
- 11.1.3 OpsDataStore Inc
- 11.1.3.1. Company Overview
- 11.1.3.2. Products
- 11.1.3.3. Company Financials
- 11.1.3.4. SWOT Analysis
- 11.1.4 Evolven Software Inc
- 11.1.4.1. Company Overview
- 11.1.4.2. Products
- 11.1.4.3. Company Financials
- 11.1.4.4. SWOT Analysis
- 11.1.5 XpoLog Ltd
- 11.1.5.1. Company Overview
- 11.1.5.2. Products
- 11.1.5.3. Company Financials
- 11.1.5.4. SWOT Analysis
- 11.1.6 Micro Focus International PLC (HPE Software BU)
- 11.1.6.1. Company Overview
- 11.1.6.2. Products
- 11.1.6.3. Company Financials
- 11.1.6.4. SWOT Analysis
- 11.1.7 CA Technology Inc (Broadcom Inc )
- 11.1.7.1. Company Overview
- 11.1.7.2. Products
- 11.1.7.3. Company Financials
- 11.1.7.4. SWOT Analysis
- 11.1.8 IBM Corp
- 11.1.8.1. Company Overview
- 11.1.8.2. Products
- 11.1.8.3. Company Financials
- 11.1.8.4. SWOT Analysis
- 11.1.9 BMC Software Inc
- 11.1.9.1. Company Overview
- 11.1.9.2. Products
- 11.1.9.3. Company Financials
- 11.1.9.4. SWOT Analysis
- 11.1.10 Oracle Corp
- 11.1.10.1. Company Overview
- 11.1.10.2. Products
- 11.1.10.3. Company Financials
- 11.1.10.4. SWOT Analysis
- 11.1.11 Interlink Software Services Ltd
- 11.1.11.1. Company Overview
- 11.1.11.2. Products
- 11.1.11.3. Company Financials
- 11.1.11.4. SWOT Analysis
- 11.1.12 VMware Inc
- 11.1.12.1. Company Overview
- 11.1.12.2. Products
- 11.1.12.3. Company Financials
- 11.1.12.4. SWOT Analysis
- 11.1.13 Splunk Inc
- 11.1.13.1. Company Overview
- 11.1.13.2. Products
- 11.1.13.3. Company Financials
- 11.1.13.4. SWOT Analysis
- 11.1.1 INETCO Systems Limited
- 11.2. Market Entropy
- 11.2.1 Company's Key Areas Served
- 11.2.2 Recent Developments
- 11.3. Company Market Share Analysis 2025
- 11.3.1 Top 5 Companies Market Share Analysis
- 11.3.2 Top 3 Companies Market Share Analysis
- 11.4. List of Potential Customers
- 12. Research Methodology
List of Figures
- Figure 1: Global IT Operation Analytics Industry Revenue Breakdown (billion, %) by Region 2025 & 2033
- Figure 2: North America IT Operation Analytics Industry Revenue (billion), by Deployment 2025 & 2033
- Figure 3: North America IT Operation Analytics Industry Revenue Share (%), by Deployment 2025 & 2033
- Figure 4: North America IT Operation Analytics Industry Revenue (billion), by Application 2025 & 2033
- Figure 5: North America IT Operation Analytics Industry Revenue Share (%), by Application 2025 & 2033
- Figure 6: North America IT Operation Analytics Industry Revenue (billion), by End-user Industry 2025 & 2033
- Figure 7: North America IT Operation Analytics Industry Revenue Share (%), by End-user Industry 2025 & 2033
- Figure 8: North America IT Operation Analytics Industry Revenue (billion), by Country 2025 & 2033
- Figure 9: North America IT Operation Analytics Industry Revenue Share (%), by Country 2025 & 2033
- Figure 10: Europe IT Operation Analytics Industry Revenue (billion), by Deployment 2025 & 2033
- Figure 11: Europe IT Operation Analytics Industry Revenue Share (%), by Deployment 2025 & 2033
- Figure 12: Europe IT Operation Analytics Industry Revenue (billion), by Application 2025 & 2033
- Figure 13: Europe IT Operation Analytics Industry Revenue Share (%), by Application 2025 & 2033
- Figure 14: Europe IT Operation Analytics Industry Revenue (billion), by End-user Industry 2025 & 2033
- Figure 15: Europe IT Operation Analytics Industry Revenue Share (%), by End-user Industry 2025 & 2033
- Figure 16: Europe IT Operation Analytics Industry Revenue (billion), by Country 2025 & 2033
- Figure 17: Europe IT Operation Analytics Industry Revenue Share (%), by Country 2025 & 2033
- Figure 18: Asia Pacific IT Operation Analytics Industry Revenue (billion), by Deployment 2025 & 2033
- Figure 19: Asia Pacific IT Operation Analytics Industry Revenue Share (%), by Deployment 2025 & 2033
- Figure 20: Asia Pacific IT Operation Analytics Industry Revenue (billion), by Application 2025 & 2033
- Figure 21: Asia Pacific IT Operation Analytics Industry Revenue Share (%), by Application 2025 & 2033
- Figure 22: Asia Pacific IT Operation Analytics Industry Revenue (billion), by End-user Industry 2025 & 2033
- Figure 23: Asia Pacific IT Operation Analytics Industry Revenue Share (%), by End-user Industry 2025 & 2033
- Figure 24: Asia Pacific IT Operation Analytics Industry Revenue (billion), by Country 2025 & 2033
- Figure 25: Asia Pacific IT Operation Analytics Industry Revenue Share (%), by Country 2025 & 2033
- Figure 26: Rest of the World IT Operation Analytics Industry Revenue (billion), by Deployment 2025 & 2033
- Figure 27: Rest of the World IT Operation Analytics Industry Revenue Share (%), by Deployment 2025 & 2033
- Figure 28: Rest of the World IT Operation Analytics Industry Revenue (billion), by Application 2025 & 2033
- Figure 29: Rest of the World IT Operation Analytics Industry Revenue Share (%), by Application 2025 & 2033
- Figure 30: Rest of the World IT Operation Analytics Industry Revenue (billion), by End-user Industry 2025 & 2033
- Figure 31: Rest of the World IT Operation Analytics Industry Revenue Share (%), by End-user Industry 2025 & 2033
- Figure 32: Rest of the World IT Operation Analytics Industry Revenue (billion), by Country 2025 & 2033
- Figure 33: Rest of the World IT Operation Analytics Industry Revenue Share (%), by Country 2025 & 2033
List of Tables
- Table 1: Global IT Operation Analytics Industry Revenue billion Forecast, by Deployment 2020 & 2033
- Table 2: Global IT Operation Analytics Industry Revenue billion Forecast, by Application 2020 & 2033
- Table 3: Global IT Operation Analytics Industry Revenue billion Forecast, by End-user Industry 2020 & 2033
- Table 4: Global IT Operation Analytics Industry Revenue billion Forecast, by Region 2020 & 2033
- Table 5: Global IT Operation Analytics Industry Revenue billion Forecast, by Deployment 2020 & 2033
- Table 6: Global IT Operation Analytics Industry Revenue billion Forecast, by Application 2020 & 2033
- Table 7: Global IT Operation Analytics Industry Revenue billion Forecast, by End-user Industry 2020 & 2033
- Table 8: Global IT Operation Analytics Industry Revenue billion Forecast, by Country 2020 & 2033
- Table 9: Global IT Operation Analytics Industry Revenue billion Forecast, by Deployment 2020 & 2033
- Table 10: Global IT Operation Analytics Industry Revenue billion Forecast, by Application 2020 & 2033
- Table 11: Global IT Operation Analytics Industry Revenue billion Forecast, by End-user Industry 2020 & 2033
- Table 12: Global IT Operation Analytics Industry Revenue billion Forecast, by Country 2020 & 2033
- Table 13: Global IT Operation Analytics Industry Revenue billion Forecast, by Deployment 2020 & 2033
- Table 14: Global IT Operation Analytics Industry Revenue billion Forecast, by Application 2020 & 2033
- Table 15: Global IT Operation Analytics Industry Revenue billion Forecast, by End-user Industry 2020 & 2033
- Table 16: Global IT Operation Analytics Industry Revenue billion Forecast, by Country 2020 & 2033
- Table 17: Global IT Operation Analytics Industry Revenue billion Forecast, by Deployment 2020 & 2033
- Table 18: Global IT Operation Analytics Industry Revenue billion Forecast, by Application 2020 & 2033
- Table 19: Global IT Operation Analytics Industry Revenue billion Forecast, by End-user Industry 2020 & 2033
- Table 20: Global IT Operation Analytics Industry Revenue billion Forecast, by Country 2020 & 2033
Frequently Asked Questions
1. What is the projected Compound Annual Growth Rate (CAGR) of the IT Operation Analytics Industry?
The projected CAGR is approximately 22.6%.
2. Which companies are prominent players in the IT Operation Analytics Industry?
Key companies in the market include INETCO Systems Limited, WNS (Holdings) Limited*List Not Exhaustive, OpsDataStore Inc, Evolven Software Inc, XpoLog Ltd, Micro Focus International PLC (HPE Software BU), CA Technology Inc (Broadcom Inc ), IBM Corp, BMC Software Inc, Oracle Corp, Interlink Software Services Ltd, VMware Inc, Splunk Inc.
3. What are the main segments of the IT Operation Analytics Industry?
The market segments include Deployment, Application, End-user Industry.
4. Can you provide details about the market size?
The market size is estimated to be USD 13.16 billion as of 2022.
5. What are some drivers contributing to market growth?
; Rising Growth of Cloud Adoption Among the ITes; Rising Demand for Analytics across Various Segments of End-user Industries.
6. What are the notable trends driving market growth?
Industrial Sector is Gaining Traction Due to Emergence of ITOA Across Cloud-Based Platform.
7. Are there any restraints impacting market growth?
; Initial Investment in Toolsets in terms of Data and Human-Machine Interaction.
8. Can you provide examples of recent developments in the market?
N/A
9. What pricing options are available for accessing the report?
Pricing options include single-user, multi-user, and enterprise licenses priced at USD 4750, USD 5250, and USD 8750 respectively.
10. Is the market size provided in terms of value or volume?
The market size is provided in terms of value, measured in billion.
11. Are there any specific market keywords associated with the report?
Yes, the market keyword associated with the report is "IT Operation Analytics Industry," which aids in identifying and referencing the specific market segment covered.
12. How do I determine which pricing option suits my needs best?
The pricing options vary based on user requirements and access needs. Individual users may opt for single-user licenses, while businesses requiring broader access may choose multi-user or enterprise licenses for cost-effective access to the report.
13. Are there any additional resources or data provided in the IT Operation Analytics Industry report?
While the report offers comprehensive insights, it's advisable to review the specific contents or supplementary materials provided to ascertain if additional resources or data are available.
14. How can I stay updated on further developments or reports in the IT Operation Analytics Industry?
To stay informed about further developments, trends, and reports in the IT Operation Analytics Industry, consider subscribing to industry newsletters, following relevant companies and organizations, or regularly checking reputable industry news sources and publications.
Methodology
Step 1 - Identification of Relevant Samples Size from Population Database


Step 2 - Approaches for Defining Global Market Size (Value, Volume* & Price*)

Note*: In applicable scenarios
Step 3 - Data Sources
Primary Research
- Web Analytics
- Survey Reports
- Research Institute
- Latest Research Reports
- Opinion Leaders
Secondary Research
- Annual Reports
- White Paper
- Latest Press Release
- Industry Association
- Paid Database
- Investor Presentations

Step 4 - Data Triangulation
Involves using different sources of information in order to increase the validity of a study
These sources are likely to be stakeholders in a program - participants, other researchers, program staff, other community members, and so on.
Then we put all data in single framework & apply various statistical tools to find out the dynamic on the market.
During the analysis stage, feedback from the stakeholder groups would be compared to determine areas of agreement as well as areas of divergence