

Key Insights
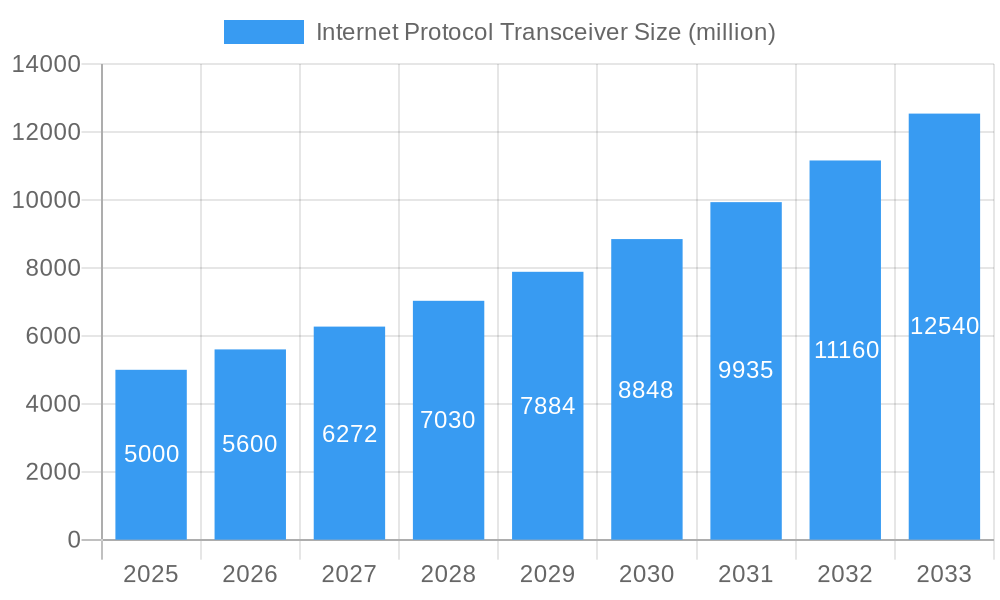
The Internet Protocol (IP) transceiver market is experiencing robust growth, driven by the increasing demand for high-speed data transmission and the proliferation of network-connected devices across various sectors. The market, estimated at $5 billion in 2025, is projected to exhibit a Compound Annual Growth Rate (CAGR) of 12% from 2025 to 2033, reaching approximately $12 billion by 2033. This growth is fueled by several key factors, including the expanding adoption of 5G and other advanced wireless technologies, the surging popularity of cloud computing and data centers, and the rising need for reliable and efficient communication in industrial automation and IoT applications. Key players like Legrand North America, PureLink, and Advantech are strategically positioning themselves to capitalize on this market expansion through product innovation and strategic partnerships.
Internet Protocol Transceiver Market Size (In Billion)
The market segmentation reveals a strong preference for high-bandwidth transceivers capable of supporting demanding applications. Geographical expansion is also a significant driver, with North America and Europe currently holding the largest market shares. However, the Asia-Pacific region is expected to witness the fastest growth due to the rapid development of its infrastructure and the increasing adoption of IP-based technologies in various industries. While potential restraints such as the high initial investment costs and the complexity of integration could impact growth, ongoing technological advancements and increasing government investments in infrastructure are likely to mitigate these challenges. Future market trends suggest a greater emphasis on energy efficiency, improved security protocols, and the integration of artificial intelligence for optimized network management.
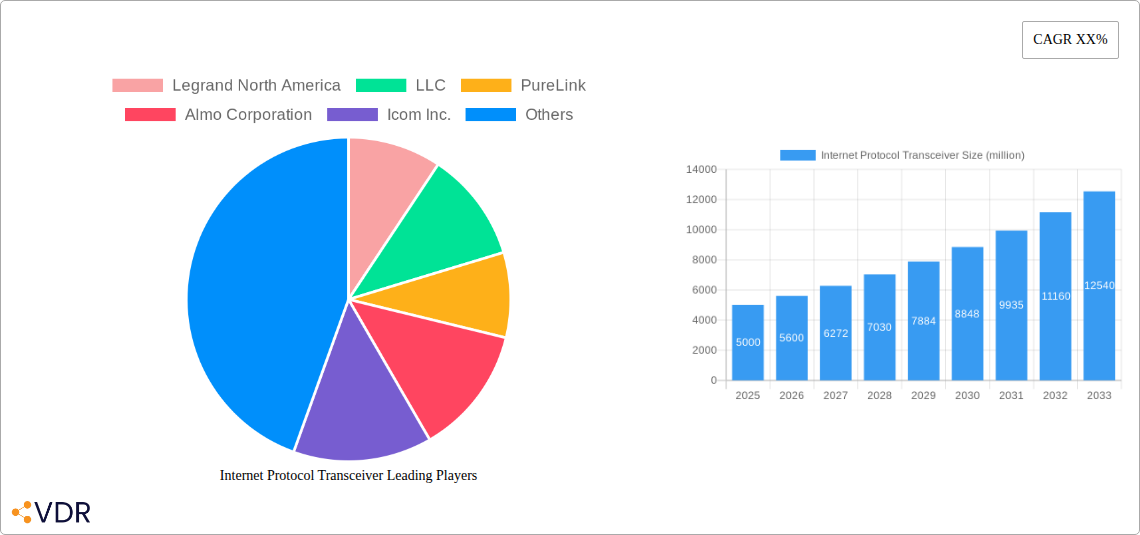
Internet Protocol Transceiver Company Market Share
Internet Protocol Transceiver Market Report: 2019-2033
This comprehensive report provides an in-depth analysis of the Internet Protocol Transceiver market, encompassing market dynamics, growth trends, regional dominance, product landscape, key players, and future outlook. The study period spans from 2019 to 2033, with 2025 serving as the base and estimated year. The forecast period is 2025-2033, and the historical period covers 2019-2024. The report targets industry professionals, investors, and market researchers seeking a thorough understanding of this rapidly evolving sector. The parent market is Data Communication Equipment and the child market is Network Interface Cards. The total market size in 2025 is estimated at xx million units.
Internet Protocol Transceiver Market Dynamics & Structure
The Internet Protocol Transceiver market exhibits a moderately concentrated structure, with a few major players holding significant market share. Technological innovation, particularly in high-speed data transmission and low-power consumption, is a key driver. Regulatory frameworks, including standards compliance and cybersecurity regulations, significantly influence market dynamics. Competitive product substitutes, such as dedicated network interfaces, exist but often lack the versatility and cost-effectiveness of IP transceivers. The end-user demographics are diverse, spanning various industries, including telecommunications, data centers, industrial automation, and consumer electronics. M&A activity in the sector has been moderate in recent years, with xx major deals recorded between 2019 and 2024.
- Market Concentration: Moderately concentrated, with the top 5 players holding approximately xx% of the market share in 2025.
- Technological Innovation Drivers: Advancements in signal processing, power efficiency, and miniaturization.
- Regulatory Frameworks: Compliance with standards like IEEE 802.3 and adherence to cybersecurity protocols.
- Competitive Product Substitutes: Dedicated network interfaces pose a limited threat due to higher cost and reduced flexibility.
- End-User Demographics: Telecommunications, data centers, industrial automation, and consumer electronics.
- M&A Trends: Moderate activity, with xx major mergers and acquisitions recorded between 2019 and 2024.
Internet Protocol Transceiver Growth Trends & Insights
The Internet Protocol Transceiver market experienced robust growth during the historical period (2019-2024), with a CAGR of xx%. This growth is primarily attributed to the increasing demand for high-bandwidth data transmission, driven by the proliferation of connected devices and the growth of cloud computing. Technological disruptions, such as the emergence of 5G and advancements in optical communication technologies, are further accelerating market expansion. Consumer behavior shifts towards increased reliance on data-intensive applications and services fuel this demand. Market penetration in key sectors, such as data centers, continues to increase, further supporting market growth. The forecast period (2025-2033) anticipates a continued, albeit slightly moderated, expansion with a projected CAGR of xx%, reaching an estimated xx million units by 2033.
Dominant Regions, Countries, or Segments in Internet Protocol Transceiver
North America currently holds the leading position in the Internet Protocol Transceiver market, followed by Europe and Asia-Pacific. The dominance of North America is driven by robust technological advancements, a well-established telecommunications infrastructure, and significant investments in data center expansion. Specific countries like the US and Canada showcase exceptionally strong growth due to technological advancements and high adoption rates within the industrial and consumer sectors. The growth in Asia-Pacific is fuelled by increasing government initiatives promoting digital infrastructure development, rapid industrialization, and a burgeoning consumer electronics market.
- Key Drivers for North America: Strong technological innovation, advanced infrastructure, and high data center density.
- Key Drivers for Europe: Growing adoption of IoT and smart city initiatives.
- Key Drivers for Asia-Pacific: Rapid economic growth, increasing investments in telecommunication infrastructure, and a rising demand for connected devices.
- Market Share: North America holds approximately xx% of the global market share in 2025, while Europe and Asia-Pacific account for xx% and xx%, respectively.
Internet Protocol Transceiver Product Landscape
The Internet Protocol Transceiver market encompasses a diverse range of products, varying in data rates, power consumption, and interface types. Recent innovations focus on higher speeds (e.g., 400 Gigabit Ethernet), reduced power consumption, and improved signal integrity. Key applications include Ethernet networking, optical communication, and industrial control systems. The unique selling propositions of these transceivers often center around their ability to offer high performance while maintaining compatibility with existing standards. Ongoing technological advancements are continually pushing the boundaries of speed and efficiency.
Key Drivers, Barriers & Challenges in Internet Protocol Transceiver
Key Drivers: The increasing demand for high-bandwidth data transmission in various applications (cloud computing, IoT, 5G) is the primary driver. Technological advancements, such as higher data rates and lower power consumption, further stimulate market growth. Favorable government policies and investments in infrastructure also play a significant role.
Key Challenges: Supply chain disruptions, particularly concerning semiconductor components, pose a major challenge. Stringent regulatory requirements and the increasing need for cybersecurity measures also present obstacles. Intense competition from established and emerging players adds pressure on pricing and profitability. These challenges could lead to a xx% reduction in market growth if not adequately addressed.
Emerging Opportunities in Internet Protocol Transceiver
Untapped markets in developing economies present significant growth opportunities. Innovative applications in areas such as autonomous vehicles and industrial automation offer new avenues for expansion. Evolving consumer preferences towards high-speed internet and advanced connectivity create sustained demand for superior IP transceivers. The integration of AI and machine learning into transceiver design presents a promising opportunity.
Growth Accelerators in the Internet Protocol Transceiver Industry
Technological breakthroughs in high-speed data transmission, such as the development of coherent optical technology and silicon photonics, significantly accelerate market growth. Strategic partnerships between transceiver manufacturers and network equipment providers foster market expansion. Expansion into emerging markets and the development of specialized solutions for niche applications contribute to long-term market growth.
Key Players Shaping the Internet Protocol Transceiver Market
- Legrand North America, LLC
- PureLink
- Almo Corporation
- Icom Inc.
- Red Pitaya
- IEI Integration Corp.
- Advantech Co., Ltd.
- Shenzhen Safe Guard
- DND TELECOM CENTER Ltd
- Emerald X, LLC
Notable Milestones in Internet Protocol Transceiver Sector
- 2020, Q3: Introduction of the first 800G Ethernet transceiver by [Company Name].
- 2021, Q1: Strategic partnership between [Company Name] and [Company Name] to develop advanced optical transceivers.
- 2022, Q4: Acquisition of [Company Name] by [Company Name], expanding market reach.
- 2023, Q2: Release of the industry's first AI-powered IP transceiver by [Company Name]
In-Depth Internet Protocol Transceiver Market Outlook
The future of the Internet Protocol Transceiver market remains positive, fueled by persistent demand for high-bandwidth connectivity and technological advancements. Strategic opportunities lie in exploring emerging applications, expanding into untapped markets, and fostering collaborations within the industry. The market's continued growth is anticipated, driven by the increasing adoption of 5G, the rise of cloud computing, and the pervasive deployment of IoT devices. The market's strong fundamentals position it for sustained expansion throughout the forecast period.
Internet Protocol Transceiver Segmentation
-
1. Application
- 1.1. Industrial
- 1.2. Commercial
- 1.3. Municipal
- 1.4. Others
-
2. Types
- 2.1. Wired Transceiver
- 2.2. Wireless Transceiver
Internet Protocol Transceiver Segmentation By Geography
-
1. North America
- 1.1. United States
- 1.2. Canada
- 1.3. Mexico
-
2. South America
- 2.1. Brazil
- 2.2. Argentina
- 2.3. Rest of South America
-
3. Europe
- 3.1. United Kingdom
- 3.2. Germany
- 3.3. France
- 3.4. Italy
- 3.5. Spain
- 3.6. Russia
- 3.7. Benelux
- 3.8. Nordics
- 3.9. Rest of Europe
-
4. Middle East & Africa
- 4.1. Turkey
- 4.2. Israel
- 4.3. GCC
- 4.4. North Africa
- 4.5. South Africa
- 4.6. Rest of Middle East & Africa
-
5. Asia Pacific
- 5.1. China
- 5.2. India
- 5.3. Japan
- 5.4. South Korea
- 5.5. ASEAN
- 5.6. Oceania
- 5.7. Rest of Asia Pacific

Internet Protocol Transceiver Regional Market Share
Geographic Coverage of Internet Protocol Transceiver
Internet Protocol Transceiver REPORT HIGHLIGHTS
| Aspects | Details |
|---|---|
| Study Period | 2020-2034 |
| Base Year | 2025 |
| Estimated Year | 2026 |
| Forecast Period | 2026-2034 |
| Historical Period | 2020-2025 |
| Growth Rate | CAGR of XX% from 2020-2034 |
| Segmentation |
|
Table of Contents
- 1. Introduction
- 1.1. Research Scope
- 1.2. Market Segmentation
- 1.3. Research Objective
- 1.4. Definitions and Assumptions
- 2. Executive Summary
- 2.1. Market Snapshot
- 3. Market Dynamics
- 3.1. Market Drivers
- 3.2. Market Restrains
- 3.3. Market Trends
- 3.4. Market Opportunities
- 4. Market Factor Analysis
- 4.1. Porters Five Forces
- 4.1.1. Bargaining Power of Suppliers
- 4.1.2. Bargaining Power of Buyers
- 4.1.3. Threat of New Entrants
- 4.1.4. Threat of Substitutes
- 4.1.5. Competitive Rivalry
- 4.2. PESTEL analysis
- 4.3. BCG Analysis
- 4.3.1. Stars (High Growth, High Market Share)
- 4.3.2. Cash Cows (Low Growth, High Market Share)
- 4.3.3. Question Mark (High Growth, Low Market Share)
- 4.3.4. Dogs (Low Growth, Low Market Share)
- 4.4. Ansoff Matrix Analysis
- 4.5. Supply Chain Analysis
- 4.6. Regulatory Landscape
- 4.7. Current Market Potential and Opportunity Assessment (TAM–SAM–SOM Framework)
- 4.8. VDR Analyst Note
- 4.1. Porters Five Forces
- 5. Market Analysis, Insights and Forecast 2021-2033
- 5.1. Market Analysis, Insights and Forecast - by Application
- 5.1.1. Industrial
- 5.1.2. Commercial
- 5.1.3. Municipal
- 5.1.4. Others
- 5.2. Market Analysis, Insights and Forecast - by Types
- 5.2.1. Wired Transceiver
- 5.2.2. Wireless Transceiver
- 5.3. Market Analysis, Insights and Forecast - by Region
- 5.3.1. North America
- 5.3.2. South America
- 5.3.3. Europe
- 5.3.4. Middle East & Africa
- 5.3.5. Asia Pacific
- 5.1. Market Analysis, Insights and Forecast - by Application
- 6. Global Internet Protocol Transceiver Analysis, Insights and Forecast, 2021-2033
- 6.1. Market Analysis, Insights and Forecast - by Application
- 6.1.1. Industrial
- 6.1.2. Commercial
- 6.1.3. Municipal
- 6.1.4. Others
- 6.2. Market Analysis, Insights and Forecast - by Types
- 6.2.1. Wired Transceiver
- 6.2.2. Wireless Transceiver
- 6.1. Market Analysis, Insights and Forecast - by Application
- 7. North America Internet Protocol Transceiver Analysis, Insights and Forecast, 2021-2033
- 7.1. Market Analysis, Insights and Forecast - by Application
- 7.1.1. Industrial
- 7.1.2. Commercial
- 7.1.3. Municipal
- 7.1.4. Others
- 7.2. Market Analysis, Insights and Forecast - by Types
- 7.2.1. Wired Transceiver
- 7.2.2. Wireless Transceiver
- 7.1. Market Analysis, Insights and Forecast - by Application
- 8. South America Internet Protocol Transceiver Analysis, Insights and Forecast, 2021-2033
- 8.1. Market Analysis, Insights and Forecast - by Application
- 8.1.1. Industrial
- 8.1.2. Commercial
- 8.1.3. Municipal
- 8.1.4. Others
- 8.2. Market Analysis, Insights and Forecast - by Types
- 8.2.1. Wired Transceiver
- 8.2.2. Wireless Transceiver
- 8.1. Market Analysis, Insights and Forecast - by Application
- 9. Europe Internet Protocol Transceiver Analysis, Insights and Forecast, 2021-2033
- 9.1. Market Analysis, Insights and Forecast - by Application
- 9.1.1. Industrial
- 9.1.2. Commercial
- 9.1.3. Municipal
- 9.1.4. Others
- 9.2. Market Analysis, Insights and Forecast - by Types
- 9.2.1. Wired Transceiver
- 9.2.2. Wireless Transceiver
- 9.1. Market Analysis, Insights and Forecast - by Application
- 10. Middle East & Africa Internet Protocol Transceiver Analysis, Insights and Forecast, 2021-2033
- 10.1. Market Analysis, Insights and Forecast - by Application
- 10.1.1. Industrial
- 10.1.2. Commercial
- 10.1.3. Municipal
- 10.1.4. Others
- 10.2. Market Analysis, Insights and Forecast - by Types
- 10.2.1. Wired Transceiver
- 10.2.2. Wireless Transceiver
- 10.1. Market Analysis, Insights and Forecast - by Application
- 11. Asia Pacific Internet Protocol Transceiver Analysis, Insights and Forecast, 2021-2033
- 11.1. Market Analysis, Insights and Forecast - by Application
- 11.1.1. Industrial
- 11.1.2. Commercial
- 11.1.3. Municipal
- 11.1.4. Others
- 11.2. Market Analysis, Insights and Forecast - by Types
- 11.2.1. Wired Transceiver
- 11.2.2. Wireless Transceiver
- 11.1. Market Analysis, Insights and Forecast - by Application
- 12. Competitive Analysis
- 12.1. Company Profiles
- 12.1.1 Legrand North America
- 12.1.1.1. Company Overview
- 12.1.1.2. Products
- 12.1.1.3. Company Financials
- 12.1.1.4. SWOT Analysis
- 12.1.2 LLC
- 12.1.2.1. Company Overview
- 12.1.2.2. Products
- 12.1.2.3. Company Financials
- 12.1.2.4. SWOT Analysis
- 12.1.3 PureLink
- 12.1.3.1. Company Overview
- 12.1.3.2. Products
- 12.1.3.3. Company Financials
- 12.1.3.4. SWOT Analysis
- 12.1.4 Almo Corporation
- 12.1.4.1. Company Overview
- 12.1.4.2. Products
- 12.1.4.3. Company Financials
- 12.1.4.4. SWOT Analysis
- 12.1.5 Icom Inc.
- 12.1.5.1. Company Overview
- 12.1.5.2. Products
- 12.1.5.3. Company Financials
- 12.1.5.4. SWOT Analysis
- 12.1.6 Red Pitaya
- 12.1.6.1. Company Overview
- 12.1.6.2. Products
- 12.1.6.3. Company Financials
- 12.1.6.4. SWOT Analysis
- 12.1.7 IEI Integration Corp.
- 12.1.7.1. Company Overview
- 12.1.7.2. Products
- 12.1.7.3. Company Financials
- 12.1.7.4. SWOT Analysis
- 12.1.8 Advantech Co.
- 12.1.8.1. Company Overview
- 12.1.8.2. Products
- 12.1.8.3. Company Financials
- 12.1.8.4. SWOT Analysis
- 12.1.9 Ltd.
- 12.1.9.1. Company Overview
- 12.1.9.2. Products
- 12.1.9.3. Company Financials
- 12.1.9.4. SWOT Analysis
- 12.1.10 Shenzhen Safe Guard
- 12.1.10.1. Company Overview
- 12.1.10.2. Products
- 12.1.10.3. Company Financials
- 12.1.10.4. SWOT Analysis
- 12.1.11 DND TELECOM CENTER Ltd
- 12.1.11.1. Company Overview
- 12.1.11.2. Products
- 12.1.11.3. Company Financials
- 12.1.11.4. SWOT Analysis
- 12.1.12 Emerald X
- 12.1.12.1. Company Overview
- 12.1.12.2. Products
- 12.1.12.3. Company Financials
- 12.1.12.4. SWOT Analysis
- 12.1.13 LLC
- 12.1.13.1. Company Overview
- 12.1.13.2. Products
- 12.1.13.3. Company Financials
- 12.1.13.4. SWOT Analysis
- 12.1.1 Legrand North America
- 12.2. Market Entropy
- 12.2.1 Company's Key Areas Served
- 12.2.2 Recent Developments
- 12.3. Company Market Share Analysis 2025
- 12.3.1 Top 5 Companies Market Share Analysis
- 12.3.2 Top 3 Companies Market Share Analysis
- 12.4. List of Potential Customers
- 13. Research Methodology
List of Figures
- Figure 1: Global Internet Protocol Transceiver Revenue Breakdown (million, %) by Region 2025 & 2033
- Figure 2: Global Internet Protocol Transceiver Volume Breakdown (K, %) by Region 2025 & 2033
- Figure 3: North America Internet Protocol Transceiver Revenue (million), by Application 2025 & 2033
- Figure 4: North America Internet Protocol Transceiver Volume (K), by Application 2025 & 2033
- Figure 5: North America Internet Protocol Transceiver Revenue Share (%), by Application 2025 & 2033
- Figure 6: North America Internet Protocol Transceiver Volume Share (%), by Application 2025 & 2033
- Figure 7: North America Internet Protocol Transceiver Revenue (million), by Types 2025 & 2033
- Figure 8: North America Internet Protocol Transceiver Volume (K), by Types 2025 & 2033
- Figure 9: North America Internet Protocol Transceiver Revenue Share (%), by Types 2025 & 2033
- Figure 10: North America Internet Protocol Transceiver Volume Share (%), by Types 2025 & 2033
- Figure 11: North America Internet Protocol Transceiver Revenue (million), by Country 2025 & 2033
- Figure 12: North America Internet Protocol Transceiver Volume (K), by Country 2025 & 2033
- Figure 13: North America Internet Protocol Transceiver Revenue Share (%), by Country 2025 & 2033
- Figure 14: North America Internet Protocol Transceiver Volume Share (%), by Country 2025 & 2033
- Figure 15: South America Internet Protocol Transceiver Revenue (million), by Application 2025 & 2033
- Figure 16: South America Internet Protocol Transceiver Volume (K), by Application 2025 & 2033
- Figure 17: South America Internet Protocol Transceiver Revenue Share (%), by Application 2025 & 2033
- Figure 18: South America Internet Protocol Transceiver Volume Share (%), by Application 2025 & 2033
- Figure 19: South America Internet Protocol Transceiver Revenue (million), by Types 2025 & 2033
- Figure 20: South America Internet Protocol Transceiver Volume (K), by Types 2025 & 2033
- Figure 21: South America Internet Protocol Transceiver Revenue Share (%), by Types 2025 & 2033
- Figure 22: South America Internet Protocol Transceiver Volume Share (%), by Types 2025 & 2033
- Figure 23: South America Internet Protocol Transceiver Revenue (million), by Country 2025 & 2033
- Figure 24: South America Internet Protocol Transceiver Volume (K), by Country 2025 & 2033
- Figure 25: South America Internet Protocol Transceiver Revenue Share (%), by Country 2025 & 2033
- Figure 26: South America Internet Protocol Transceiver Volume Share (%), by Country 2025 & 2033
- Figure 27: Europe Internet Protocol Transceiver Revenue (million), by Application 2025 & 2033
- Figure 28: Europe Internet Protocol Transceiver Volume (K), by Application 2025 & 2033
- Figure 29: Europe Internet Protocol Transceiver Revenue Share (%), by Application 2025 & 2033
- Figure 30: Europe Internet Protocol Transceiver Volume Share (%), by Application 2025 & 2033
- Figure 31: Europe Internet Protocol Transceiver Revenue (million), by Types 2025 & 2033
- Figure 32: Europe Internet Protocol Transceiver Volume (K), by Types 2025 & 2033
- Figure 33: Europe Internet Protocol Transceiver Revenue Share (%), by Types 2025 & 2033
- Figure 34: Europe Internet Protocol Transceiver Volume Share (%), by Types 2025 & 2033
- Figure 35: Europe Internet Protocol Transceiver Revenue (million), by Country 2025 & 2033
- Figure 36: Europe Internet Protocol Transceiver Volume (K), by Country 2025 & 2033
- Figure 37: Europe Internet Protocol Transceiver Revenue Share (%), by Country 2025 & 2033
- Figure 38: Europe Internet Protocol Transceiver Volume Share (%), by Country 2025 & 2033
- Figure 39: Middle East & Africa Internet Protocol Transceiver Revenue (million), by Application 2025 & 2033
- Figure 40: Middle East & Africa Internet Protocol Transceiver Volume (K), by Application 2025 & 2033
- Figure 41: Middle East & Africa Internet Protocol Transceiver Revenue Share (%), by Application 2025 & 2033
- Figure 42: Middle East & Africa Internet Protocol Transceiver Volume Share (%), by Application 2025 & 2033
- Figure 43: Middle East & Africa Internet Protocol Transceiver Revenue (million), by Types 2025 & 2033
- Figure 44: Middle East & Africa Internet Protocol Transceiver Volume (K), by Types 2025 & 2033
- Figure 45: Middle East & Africa Internet Protocol Transceiver Revenue Share (%), by Types 2025 & 2033
- Figure 46: Middle East & Africa Internet Protocol Transceiver Volume Share (%), by Types 2025 & 2033
- Figure 47: Middle East & Africa Internet Protocol Transceiver Revenue (million), by Country 2025 & 2033
- Figure 48: Middle East & Africa Internet Protocol Transceiver Volume (K), by Country 2025 & 2033
- Figure 49: Middle East & Africa Internet Protocol Transceiver Revenue Share (%), by Country 2025 & 2033
- Figure 50: Middle East & Africa Internet Protocol Transceiver Volume Share (%), by Country 2025 & 2033
- Figure 51: Asia Pacific Internet Protocol Transceiver Revenue (million), by Application 2025 & 2033
- Figure 52: Asia Pacific Internet Protocol Transceiver Volume (K), by Application 2025 & 2033
- Figure 53: Asia Pacific Internet Protocol Transceiver Revenue Share (%), by Application 2025 & 2033
- Figure 54: Asia Pacific Internet Protocol Transceiver Volume Share (%), by Application 2025 & 2033
- Figure 55: Asia Pacific Internet Protocol Transceiver Revenue (million), by Types 2025 & 2033
- Figure 56: Asia Pacific Internet Protocol Transceiver Volume (K), by Types 2025 & 2033
- Figure 57: Asia Pacific Internet Protocol Transceiver Revenue Share (%), by Types 2025 & 2033
- Figure 58: Asia Pacific Internet Protocol Transceiver Volume Share (%), by Types 2025 & 2033
- Figure 59: Asia Pacific Internet Protocol Transceiver Revenue (million), by Country 2025 & 2033
- Figure 60: Asia Pacific Internet Protocol Transceiver Volume (K), by Country 2025 & 2033
- Figure 61: Asia Pacific Internet Protocol Transceiver Revenue Share (%), by Country 2025 & 2033
- Figure 62: Asia Pacific Internet Protocol Transceiver Volume Share (%), by Country 2025 & 2033
List of Tables
- Table 1: Global Internet Protocol Transceiver Revenue million Forecast, by Application 2020 & 2033
- Table 2: Global Internet Protocol Transceiver Volume K Forecast, by Application 2020 & 2033
- Table 3: Global Internet Protocol Transceiver Revenue million Forecast, by Types 2020 & 2033
- Table 4: Global Internet Protocol Transceiver Volume K Forecast, by Types 2020 & 2033
- Table 5: Global Internet Protocol Transceiver Revenue million Forecast, by Region 2020 & 2033
- Table 6: Global Internet Protocol Transceiver Volume K Forecast, by Region 2020 & 2033
- Table 7: Global Internet Protocol Transceiver Revenue million Forecast, by Application 2020 & 2033
- Table 8: Global Internet Protocol Transceiver Volume K Forecast, by Application 2020 & 2033
- Table 9: Global Internet Protocol Transceiver Revenue million Forecast, by Types 2020 & 2033
- Table 10: Global Internet Protocol Transceiver Volume K Forecast, by Types 2020 & 2033
- Table 11: Global Internet Protocol Transceiver Revenue million Forecast, by Country 2020 & 2033
- Table 12: Global Internet Protocol Transceiver Volume K Forecast, by Country 2020 & 2033
- Table 13: United States Internet Protocol Transceiver Revenue (million) Forecast, by Application 2020 & 2033
- Table 14: United States Internet Protocol Transceiver Volume (K) Forecast, by Application 2020 & 2033
- Table 15: Canada Internet Protocol Transceiver Revenue (million) Forecast, by Application 2020 & 2033
- Table 16: Canada Internet Protocol Transceiver Volume (K) Forecast, by Application 2020 & 2033
- Table 17: Mexico Internet Protocol Transceiver Revenue (million) Forecast, by Application 2020 & 2033
- Table 18: Mexico Internet Protocol Transceiver Volume (K) Forecast, by Application 2020 & 2033
- Table 19: Global Internet Protocol Transceiver Revenue million Forecast, by Application 2020 & 2033
- Table 20: Global Internet Protocol Transceiver Volume K Forecast, by Application 2020 & 2033
- Table 21: Global Internet Protocol Transceiver Revenue million Forecast, by Types 2020 & 2033
- Table 22: Global Internet Protocol Transceiver Volume K Forecast, by Types 2020 & 2033
- Table 23: Global Internet Protocol Transceiver Revenue million Forecast, by Country 2020 & 2033
- Table 24: Global Internet Protocol Transceiver Volume K Forecast, by Country 2020 & 2033
- Table 25: Brazil Internet Protocol Transceiver Revenue (million) Forecast, by Application 2020 & 2033
- Table 26: Brazil Internet Protocol Transceiver Volume (K) Forecast, by Application 2020 & 2033
- Table 27: Argentina Internet Protocol Transceiver Revenue (million) Forecast, by Application 2020 & 2033
- Table 28: Argentina Internet Protocol Transceiver Volume (K) Forecast, by Application 2020 & 2033
- Table 29: Rest of South America Internet Protocol Transceiver Revenue (million) Forecast, by Application 2020 & 2033
- Table 30: Rest of South America Internet Protocol Transceiver Volume (K) Forecast, by Application 2020 & 2033
- Table 31: Global Internet Protocol Transceiver Revenue million Forecast, by Application 2020 & 2033
- Table 32: Global Internet Protocol Transceiver Volume K Forecast, by Application 2020 & 2033
- Table 33: Global Internet Protocol Transceiver Revenue million Forecast, by Types 2020 & 2033
- Table 34: Global Internet Protocol Transceiver Volume K Forecast, by Types 2020 & 2033
- Table 35: Global Internet Protocol Transceiver Revenue million Forecast, by Country 2020 & 2033
- Table 36: Global Internet Protocol Transceiver Volume K Forecast, by Country 2020 & 2033
- Table 37: United Kingdom Internet Protocol Transceiver Revenue (million) Forecast, by Application 2020 & 2033
- Table 38: United Kingdom Internet Protocol Transceiver Volume (K) Forecast, by Application 2020 & 2033
- Table 39: Germany Internet Protocol Transceiver Revenue (million) Forecast, by Application 2020 & 2033
- Table 40: Germany Internet Protocol Transceiver Volume (K) Forecast, by Application 2020 & 2033
- Table 41: France Internet Protocol Transceiver Revenue (million) Forecast, by Application 2020 & 2033
- Table 42: France Internet Protocol Transceiver Volume (K) Forecast, by Application 2020 & 2033
- Table 43: Italy Internet Protocol Transceiver Revenue (million) Forecast, by Application 2020 & 2033
- Table 44: Italy Internet Protocol Transceiver Volume (K) Forecast, by Application 2020 & 2033
- Table 45: Spain Internet Protocol Transceiver Revenue (million) Forecast, by Application 2020 & 2033
- Table 46: Spain Internet Protocol Transceiver Volume (K) Forecast, by Application 2020 & 2033
- Table 47: Russia Internet Protocol Transceiver Revenue (million) Forecast, by Application 2020 & 2033
- Table 48: Russia Internet Protocol Transceiver Volume (K) Forecast, by Application 2020 & 2033
- Table 49: Benelux Internet Protocol Transceiver Revenue (million) Forecast, by Application 2020 & 2033
- Table 50: Benelux Internet Protocol Transceiver Volume (K) Forecast, by Application 2020 & 2033
- Table 51: Nordics Internet Protocol Transceiver Revenue (million) Forecast, by Application 2020 & 2033
- Table 52: Nordics Internet Protocol Transceiver Volume (K) Forecast, by Application 2020 & 2033
- Table 53: Rest of Europe Internet Protocol Transceiver Revenue (million) Forecast, by Application 2020 & 2033
- Table 54: Rest of Europe Internet Protocol Transceiver Volume (K) Forecast, by Application 2020 & 2033
- Table 55: Global Internet Protocol Transceiver Revenue million Forecast, by Application 2020 & 2033
- Table 56: Global Internet Protocol Transceiver Volume K Forecast, by Application 2020 & 2033
- Table 57: Global Internet Protocol Transceiver Revenue million Forecast, by Types 2020 & 2033
- Table 58: Global Internet Protocol Transceiver Volume K Forecast, by Types 2020 & 2033
- Table 59: Global Internet Protocol Transceiver Revenue million Forecast, by Country 2020 & 2033
- Table 60: Global Internet Protocol Transceiver Volume K Forecast, by Country 2020 & 2033
- Table 61: Turkey Internet Protocol Transceiver Revenue (million) Forecast, by Application 2020 & 2033
- Table 62: Turkey Internet Protocol Transceiver Volume (K) Forecast, by Application 2020 & 2033
- Table 63: Israel Internet Protocol Transceiver Revenue (million) Forecast, by Application 2020 & 2033
- Table 64: Israel Internet Protocol Transceiver Volume (K) Forecast, by Application 2020 & 2033
- Table 65: GCC Internet Protocol Transceiver Revenue (million) Forecast, by Application 2020 & 2033
- Table 66: GCC Internet Protocol Transceiver Volume (K) Forecast, by Application 2020 & 2033
- Table 67: North Africa Internet Protocol Transceiver Revenue (million) Forecast, by Application 2020 & 2033
- Table 68: North Africa Internet Protocol Transceiver Volume (K) Forecast, by Application 2020 & 2033
- Table 69: South Africa Internet Protocol Transceiver Revenue (million) Forecast, by Application 2020 & 2033
- Table 70: South Africa Internet Protocol Transceiver Volume (K) Forecast, by Application 2020 & 2033
- Table 71: Rest of Middle East & Africa Internet Protocol Transceiver Revenue (million) Forecast, by Application 2020 & 2033
- Table 72: Rest of Middle East & Africa Internet Protocol Transceiver Volume (K) Forecast, by Application 2020 & 2033
- Table 73: Global Internet Protocol Transceiver Revenue million Forecast, by Application 2020 & 2033
- Table 74: Global Internet Protocol Transceiver Volume K Forecast, by Application 2020 & 2033
- Table 75: Global Internet Protocol Transceiver Revenue million Forecast, by Types 2020 & 2033
- Table 76: Global Internet Protocol Transceiver Volume K Forecast, by Types 2020 & 2033
- Table 77: Global Internet Protocol Transceiver Revenue million Forecast, by Country 2020 & 2033
- Table 78: Global Internet Protocol Transceiver Volume K Forecast, by Country 2020 & 2033
- Table 79: China Internet Protocol Transceiver Revenue (million) Forecast, by Application 2020 & 2033
- Table 80: China Internet Protocol Transceiver Volume (K) Forecast, by Application 2020 & 2033
- Table 81: India Internet Protocol Transceiver Revenue (million) Forecast, by Application 2020 & 2033
- Table 82: India Internet Protocol Transceiver Volume (K) Forecast, by Application 2020 & 2033
- Table 83: Japan Internet Protocol Transceiver Revenue (million) Forecast, by Application 2020 & 2033
- Table 84: Japan Internet Protocol Transceiver Volume (K) Forecast, by Application 2020 & 2033
- Table 85: South Korea Internet Protocol Transceiver Revenue (million) Forecast, by Application 2020 & 2033
- Table 86: South Korea Internet Protocol Transceiver Volume (K) Forecast, by Application 2020 & 2033
- Table 87: ASEAN Internet Protocol Transceiver Revenue (million) Forecast, by Application 2020 & 2033
- Table 88: ASEAN Internet Protocol Transceiver Volume (K) Forecast, by Application 2020 & 2033
- Table 89: Oceania Internet Protocol Transceiver Revenue (million) Forecast, by Application 2020 & 2033
- Table 90: Oceania Internet Protocol Transceiver Volume (K) Forecast, by Application 2020 & 2033
- Table 91: Rest of Asia Pacific Internet Protocol Transceiver Revenue (million) Forecast, by Application 2020 & 2033
- Table 92: Rest of Asia Pacific Internet Protocol Transceiver Volume (K) Forecast, by Application 2020 & 2033
Frequently Asked Questions
1. What is the projected Compound Annual Growth Rate (CAGR) of the Internet Protocol Transceiver?
The projected CAGR is approximately XX%.
2. Which companies are prominent players in the Internet Protocol Transceiver?
Key companies in the market include Legrand North America, LLC, PureLink, Almo Corporation, Icom Inc., Red Pitaya, IEI Integration Corp., Advantech Co., Ltd., Shenzhen Safe Guard, DND TELECOM CENTER Ltd, Emerald X, LLC.
3. What are the main segments of the Internet Protocol Transceiver?
The market segments include Application, Types.
4. Can you provide details about the market size?
The market size is estimated to be USD XXX million as of 2022.
5. What are some drivers contributing to market growth?
N/A
6. What are the notable trends driving market growth?
N/A
7. Are there any restraints impacting market growth?
N/A
8. Can you provide examples of recent developments in the market?
N/A
9. What pricing options are available for accessing the report?
Pricing options include single-user, multi-user, and enterprise licenses priced at USD 3950.00, USD 5925.00, and USD 7900.00 respectively.
10. Is the market size provided in terms of value or volume?
The market size is provided in terms of value, measured in million and volume, measured in K.
11. Are there any specific market keywords associated with the report?
Yes, the market keyword associated with the report is "Internet Protocol Transceiver," which aids in identifying and referencing the specific market segment covered.
12. How do I determine which pricing option suits my needs best?
The pricing options vary based on user requirements and access needs. Individual users may opt for single-user licenses, while businesses requiring broader access may choose multi-user or enterprise licenses for cost-effective access to the report.
13. Are there any additional resources or data provided in the Internet Protocol Transceiver report?
While the report offers comprehensive insights, it's advisable to review the specific contents or supplementary materials provided to ascertain if additional resources or data are available.
14. How can I stay updated on further developments or reports in the Internet Protocol Transceiver?
To stay informed about further developments, trends, and reports in the Internet Protocol Transceiver, consider subscribing to industry newsletters, following relevant companies and organizations, or regularly checking reputable industry news sources and publications.
Methodology
Step 1 - Identification of Relevant Samples Size from Population Database


Step 2 - Approaches for Defining Global Market Size (Value, Volume* & Price*)

Note*: In applicable scenarios
Step 3 - Data Sources
Primary Research
- Web Analytics
- Survey Reports
- Research Institute
- Latest Research Reports
- Opinion Leaders
Secondary Research
- Annual Reports
- White Paper
- Latest Press Release
- Industry Association
- Paid Database
- Investor Presentations

Step 4 - Data Triangulation
Involves using different sources of information in order to increase the validity of a study
These sources are likely to be stakeholders in a program - participants, other researchers, program staff, other community members, and so on.
Then we put all data in single framework & apply various statistical tools to find out the dynamic on the market.
During the analysis stage, feedback from the stakeholder groups would be compared to determine areas of agreement as well as areas of divergence