
Key Insights
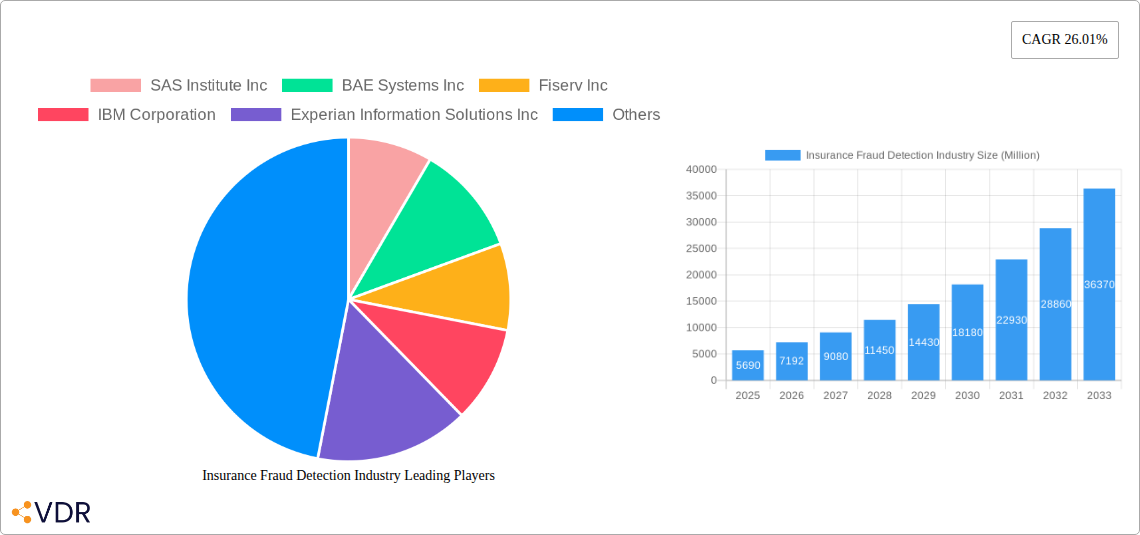
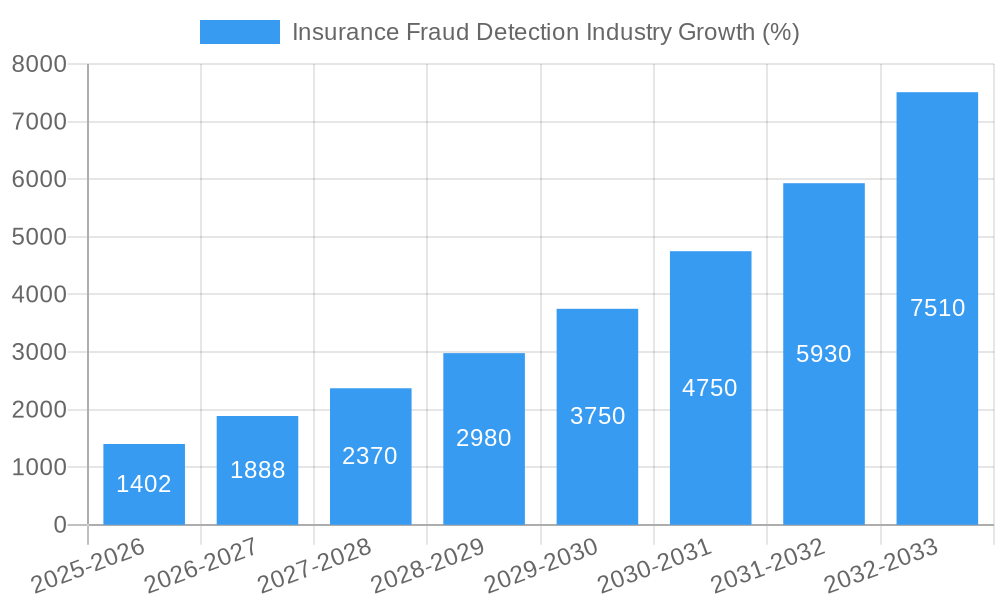
The insurance fraud detection market is experiencing robust growth, projected to reach \$5.69 billion in 2025 and exhibiting a Compound Annual Growth Rate (CAGR) of 26.01% from 2025 to 2033. This expansion is driven by several key factors. Rising insurance claims, coupled with increasingly sophisticated fraud techniques, necessitate advanced detection solutions. The increasing adoption of big data analytics, artificial intelligence (AI), and machine learning (ML) technologies significantly enhances the accuracy and efficiency of fraud detection, leading to considerable cost savings for insurance providers. Furthermore, stringent government regulations aimed at curbing fraudulent activities and improving industry transparency are propelling market growth. The BFSI (Banking, Financial Services, and Insurance) sector is a primary driver, given its vulnerability to various types of fraud, including claims fraud, identity theft, and payment fraud. Growth is also fueled by the expanding adoption of these solutions across other end-user industries like healthcare and retail, where fraud poses significant financial risks. The market is segmented by solution type (primarily software and services), application (claims fraud, identity theft, payment fraud, money laundering), end-user industry (BFSI, healthcare, retail, etc.), and component (solution).
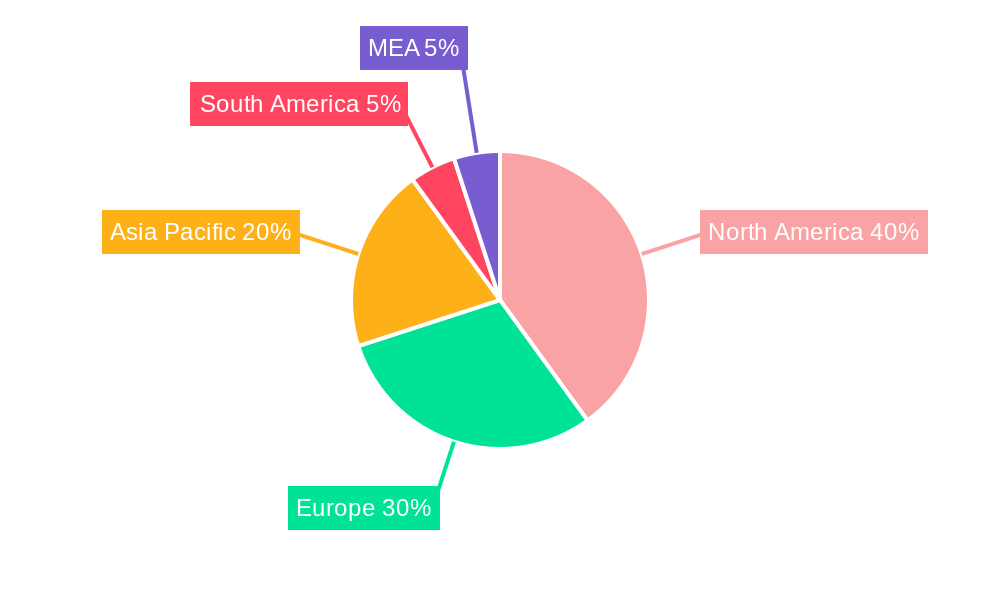
The competitive landscape is marked by the presence of established players like SAS Institute, BAE Systems, Fiserv, IBM, Experian, FICO, and others. These companies are continuously innovating and developing advanced solutions, including those leveraging AI and ML for improved fraud detection capabilities. The North American market currently holds a significant share due to technological advancement, high insurance penetration, and stringent regulatory environments. However, the Asia-Pacific region is expected to witness substantial growth in the coming years fueled by increasing digitalization and rising insurance penetration across developing economies like India and China. Market restraints include the high cost of implementation and maintenance of advanced fraud detection systems and the need for skilled professionals to manage and interpret the results. Nevertheless, the overall market outlook remains positive, driven by the critical need to combat insurance fraud and protect financial interests.
Insurance Fraud Detection Industry Market Report: 2019-2033
This comprehensive report provides an in-depth analysis of the Insurance Fraud Detection industry, encompassing market dynamics, growth trends, regional dominance, product landscape, key players, and future outlook. The study period covers 2019-2033, with 2025 as the base and estimated year. The market is segmented by solution type (Other Solutions: Service), application (Claims Fraud, Identity Theft, Payment and Billing Fraud, Money Laundering), end-user industry (Automotive, BFSI, Healthcare, Retail, Other End-user Industries), and component (Solution). The report projects a market value of xx Million by 2033.
Insurance Fraud Detection Industry Market Dynamics & Structure
The Insurance Fraud Detection market is characterized by moderate concentration, with several key players holding significant market share. Technological innovation, particularly in AI and machine learning, is a primary driver, while stringent regulatory frameworks and increasing cross-border fraud necessitate robust solutions. Competitive substitutes include traditional investigative methods, but their efficiency pales in comparison to advanced analytical tools. The end-user demographic is expanding as digitalization permeates insurance operations. M&A activity has been moderate, with a focus on strengthening technological capabilities and expanding geographic reach. The historical period (2019-2024) saw an average of xx M&A deals annually, while the forecast period (2025-2033) anticipates xx deals per year, driven by increasing fraud losses.
- Market Concentration: Moderately concentrated, with top 5 players holding approximately xx% market share in 2024.
- Technological Innovation: AI, machine learning, and big data analytics are key drivers. Innovation barriers include data security concerns and integration complexities.
- Regulatory Frameworks: Stringent regulations like GDPR and CCPA influence data handling and solution development.
- Competitive Substitutes: Traditional investigative methods pose a minor competitive threat.
- End-User Demographics: Expanding across various industries due to increased digital transactions and fraud attempts.
- M&A Trends: Moderate activity focused on technology acquisition and market expansion.
Insurance Fraud Detection Industry Growth Trends & Insights
The Insurance Fraud Detection market experienced significant growth from 2019 to 2024, reaching xx Million in 2024. This growth is attributed to the rising prevalence of insurance fraud, increasing adoption of advanced analytics, and a growing awareness of the financial implications of undetected fraud. The market is projected to maintain a healthy CAGR of xx% from 2025 to 2033, exceeding xx Million by 2033. Technological advancements such as AI-powered fraud detection systems and the increasing availability of large datasets are significant contributors to market expansion. Consumer behavior shifts, especially towards digital interactions, are further fueling the demand for sophisticated fraud detection solutions. Market penetration currently stands at xx% in developed markets and is expected to increase significantly in developing economies.
Dominant Regions, Countries, or Segments in Insurance Fraud Detection Industry
The North American region currently dominates the Insurance Fraud Detection market, driven by high insurance penetration, advanced technological infrastructure, and stringent regulatory frameworks. Within North America, the United States holds the largest market share, followed by Canada. The BFSI segment is the leading application area, owing to the significant volume of financial transactions and associated fraud risks. Claims fraud represents the largest application segment, accounting for approximately xx% of market revenue. Key growth drivers in North America include increased government spending on fraud prevention, the adoption of advanced analytics by insurance companies, and rising consumer awareness. In Europe, the UK and Germany are major markets. The Asia-Pacific region is projected to witness the fastest growth rate due to increasing digitalization and a rising middle class.
- North America: High insurance penetration, advanced technology infrastructure, stringent regulations.
- Europe: Strong regulatory environment, high adoption of advanced analytical tools.
- Asia-Pacific: Rapid digitalization, rising middle class, increasing insurance penetration.
- BFSI Segment: High volume of financial transactions, significant fraud risk.
- Claims Fraud Application: Largest application segment, representing approximately xx% of market revenue.
Insurance Fraud Detection Industry Product Landscape
The Insurance Fraud Detection market offers a range of solutions, from rule-based systems to advanced AI-powered platforms. These solutions leverage machine learning algorithms, natural language processing, and network analysis to identify fraudulent patterns and predict future risks. Key product innovations include automated claim processing, real-time fraud detection, and advanced analytics dashboards. Unique selling propositions often center around accuracy, speed, and ease of integration with existing insurance systems. Technological advancements continuously improve the accuracy and efficiency of fraud detection, reducing false positives and enhancing overall effectiveness.
Key Drivers, Barriers & Challenges in Insurance Fraud Detection Industry
Key Drivers:
- Rising prevalence of insurance fraud, leading to significant financial losses for insurers.
- Increased adoption of digital technologies and online transactions, expanding opportunities for fraud.
- Stringent regulatory requirements necessitate robust fraud detection solutions.
- Growing demand for improved operational efficiency and reduced claim processing times.
Challenges & Restraints:
- High implementation and maintenance costs of advanced fraud detection systems.
- Data security and privacy concerns related to handling sensitive customer information.
- Integration challenges with existing legacy insurance systems.
- Difficulty in detecting sophisticated and evolving fraud schemes. This leads to an estimated xx Million loss annually due to undetected sophisticated fraud.
Emerging Opportunities in Insurance Fraud Detection Industry
- Expanding into untapped markets, particularly in developing economies with rising insurance penetration.
- Developing innovative applications for specific types of insurance fraud, such as travel insurance or healthcare fraud.
- Leveraging emerging technologies, such as blockchain and IoT, to enhance fraud detection capabilities.
- Partnering with fintech companies and data providers to access new data sources and improve analytics.
Growth Accelerators in the Insurance Fraud Detection Industry
The Insurance Fraud Detection market is poised for sustained growth driven by several factors. Technological breakthroughs, particularly in AI and machine learning, continue to improve the accuracy and efficiency of fraud detection. Strategic partnerships between technology providers and insurance companies are facilitating the adoption of advanced solutions. Market expansion into emerging economies with rising insurance penetration presents significant opportunities for growth. Further, increasing regulatory scrutiny and stricter penalties for fraud are incentivizing insurers to invest in robust fraud detection systems.
Key Players Shaping the Insurance Fraud Detection Market
- SAS Institute Inc
- BAE Systems Inc
- Fiserv Inc
- IBM Corporation
- Experian Information Solutions Inc
- Fair Isaac Corporation (FICO)
- FRISS Fraudebestrijding BV
- Lexisnexis Risk Solutions Inc (Relx Group PLC)
- SAP SE
Notable Milestones in Insurance Fraud Detection Industry Sector
- May 2023: Verisk partners with CCC Intelligent Solutions to integrate claims fraud detection analytics into a cloud platform for the P&C insurance market. This enhances the effectiveness of fraud detection in the property and casualty sector.
- March 2023: Shift Technology expands its AI-driven fraud detection solution to the General Insurance Association of Singapore (GIA), significantly improving travel insurance fraud detection capabilities across multiple insurers. This highlights the growing adoption of AI-powered solutions in the insurance sector.
In-Depth Insurance Fraud Detection Industry Market Outlook
The Insurance Fraud Detection market presents significant long-term growth potential, driven by the ever-increasing sophistication of fraud schemes and the need for advanced solutions to combat them. Strategic partnerships, technological advancements, and expanding regulations will propel market growth. Companies that can effectively leverage AI, machine learning, and big data analytics to detect and prevent fraud will hold a competitive advantage. The market is expected to continue its expansion, driven by increasing digitalization, regulatory pressure, and a rising demand for efficient and effective fraud detection solutions across various insurance segments and geographies.
Insurance Fraud Detection Industry Segmentation
-
1. Component
-
1.1. Solution
- 1.1.1. Fraud Analytics
- 1.1.2. Authentication
- 1.1.3. Governance, Risk, and Compliance
- 1.1.4. Other Solutions
- 1.2. Service
-
1.1. Solution
-
2. Applcation
- 2.1. Claims Fraud
- 2.2. Identity Theft
- 2.3. Payment and Billing Fraud
- 2.4. Money Laundering
-
3. End-user Indsutry
- 3.1. Automotive
- 3.2. BFSI
- 3.3. Healthcare
- 3.4. Retail
- 3.5. Other End-user Industries
Insurance Fraud Detection Industry Segmentation By Geography
-
1. North America
- 1.1. United States
- 1.2. Canada
-
2. Europe
- 2.1. United Kingdom
- 2.2. Germany
- 2.3. France
-
3. Asia Pacific
- 3.1. China
- 3.2. Japan
- 3.3. India
- 3.4. Rest of Asia Pacific
- 4. Latin America
- 5. Middle East and Africa
Insurance Fraud Detection Industry REPORT HIGHLIGHTS
| Aspects | Details |
|---|---|
| Study Period | 2019-2033 |
| Base Year | 2024 |
| Estimated Year | 2025 |
| Forecast Period | 2025-2033 |
| Historical Period | 2019-2024 |
| Growth Rate | CAGR of 26.01% from 2019-2033 |
| Segmentation |
|
Table of Contents
- 1. Introduction
- 1.1. Research Scope
- 1.2. Market Segmentation
- 1.3. Research Methodology
- 1.4. Definitions and Assumptions
- 2. Executive Summary
- 2.1. Introduction
- 3. Market Dynamics
- 3.1. Introduction
- 3.2. Market Drivers
- 3.2.1. Need to Effectively Manage Huge Volumes of Identities; Improved Operational Efficiency and Enhanced Customer Experience
- 3.3. Market Restrains
- 3.3.1. Lack of Awareness Regarding Fraud Detection Solutions
- 3.4. Market Trends
- 3.4.1. Fraud Analytics Solution Segment is Expected to Hold Significant Market Share
- 4. Market Factor Analysis
- 4.1. Porters Five Forces
- 4.2. Supply/Value Chain
- 4.3. PESTEL analysis
- 4.4. Market Entropy
- 4.5. Patent/Trademark Analysis
- 5. Global Insurance Fraud Detection Industry Analysis, Insights and Forecast, 2019-2031
- 5.1. Market Analysis, Insights and Forecast - by Component
- 5.1.1. Solution
- 5.1.1.1. Fraud Analytics
- 5.1.1.2. Authentication
- 5.1.1.3. Governance, Risk, and Compliance
- 5.1.1.4. Other Solutions
- 5.1.2. Service
- 5.1.1. Solution
- 5.2. Market Analysis, Insights and Forecast - by Applcation
- 5.2.1. Claims Fraud
- 5.2.2. Identity Theft
- 5.2.3. Payment and Billing Fraud
- 5.2.4. Money Laundering
- 5.3. Market Analysis, Insights and Forecast - by End-user Indsutry
- 5.3.1. Automotive
- 5.3.2. BFSI
- 5.3.3. Healthcare
- 5.3.4. Retail
- 5.3.5. Other End-user Industries
- 5.4. Market Analysis, Insights and Forecast - by Region
- 5.4.1. North America
- 5.4.2. Europe
- 5.4.3. Asia Pacific
- 5.4.4. Latin America
- 5.4.5. Middle East and Africa
- 5.1. Market Analysis, Insights and Forecast - by Component
- 6. North America Insurance Fraud Detection Industry Analysis, Insights and Forecast, 2019-2031
- 6.1. Market Analysis, Insights and Forecast - by Component
- 6.1.1. Solution
- 6.1.1.1. Fraud Analytics
- 6.1.1.2. Authentication
- 6.1.1.3. Governance, Risk, and Compliance
- 6.1.1.4. Other Solutions
- 6.1.2. Service
- 6.1.1. Solution
- 6.2. Market Analysis, Insights and Forecast - by Applcation
- 6.2.1. Claims Fraud
- 6.2.2. Identity Theft
- 6.2.3. Payment and Billing Fraud
- 6.2.4. Money Laundering
- 6.3. Market Analysis, Insights and Forecast - by End-user Indsutry
- 6.3.1. Automotive
- 6.3.2. BFSI
- 6.3.3. Healthcare
- 6.3.4. Retail
- 6.3.5. Other End-user Industries
- 6.1. Market Analysis, Insights and Forecast - by Component
- 7. Europe Insurance Fraud Detection Industry Analysis, Insights and Forecast, 2019-2031
- 7.1. Market Analysis, Insights and Forecast - by Component
- 7.1.1. Solution
- 7.1.1.1. Fraud Analytics
- 7.1.1.2. Authentication
- 7.1.1.3. Governance, Risk, and Compliance
- 7.1.1.4. Other Solutions
- 7.1.2. Service
- 7.1.1. Solution
- 7.2. Market Analysis, Insights and Forecast - by Applcation
- 7.2.1. Claims Fraud
- 7.2.2. Identity Theft
- 7.2.3. Payment and Billing Fraud
- 7.2.4. Money Laundering
- 7.3. Market Analysis, Insights and Forecast - by End-user Indsutry
- 7.3.1. Automotive
- 7.3.2. BFSI
- 7.3.3. Healthcare
- 7.3.4. Retail
- 7.3.5. Other End-user Industries
- 7.1. Market Analysis, Insights and Forecast - by Component
- 8. Asia Pacific Insurance Fraud Detection Industry Analysis, Insights and Forecast, 2019-2031
- 8.1. Market Analysis, Insights and Forecast - by Component
- 8.1.1. Solution
- 8.1.1.1. Fraud Analytics
- 8.1.1.2. Authentication
- 8.1.1.3. Governance, Risk, and Compliance
- 8.1.1.4. Other Solutions
- 8.1.2. Service
- 8.1.1. Solution
- 8.2. Market Analysis, Insights and Forecast - by Applcation
- 8.2.1. Claims Fraud
- 8.2.2. Identity Theft
- 8.2.3. Payment and Billing Fraud
- 8.2.4. Money Laundering
- 8.3. Market Analysis, Insights and Forecast - by End-user Indsutry
- 8.3.1. Automotive
- 8.3.2. BFSI
- 8.3.3. Healthcare
- 8.3.4. Retail
- 8.3.5. Other End-user Industries
- 8.1. Market Analysis, Insights and Forecast - by Component
- 9. Latin America Insurance Fraud Detection Industry Analysis, Insights and Forecast, 2019-2031
- 9.1. Market Analysis, Insights and Forecast - by Component
- 9.1.1. Solution
- 9.1.1.1. Fraud Analytics
- 9.1.1.2. Authentication
- 9.1.1.3. Governance, Risk, and Compliance
- 9.1.1.4. Other Solutions
- 9.1.2. Service
- 9.1.1. Solution
- 9.2. Market Analysis, Insights and Forecast - by Applcation
- 9.2.1. Claims Fraud
- 9.2.2. Identity Theft
- 9.2.3. Payment and Billing Fraud
- 9.2.4. Money Laundering
- 9.3. Market Analysis, Insights and Forecast - by End-user Indsutry
- 9.3.1. Automotive
- 9.3.2. BFSI
- 9.3.3. Healthcare
- 9.3.4. Retail
- 9.3.5. Other End-user Industries
- 9.1. Market Analysis, Insights and Forecast - by Component
- 10. Middle East and Africa Insurance Fraud Detection Industry Analysis, Insights and Forecast, 2019-2031
- 10.1. Market Analysis, Insights and Forecast - by Component
- 10.1.1. Solution
- 10.1.1.1. Fraud Analytics
- 10.1.1.2. Authentication
- 10.1.1.3. Governance, Risk, and Compliance
- 10.1.1.4. Other Solutions
- 10.1.2. Service
- 10.1.1. Solution
- 10.2. Market Analysis, Insights and Forecast - by Applcation
- 10.2.1. Claims Fraud
- 10.2.2. Identity Theft
- 10.2.3. Payment and Billing Fraud
- 10.2.4. Money Laundering
- 10.3. Market Analysis, Insights and Forecast - by End-user Indsutry
- 10.3.1. Automotive
- 10.3.2. BFSI
- 10.3.3. Healthcare
- 10.3.4. Retail
- 10.3.5. Other End-user Industries
- 10.1. Market Analysis, Insights and Forecast - by Component
- 11. North America Insurance Fraud Detection Industry Analysis, Insights and Forecast, 2019-2031
- 11.1. Market Analysis, Insights and Forecast - By Country/Sub-region
- 11.1.1 United States
- 11.1.2 Canada
- 11.1.3 Mexico
- 12. Europe Insurance Fraud Detection Industry Analysis, Insights and Forecast, 2019-2031
- 12.1. Market Analysis, Insights and Forecast - By Country/Sub-region
- 12.1.1 Germany
- 12.1.2 United Kingdom
- 12.1.3 France
- 12.1.4 Spain
- 12.1.5 Italy
- 12.1.6 Spain
- 12.1.7 Belgium
- 12.1.8 Netherland
- 12.1.9 Nordics
- 12.1.10 Rest of Europe
- 13. Asia Pacific Insurance Fraud Detection Industry Analysis, Insights and Forecast, 2019-2031
- 13.1. Market Analysis, Insights and Forecast - By Country/Sub-region
- 13.1.1 China
- 13.1.2 Japan
- 13.1.3 India
- 13.1.4 South Korea
- 13.1.5 Southeast Asia
- 13.1.6 Australia
- 13.1.7 Indonesia
- 13.1.8 Phillipes
- 13.1.9 Singapore
- 13.1.10 Thailandc
- 13.1.11 Rest of Asia Pacific
- 14. South America Insurance Fraud Detection Industry Analysis, Insights and Forecast, 2019-2031
- 14.1. Market Analysis, Insights and Forecast - By Country/Sub-region
- 14.1.1 Brazil
- 14.1.2 Argentina
- 14.1.3 Peru
- 14.1.4 Chile
- 14.1.5 Colombia
- 14.1.6 Ecuador
- 14.1.7 Venezuela
- 14.1.8 Rest of South America
- 15. North America Insurance Fraud Detection Industry Analysis, Insights and Forecast, 2019-2031
- 15.1. Market Analysis, Insights and Forecast - By Country/Sub-region
- 15.1.1 United States
- 15.1.2 Canada
- 15.1.3 Mexico
- 16. MEA Insurance Fraud Detection Industry Analysis, Insights and Forecast, 2019-2031
- 16.1. Market Analysis, Insights and Forecast - By Country/Sub-region
- 16.1.1 United Arab Emirates
- 16.1.2 Saudi Arabia
- 16.1.3 South Africa
- 16.1.4 Rest of Middle East and Africa
- 17. Competitive Analysis
- 17.1. Global Market Share Analysis 2024
- 17.2. Company Profiles
- 17.2.1 SAS Institute Inc
- 17.2.1.1. Overview
- 17.2.1.2. Products
- 17.2.1.3. SWOT Analysis
- 17.2.1.4. Recent Developments
- 17.2.1.5. Financials (Based on Availability)
- 17.2.2 BAE Systems Inc
- 17.2.2.1. Overview
- 17.2.2.2. Products
- 17.2.2.3. SWOT Analysis
- 17.2.2.4. Recent Developments
- 17.2.2.5. Financials (Based on Availability)
- 17.2.3 Fiserv Inc
- 17.2.3.1. Overview
- 17.2.3.2. Products
- 17.2.3.3. SWOT Analysis
- 17.2.3.4. Recent Developments
- 17.2.3.5. Financials (Based on Availability)
- 17.2.4 IBM Corporation
- 17.2.4.1. Overview
- 17.2.4.2. Products
- 17.2.4.3. SWOT Analysis
- 17.2.4.4. Recent Developments
- 17.2.4.5. Financials (Based on Availability)
- 17.2.5 Experian Information Solutions Inc
- 17.2.5.1. Overview
- 17.2.5.2. Products
- 17.2.5.3. SWOT Analysis
- 17.2.5.4. Recent Developments
- 17.2.5.5. Financials (Based on Availability)
- 17.2.6 Fair Isaac Corporation (FICO)
- 17.2.6.1. Overview
- 17.2.6.2. Products
- 17.2.6.3. SWOT Analysis
- 17.2.6.4. Recent Developments
- 17.2.6.5. Financials (Based on Availability)
- 17.2.7 FRISS Fraudebestrijding BV
- 17.2.7.1. Overview
- 17.2.7.2. Products
- 17.2.7.3. SWOT Analysis
- 17.2.7.4. Recent Developments
- 17.2.7.5. Financials (Based on Availability)
- 17.2.8 Lexisnexis Risk Solutions Inc (Relx Group PLC)
- 17.2.8.1. Overview
- 17.2.8.2. Products
- 17.2.8.3. SWOT Analysis
- 17.2.8.4. Recent Developments
- 17.2.8.5. Financials (Based on Availability)
- 17.2.9 SAP SE
- 17.2.9.1. Overview
- 17.2.9.2. Products
- 17.2.9.3. SWOT Analysis
- 17.2.9.4. Recent Developments
- 17.2.9.5. Financials (Based on Availability)
- 17.2.1 SAS Institute Inc
List of Figures
- Figure 1: Global Insurance Fraud Detection Industry Revenue Breakdown (Million, %) by Region 2024 & 2032
- Figure 2: North America Insurance Fraud Detection Industry Revenue (Million), by Country 2024 & 2032
- Figure 3: North America Insurance Fraud Detection Industry Revenue Share (%), by Country 2024 & 2032
- Figure 4: Europe Insurance Fraud Detection Industry Revenue (Million), by Country 2024 & 2032
- Figure 5: Europe Insurance Fraud Detection Industry Revenue Share (%), by Country 2024 & 2032
- Figure 6: Asia Pacific Insurance Fraud Detection Industry Revenue (Million), by Country 2024 & 2032
- Figure 7: Asia Pacific Insurance Fraud Detection Industry Revenue Share (%), by Country 2024 & 2032
- Figure 8: South America Insurance Fraud Detection Industry Revenue (Million), by Country 2024 & 2032
- Figure 9: South America Insurance Fraud Detection Industry Revenue Share (%), by Country 2024 & 2032
- Figure 10: North America Insurance Fraud Detection Industry Revenue (Million), by Country 2024 & 2032
- Figure 11: North America Insurance Fraud Detection Industry Revenue Share (%), by Country 2024 & 2032
- Figure 12: MEA Insurance Fraud Detection Industry Revenue (Million), by Country 2024 & 2032
- Figure 13: MEA Insurance Fraud Detection Industry Revenue Share (%), by Country 2024 & 2032
- Figure 14: North America Insurance Fraud Detection Industry Revenue (Million), by Component 2024 & 2032
- Figure 15: North America Insurance Fraud Detection Industry Revenue Share (%), by Component 2024 & 2032
- Figure 16: North America Insurance Fraud Detection Industry Revenue (Million), by Applcation 2024 & 2032
- Figure 17: North America Insurance Fraud Detection Industry Revenue Share (%), by Applcation 2024 & 2032
- Figure 18: North America Insurance Fraud Detection Industry Revenue (Million), by End-user Indsutry 2024 & 2032
- Figure 19: North America Insurance Fraud Detection Industry Revenue Share (%), by End-user Indsutry 2024 & 2032
- Figure 20: North America Insurance Fraud Detection Industry Revenue (Million), by Country 2024 & 2032
- Figure 21: North America Insurance Fraud Detection Industry Revenue Share (%), by Country 2024 & 2032
- Figure 22: Europe Insurance Fraud Detection Industry Revenue (Million), by Component 2024 & 2032
- Figure 23: Europe Insurance Fraud Detection Industry Revenue Share (%), by Component 2024 & 2032
- Figure 24: Europe Insurance Fraud Detection Industry Revenue (Million), by Applcation 2024 & 2032
- Figure 25: Europe Insurance Fraud Detection Industry Revenue Share (%), by Applcation 2024 & 2032
- Figure 26: Europe Insurance Fraud Detection Industry Revenue (Million), by End-user Indsutry 2024 & 2032
- Figure 27: Europe Insurance Fraud Detection Industry Revenue Share (%), by End-user Indsutry 2024 & 2032
- Figure 28: Europe Insurance Fraud Detection Industry Revenue (Million), by Country 2024 & 2032
- Figure 29: Europe Insurance Fraud Detection Industry Revenue Share (%), by Country 2024 & 2032
- Figure 30: Asia Pacific Insurance Fraud Detection Industry Revenue (Million), by Component 2024 & 2032
- Figure 31: Asia Pacific Insurance Fraud Detection Industry Revenue Share (%), by Component 2024 & 2032
- Figure 32: Asia Pacific Insurance Fraud Detection Industry Revenue (Million), by Applcation 2024 & 2032
- Figure 33: Asia Pacific Insurance Fraud Detection Industry Revenue Share (%), by Applcation 2024 & 2032
- Figure 34: Asia Pacific Insurance Fraud Detection Industry Revenue (Million), by End-user Indsutry 2024 & 2032
- Figure 35: Asia Pacific Insurance Fraud Detection Industry Revenue Share (%), by End-user Indsutry 2024 & 2032
- Figure 36: Asia Pacific Insurance Fraud Detection Industry Revenue (Million), by Country 2024 & 2032
- Figure 37: Asia Pacific Insurance Fraud Detection Industry Revenue Share (%), by Country 2024 & 2032
- Figure 38: Latin America Insurance Fraud Detection Industry Revenue (Million), by Component 2024 & 2032
- Figure 39: Latin America Insurance Fraud Detection Industry Revenue Share (%), by Component 2024 & 2032
- Figure 40: Latin America Insurance Fraud Detection Industry Revenue (Million), by Applcation 2024 & 2032
- Figure 41: Latin America Insurance Fraud Detection Industry Revenue Share (%), by Applcation 2024 & 2032
- Figure 42: Latin America Insurance Fraud Detection Industry Revenue (Million), by End-user Indsutry 2024 & 2032
- Figure 43: Latin America Insurance Fraud Detection Industry Revenue Share (%), by End-user Indsutry 2024 & 2032
- Figure 44: Latin America Insurance Fraud Detection Industry Revenue (Million), by Country 2024 & 2032
- Figure 45: Latin America Insurance Fraud Detection Industry Revenue Share (%), by Country 2024 & 2032
- Figure 46: Middle East and Africa Insurance Fraud Detection Industry Revenue (Million), by Component 2024 & 2032
- Figure 47: Middle East and Africa Insurance Fraud Detection Industry Revenue Share (%), by Component 2024 & 2032
- Figure 48: Middle East and Africa Insurance Fraud Detection Industry Revenue (Million), by Applcation 2024 & 2032
- Figure 49: Middle East and Africa Insurance Fraud Detection Industry Revenue Share (%), by Applcation 2024 & 2032
- Figure 50: Middle East and Africa Insurance Fraud Detection Industry Revenue (Million), by End-user Indsutry 2024 & 2032
- Figure 51: Middle East and Africa Insurance Fraud Detection Industry Revenue Share (%), by End-user Indsutry 2024 & 2032
- Figure 52: Middle East and Africa Insurance Fraud Detection Industry Revenue (Million), by Country 2024 & 2032
- Figure 53: Middle East and Africa Insurance Fraud Detection Industry Revenue Share (%), by Country 2024 & 2032
List of Tables
- Table 1: Global Insurance Fraud Detection Industry Revenue Million Forecast, by Region 2019 & 2032
- Table 2: Global Insurance Fraud Detection Industry Revenue Million Forecast, by Component 2019 & 2032
- Table 3: Global Insurance Fraud Detection Industry Revenue Million Forecast, by Applcation 2019 & 2032
- Table 4: Global Insurance Fraud Detection Industry Revenue Million Forecast, by End-user Indsutry 2019 & 2032
- Table 5: Global Insurance Fraud Detection Industry Revenue Million Forecast, by Region 2019 & 2032
- Table 6: Global Insurance Fraud Detection Industry Revenue Million Forecast, by Country 2019 & 2032
- Table 7: United States Insurance Fraud Detection Industry Revenue (Million) Forecast, by Application 2019 & 2032
- Table 8: Canada Insurance Fraud Detection Industry Revenue (Million) Forecast, by Application 2019 & 2032
- Table 9: Mexico Insurance Fraud Detection Industry Revenue (Million) Forecast, by Application 2019 & 2032
- Table 10: Global Insurance Fraud Detection Industry Revenue Million Forecast, by Country 2019 & 2032
- Table 11: Germany Insurance Fraud Detection Industry Revenue (Million) Forecast, by Application 2019 & 2032
- Table 12: United Kingdom Insurance Fraud Detection Industry Revenue (Million) Forecast, by Application 2019 & 2032
- Table 13: France Insurance Fraud Detection Industry Revenue (Million) Forecast, by Application 2019 & 2032
- Table 14: Spain Insurance Fraud Detection Industry Revenue (Million) Forecast, by Application 2019 & 2032
- Table 15: Italy Insurance Fraud Detection Industry Revenue (Million) Forecast, by Application 2019 & 2032
- Table 16: Spain Insurance Fraud Detection Industry Revenue (Million) Forecast, by Application 2019 & 2032
- Table 17: Belgium Insurance Fraud Detection Industry Revenue (Million) Forecast, by Application 2019 & 2032
- Table 18: Netherland Insurance Fraud Detection Industry Revenue (Million) Forecast, by Application 2019 & 2032
- Table 19: Nordics Insurance Fraud Detection Industry Revenue (Million) Forecast, by Application 2019 & 2032
- Table 20: Rest of Europe Insurance Fraud Detection Industry Revenue (Million) Forecast, by Application 2019 & 2032
- Table 21: Global Insurance Fraud Detection Industry Revenue Million Forecast, by Country 2019 & 2032
- Table 22: China Insurance Fraud Detection Industry Revenue (Million) Forecast, by Application 2019 & 2032
- Table 23: Japan Insurance Fraud Detection Industry Revenue (Million) Forecast, by Application 2019 & 2032
- Table 24: India Insurance Fraud Detection Industry Revenue (Million) Forecast, by Application 2019 & 2032
- Table 25: South Korea Insurance Fraud Detection Industry Revenue (Million) Forecast, by Application 2019 & 2032
- Table 26: Southeast Asia Insurance Fraud Detection Industry Revenue (Million) Forecast, by Application 2019 & 2032
- Table 27: Australia Insurance Fraud Detection Industry Revenue (Million) Forecast, by Application 2019 & 2032
- Table 28: Indonesia Insurance Fraud Detection Industry Revenue (Million) Forecast, by Application 2019 & 2032
- Table 29: Phillipes Insurance Fraud Detection Industry Revenue (Million) Forecast, by Application 2019 & 2032
- Table 30: Singapore Insurance Fraud Detection Industry Revenue (Million) Forecast, by Application 2019 & 2032
- Table 31: Thailandc Insurance Fraud Detection Industry Revenue (Million) Forecast, by Application 2019 & 2032
- Table 32: Rest of Asia Pacific Insurance Fraud Detection Industry Revenue (Million) Forecast, by Application 2019 & 2032
- Table 33: Global Insurance Fraud Detection Industry Revenue Million Forecast, by Country 2019 & 2032
- Table 34: Brazil Insurance Fraud Detection Industry Revenue (Million) Forecast, by Application 2019 & 2032
- Table 35: Argentina Insurance Fraud Detection Industry Revenue (Million) Forecast, by Application 2019 & 2032
- Table 36: Peru Insurance Fraud Detection Industry Revenue (Million) Forecast, by Application 2019 & 2032
- Table 37: Chile Insurance Fraud Detection Industry Revenue (Million) Forecast, by Application 2019 & 2032
- Table 38: Colombia Insurance Fraud Detection Industry Revenue (Million) Forecast, by Application 2019 & 2032
- Table 39: Ecuador Insurance Fraud Detection Industry Revenue (Million) Forecast, by Application 2019 & 2032
- Table 40: Venezuela Insurance Fraud Detection Industry Revenue (Million) Forecast, by Application 2019 & 2032
- Table 41: Rest of South America Insurance Fraud Detection Industry Revenue (Million) Forecast, by Application 2019 & 2032
- Table 42: Global Insurance Fraud Detection Industry Revenue Million Forecast, by Country 2019 & 2032
- Table 43: United States Insurance Fraud Detection Industry Revenue (Million) Forecast, by Application 2019 & 2032
- Table 44: Canada Insurance Fraud Detection Industry Revenue (Million) Forecast, by Application 2019 & 2032
- Table 45: Mexico Insurance Fraud Detection Industry Revenue (Million) Forecast, by Application 2019 & 2032
- Table 46: Global Insurance Fraud Detection Industry Revenue Million Forecast, by Country 2019 & 2032
- Table 47: United Arab Emirates Insurance Fraud Detection Industry Revenue (Million) Forecast, by Application 2019 & 2032
- Table 48: Saudi Arabia Insurance Fraud Detection Industry Revenue (Million) Forecast, by Application 2019 & 2032
- Table 49: South Africa Insurance Fraud Detection Industry Revenue (Million) Forecast, by Application 2019 & 2032
- Table 50: Rest of Middle East and Africa Insurance Fraud Detection Industry Revenue (Million) Forecast, by Application 2019 & 2032
- Table 51: Global Insurance Fraud Detection Industry Revenue Million Forecast, by Component 2019 & 2032
- Table 52: Global Insurance Fraud Detection Industry Revenue Million Forecast, by Applcation 2019 & 2032
- Table 53: Global Insurance Fraud Detection Industry Revenue Million Forecast, by End-user Indsutry 2019 & 2032
- Table 54: Global Insurance Fraud Detection Industry Revenue Million Forecast, by Country 2019 & 2032
- Table 55: United States Insurance Fraud Detection Industry Revenue (Million) Forecast, by Application 2019 & 2032
- Table 56: Canada Insurance Fraud Detection Industry Revenue (Million) Forecast, by Application 2019 & 2032
- Table 57: Global Insurance Fraud Detection Industry Revenue Million Forecast, by Component 2019 & 2032
- Table 58: Global Insurance Fraud Detection Industry Revenue Million Forecast, by Applcation 2019 & 2032
- Table 59: Global Insurance Fraud Detection Industry Revenue Million Forecast, by End-user Indsutry 2019 & 2032
- Table 60: Global Insurance Fraud Detection Industry Revenue Million Forecast, by Country 2019 & 2032
- Table 61: United Kingdom Insurance Fraud Detection Industry Revenue (Million) Forecast, by Application 2019 & 2032
- Table 62: Germany Insurance Fraud Detection Industry Revenue (Million) Forecast, by Application 2019 & 2032
- Table 63: France Insurance Fraud Detection Industry Revenue (Million) Forecast, by Application 2019 & 2032
- Table 64: Global Insurance Fraud Detection Industry Revenue Million Forecast, by Component 2019 & 2032
- Table 65: Global Insurance Fraud Detection Industry Revenue Million Forecast, by Applcation 2019 & 2032
- Table 66: Global Insurance Fraud Detection Industry Revenue Million Forecast, by End-user Indsutry 2019 & 2032
- Table 67: Global Insurance Fraud Detection Industry Revenue Million Forecast, by Country 2019 & 2032
- Table 68: China Insurance Fraud Detection Industry Revenue (Million) Forecast, by Application 2019 & 2032
- Table 69: Japan Insurance Fraud Detection Industry Revenue (Million) Forecast, by Application 2019 & 2032
- Table 70: India Insurance Fraud Detection Industry Revenue (Million) Forecast, by Application 2019 & 2032
- Table 71: Rest of Asia Pacific Insurance Fraud Detection Industry Revenue (Million) Forecast, by Application 2019 & 2032
- Table 72: Global Insurance Fraud Detection Industry Revenue Million Forecast, by Component 2019 & 2032
- Table 73: Global Insurance Fraud Detection Industry Revenue Million Forecast, by Applcation 2019 & 2032
- Table 74: Global Insurance Fraud Detection Industry Revenue Million Forecast, by End-user Indsutry 2019 & 2032
- Table 75: Global Insurance Fraud Detection Industry Revenue Million Forecast, by Country 2019 & 2032
- Table 76: Global Insurance Fraud Detection Industry Revenue Million Forecast, by Component 2019 & 2032
- Table 77: Global Insurance Fraud Detection Industry Revenue Million Forecast, by Applcation 2019 & 2032
- Table 78: Global Insurance Fraud Detection Industry Revenue Million Forecast, by End-user Indsutry 2019 & 2032
- Table 79: Global Insurance Fraud Detection Industry Revenue Million Forecast, by Country 2019 & 2032
Frequently Asked Questions
1. What is the projected Compound Annual Growth Rate (CAGR) of the Insurance Fraud Detection Industry?
The projected CAGR is approximately 26.01%.
2. Which companies are prominent players in the Insurance Fraud Detection Industry?
Key companies in the market include SAS Institute Inc, BAE Systems Inc, Fiserv Inc, IBM Corporation, Experian Information Solutions Inc, Fair Isaac Corporation (FICO), FRISS Fraudebestrijding BV, Lexisnexis Risk Solutions Inc (Relx Group PLC), SAP SE.
3. What are the main segments of the Insurance Fraud Detection Industry?
The market segments include Component, Applcation, End-user Indsutry.
4. Can you provide details about the market size?
The market size is estimated to be USD 5.69 Million as of 2022.
5. What are some drivers contributing to market growth?
Need to Effectively Manage Huge Volumes of Identities; Improved Operational Efficiency and Enhanced Customer Experience.
6. What are the notable trends driving market growth?
Fraud Analytics Solution Segment is Expected to Hold Significant Market Share.
7. Are there any restraints impacting market growth?
Lack of Awareness Regarding Fraud Detection Solutions.
8. Can you provide examples of recent developments in the market?
May 2023 - Insurance data analytics provider Verisk partnered with CCC Intelligent Solutions, a cloud platform for the P&C insurance market, to address the risk of insurance fraud. The partnership will integrate Verisk's claims fraud detection analytics with CCC's claims platform.
9. What pricing options are available for accessing the report?
Pricing options include single-user, multi-user, and enterprise licenses priced at USD 4750, USD 5250, and USD 8750 respectively.
10. Is the market size provided in terms of value or volume?
The market size is provided in terms of value, measured in Million.
11. Are there any specific market keywords associated with the report?
Yes, the market keyword associated with the report is "Insurance Fraud Detection Industry," which aids in identifying and referencing the specific market segment covered.
12. How do I determine which pricing option suits my needs best?
The pricing options vary based on user requirements and access needs. Individual users may opt for single-user licenses, while businesses requiring broader access may choose multi-user or enterprise licenses for cost-effective access to the report.
13. Are there any additional resources or data provided in the Insurance Fraud Detection Industry report?
While the report offers comprehensive insights, it's advisable to review the specific contents or supplementary materials provided to ascertain if additional resources or data are available.
14. How can I stay updated on further developments or reports in the Insurance Fraud Detection Industry?
To stay informed about further developments, trends, and reports in the Insurance Fraud Detection Industry, consider subscribing to industry newsletters, following relevant companies and organizations, or regularly checking reputable industry news sources and publications.
Methodology
Step 1 - Identification of Relevant Samples Size from Population Database


Step 2 - Approaches for Defining Global Market Size (Value, Volume* & Price*)

Note*: In applicable scenarios
Step 3 - Data Sources
Primary Research
- Web Analytics
- Survey Reports
- Research Institute
- Latest Research Reports
- Opinion Leaders
Secondary Research
- Annual Reports
- White Paper
- Latest Press Release
- Industry Association
- Paid Database
- Investor Presentations

Step 4 - Data Triangulation
Involves using different sources of information in order to increase the validity of a study
These sources are likely to be stakeholders in a program - participants, other researchers, program staff, other community members, and so on.
Then we put all data in single framework & apply various statistical tools to find out the dynamic on the market.
During the analysis stage, feedback from the stakeholder groups would be compared to determine areas of agreement as well as areas of divergence


