
Key Insights
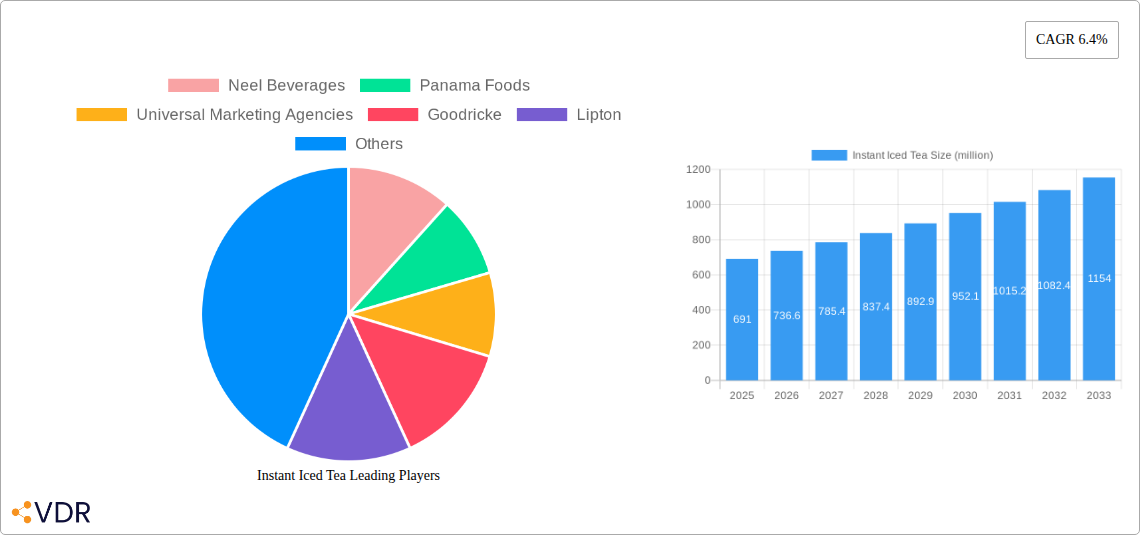
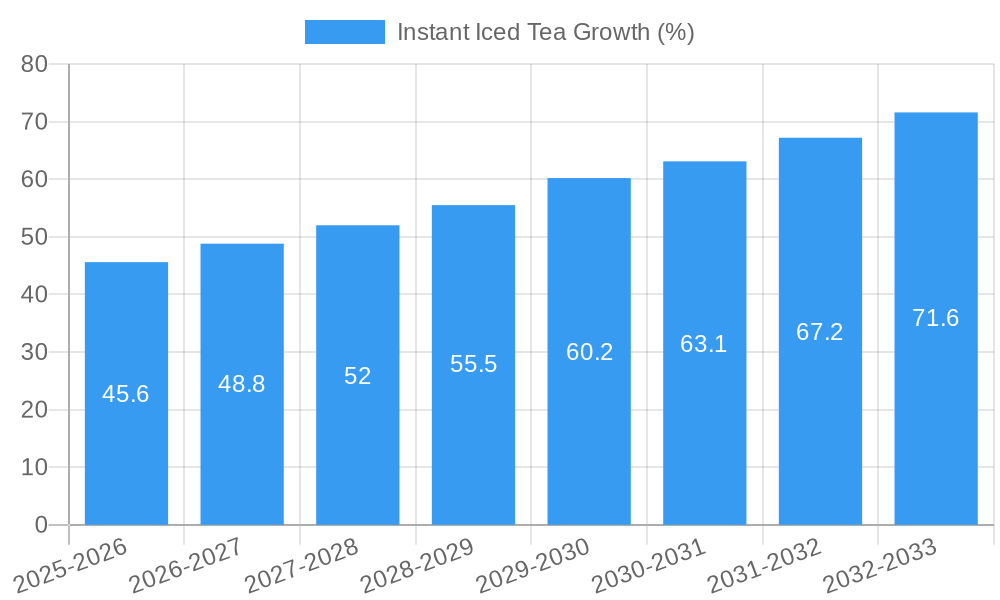
The instant iced tea market, valued at $691 million in 2025, is projected to experience robust growth, driven by several key factors. The rising popularity of ready-to-drink beverages, particularly among younger demographics seeking convenient and refreshing options, is a major catalyst. Increasing disposable incomes, especially in developing economies, further fuel demand for premium and convenient beverage choices like instant iced tea. Health-conscious consumers are also driving growth, with many opting for iced tea as a lower-calorie alternative to sugary sodas. Product innovation, including the introduction of new flavors, functional ingredients (like antioxidants or added vitamins), and sustainable packaging options, are also contributing to market expansion. The competitive landscape is characterized by a mix of established multinational players like Lipton and Nestea, alongside regional and local brands catering to specific tastes and preferences. This diverse range of offerings caters to varied consumer needs and preferences, further stimulating market growth.
However, challenges remain. Fluctuations in raw material prices, particularly tea leaves and sweeteners, can impact profitability. Furthermore, consumer preferences are dynamic; shifts in taste and the emergence of competing beverages require manufacturers to continuously innovate and adapt. Environmental concerns surrounding packaging waste also pose a challenge, pushing companies to adopt eco-friendly solutions. Despite these restraints, the long-term outlook for the instant iced tea market remains positive, with a projected Compound Annual Growth Rate (CAGR) of 6.4% from 2025 to 2033. This growth will be fueled by ongoing consumer demand for convenience, health-conscious options, and the continuous innovation within the industry. Strategic partnerships, targeted marketing campaigns, and expansion into new markets will be critical for companies to capitalize on the market's growth potential.
Instant Iced Tea Market Report: 2019-2033
This comprehensive report provides an in-depth analysis of the global instant iced tea market, offering invaluable insights for industry professionals, investors, and strategic decision-makers. We delve into market dynamics, growth trends, competitive landscape, and future prospects, covering the period from 2019 to 2033. The report leverages extensive data analysis and expert insights to deliver a clear and actionable understanding of this dynamic market segment, including a detailed breakdown by key regions and segments. The base year for this report is 2025, with estimations for 2025 and a forecast period spanning 2025-2033. The historical period covered is 2019-2024.
Instant Iced Tea Market Dynamics & Structure
The global instant iced tea market, valued at xx million units in 2025, is characterized by a moderately concentrated structure with key players like Lipton, Nestea, and Arizona Beverage holding significant market share. Technological innovation, particularly in packaging and flavor profiles, is a key driver. Regulatory frameworks concerning sugar content and additives influence product development. Ready-to-drink iced tea and other beverages pose competitive substitution threats. The primary end-users are young adults and health-conscious consumers. M&A activity in the sector has been moderate, with xx major deals recorded between 2019 and 2024.
- Market Concentration: Highly concentrated with the top 5 players holding approximately xx% market share in 2025.
- Technological Innovation: Focus on natural sweeteners, functional ingredients, and convenient packaging formats.
- Regulatory Landscape: Increasing regulations on sugar content and labeling are impacting product formulation.
- Competitive Substitutes: Ready-to-drink iced tea, fruit juices, and other flavored beverages.
- End-User Demographics: Primarily young adults (18-35 years) and health-conscious consumers.
- M&A Activity: xx major mergers and acquisitions recorded between 2019 and 2024, representing a xx million unit market value.
Instant Iced Tea Growth Trends & Insights
The instant iced tea market exhibits robust growth, driven by increasing consumer demand for convenient and refreshing beverages. The market size grew from xx million units in 2019 to xx million units in 2024, exhibiting a CAGR of xx%. This growth is fueled by rising disposable incomes, changing lifestyles, and the increasing popularity of ready-to-drink beverages. Technological disruptions such as improved packaging and flavor innovations further contribute to market expansion. Consumer behavior shifts towards healthier options are also influencing the market, pushing manufacturers to offer low-sugar and organic options. Market penetration continues to rise, particularly in emerging economies.
Dominant Regions, Countries, or Segments in Instant Iced Tea
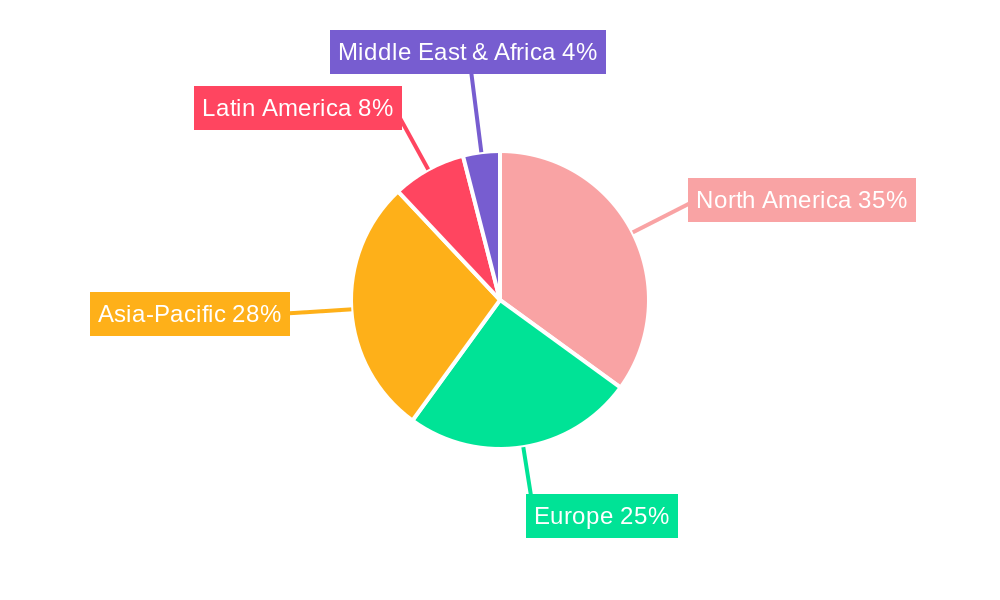
North America dominates the instant iced tea market, accounting for approximately xx% of the global market share in 2025. This dominance is attributed to high per capita consumption, established distribution networks, and a strong preference for ready-to-drink beverages. Strong economic growth, established infrastructure, and high consumer spending power contribute to this region's leading position. Asia-Pacific is expected to show the fastest growth over the forecast period, driven by rising disposable incomes and changing consumer preferences.
- Key Drivers in North America: High per capita consumption, robust distribution networks, strong consumer preference for ready-to-drink beverages.
- Key Drivers in Asia-Pacific: Rapidly growing middle class, increasing disposable incomes, and evolving consumer tastes.
- Market Share: North America (xx%), Asia-Pacific (xx%), Europe (xx%), Rest of World (xx%) in 2025.
- Growth Potential: Asia-Pacific projected to exhibit the highest growth rate during 2025-2033.
Instant Iced Tea Product Landscape
Instant iced tea products are experiencing significant innovation, focusing on healthier formulations, convenient packaging, and diverse flavor profiles. The market offers a wide range of options, including powder mixes, ready-to-drink bottles, and single-serve sachets. Unique selling propositions include natural ingredients, low-sugar options, and functional benefits like added vitamins or antioxidants. Advancements in packaging technology enhance product shelf life and convenience.
Key Drivers, Barriers & Challenges in Instant Iced Tea
Key Drivers: Rising disposable incomes, changing lifestyles, increasing demand for convenient beverages, and technological advancements in flavor and packaging.
Key Challenges: Intense competition, fluctuating raw material prices, and stringent regulatory requirements concerning sugar content and labeling. Supply chain disruptions could impact availability and pricing. Competitive pressures from other beverages create challenges in market share maintenance.
Emerging Opportunities in Instant Iced Tea
Untapped markets in developing economies, particularly in Africa and Latin America, present significant growth opportunities. The increasing demand for organic and functional beverages opens doors for innovative product development. Evolving consumer preferences towards healthier options drive the need for low-sugar, natural ingredient-based formulations.
Growth Accelerators in the Instant Iced Tea Industry
Technological breakthroughs in packaging and flavor enhancement will accelerate market growth. Strategic partnerships between manufacturers and retailers will optimize distribution and reach a wider customer base. Expansion into new markets and strategic product diversification will fuel long-term growth.
Key Players Shaping the Instant Iced Tea Market
- Neel Beverages
- Panama Foods
- Universal Marketing Agencies
- Goodricke
- Lipton
- Purisure
- InstantTeas
- Nestea
- Arizona Beverage
- 4C Foods
- BOH Plantations
- GFB Food
- Vending Updates
Notable Milestones in Instant Iced Tea Sector
- 2020: Lipton launched a new line of organic instant iced tea.
- 2022: Nestea introduced a range of functional instant iced teas with added vitamins.
- 2023: A major merger between two key players resulted in a significant market consolidation.
In-Depth Instant Iced Tea Market Outlook
The instant iced tea market is poised for continued expansion, driven by sustained consumer demand and technological advancements. Strategic opportunities exist in product diversification, market expansion into untapped regions, and leveraging partnerships to enhance distribution networks. The market is expected to reach xx million units by 2033, demonstrating a healthy growth trajectory.
Instant Iced Tea Segmentation
-
1. Application
- 1.1. Online Sales
- 1.2. Offline Sales
-
2. Types
- 2.1. Sugar Free
- 2.2. Sugary
Instant Iced Tea Segmentation By Geography
-
1. North America
- 1.1. United States
- 1.2. Canada
- 1.3. Mexico
-
2. South America
- 2.1. Brazil
- 2.2. Argentina
- 2.3. Rest of South America
-
3. Europe
- 3.1. United Kingdom
- 3.2. Germany
- 3.3. France
- 3.4. Italy
- 3.5. Spain
- 3.6. Russia
- 3.7. Benelux
- 3.8. Nordics
- 3.9. Rest of Europe
-
4. Middle East & Africa
- 4.1. Turkey
- 4.2. Israel
- 4.3. GCC
- 4.4. North Africa
- 4.5. South Africa
- 4.6. Rest of Middle East & Africa
-
5. Asia Pacific
- 5.1. China
- 5.2. India
- 5.3. Japan
- 5.4. South Korea
- 5.5. ASEAN
- 5.6. Oceania
- 5.7. Rest of Asia Pacific
Instant Iced Tea REPORT HIGHLIGHTS
| Aspects | Details |
|---|---|
| Study Period | 2019-2033 |
| Base Year | 2024 |
| Estimated Year | 2025 |
| Forecast Period | 2025-2033 |
| Historical Period | 2019-2024 |
| Growth Rate | CAGR of 6.4% from 2019-2033 |
| Segmentation |
|
Table of Contents
- 1. Introduction
- 1.1. Research Scope
- 1.2. Market Segmentation
- 1.3. Research Methodology
- 1.4. Definitions and Assumptions
- 2. Executive Summary
- 2.1. Introduction
- 3. Market Dynamics
- 3.1. Introduction
- 3.2. Market Drivers
- 3.3. Market Restrains
- 3.4. Market Trends
- 4. Market Factor Analysis
- 4.1. Porters Five Forces
- 4.2. Supply/Value Chain
- 4.3. PESTEL analysis
- 4.4. Market Entropy
- 4.5. Patent/Trademark Analysis
- 5. Global Instant Iced Tea Analysis, Insights and Forecast, 2019-2031
- 5.1. Market Analysis, Insights and Forecast - by Application
- 5.1.1. Online Sales
- 5.1.2. Offline Sales
- 5.2. Market Analysis, Insights and Forecast - by Types
- 5.2.1. Sugar Free
- 5.2.2. Sugary
- 5.3. Market Analysis, Insights and Forecast - by Region
- 5.3.1. North America
- 5.3.2. South America
- 5.3.3. Europe
- 5.3.4. Middle East & Africa
- 5.3.5. Asia Pacific
- 5.1. Market Analysis, Insights and Forecast - by Application
- 6. North America Instant Iced Tea Analysis, Insights and Forecast, 2019-2031
- 6.1. Market Analysis, Insights and Forecast - by Application
- 6.1.1. Online Sales
- 6.1.2. Offline Sales
- 6.2. Market Analysis, Insights and Forecast - by Types
- 6.2.1. Sugar Free
- 6.2.2. Sugary
- 6.1. Market Analysis, Insights and Forecast - by Application
- 7. South America Instant Iced Tea Analysis, Insights and Forecast, 2019-2031
- 7.1. Market Analysis, Insights and Forecast - by Application
- 7.1.1. Online Sales
- 7.1.2. Offline Sales
- 7.2. Market Analysis, Insights and Forecast - by Types
- 7.2.1. Sugar Free
- 7.2.2. Sugary
- 7.1. Market Analysis, Insights and Forecast - by Application
- 8. Europe Instant Iced Tea Analysis, Insights and Forecast, 2019-2031
- 8.1. Market Analysis, Insights and Forecast - by Application
- 8.1.1. Online Sales
- 8.1.2. Offline Sales
- 8.2. Market Analysis, Insights and Forecast - by Types
- 8.2.1. Sugar Free
- 8.2.2. Sugary
- 8.1. Market Analysis, Insights and Forecast - by Application
- 9. Middle East & Africa Instant Iced Tea Analysis, Insights and Forecast, 2019-2031
- 9.1. Market Analysis, Insights and Forecast - by Application
- 9.1.1. Online Sales
- 9.1.2. Offline Sales
- 9.2. Market Analysis, Insights and Forecast - by Types
- 9.2.1. Sugar Free
- 9.2.2. Sugary
- 9.1. Market Analysis, Insights and Forecast - by Application
- 10. Asia Pacific Instant Iced Tea Analysis, Insights and Forecast, 2019-2031
- 10.1. Market Analysis, Insights and Forecast - by Application
- 10.1.1. Online Sales
- 10.1.2. Offline Sales
- 10.2. Market Analysis, Insights and Forecast - by Types
- 10.2.1. Sugar Free
- 10.2.2. Sugary
- 10.1. Market Analysis, Insights and Forecast - by Application
- 11. Competitive Analysis
- 11.1. Global Market Share Analysis 2024
- 11.2. Company Profiles
- 11.2.1 Neel Beverages
- 11.2.1.1. Overview
- 11.2.1.2. Products
- 11.2.1.3. SWOT Analysis
- 11.2.1.4. Recent Developments
- 11.2.1.5. Financials (Based on Availability)
- 11.2.2 Panama Foods
- 11.2.2.1. Overview
- 11.2.2.2. Products
- 11.2.2.3. SWOT Analysis
- 11.2.2.4. Recent Developments
- 11.2.2.5. Financials (Based on Availability)
- 11.2.3 Universal Marketing Agencies
- 11.2.3.1. Overview
- 11.2.3.2. Products
- 11.2.3.3. SWOT Analysis
- 11.2.3.4. Recent Developments
- 11.2.3.5. Financials (Based on Availability)
- 11.2.4 Goodricke
- 11.2.4.1. Overview
- 11.2.4.2. Products
- 11.2.4.3. SWOT Analysis
- 11.2.4.4. Recent Developments
- 11.2.4.5. Financials (Based on Availability)
- 11.2.5 Lipton
- 11.2.5.1. Overview
- 11.2.5.2. Products
- 11.2.5.3. SWOT Analysis
- 11.2.5.4. Recent Developments
- 11.2.5.5. Financials (Based on Availability)
- 11.2.6 Purisure
- 11.2.6.1. Overview
- 11.2.6.2. Products
- 11.2.6.3. SWOT Analysis
- 11.2.6.4. Recent Developments
- 11.2.6.5. Financials (Based on Availability)
- 11.2.7 InstantTeas
- 11.2.7.1. Overview
- 11.2.7.2. Products
- 11.2.7.3. SWOT Analysis
- 11.2.7.4. Recent Developments
- 11.2.7.5. Financials (Based on Availability)
- 11.2.8 Nestea
- 11.2.8.1. Overview
- 11.2.8.2. Products
- 11.2.8.3. SWOT Analysis
- 11.2.8.4. Recent Developments
- 11.2.8.5. Financials (Based on Availability)
- 11.2.9 Arizona Beverage
- 11.2.9.1. Overview
- 11.2.9.2. Products
- 11.2.9.3. SWOT Analysis
- 11.2.9.4. Recent Developments
- 11.2.9.5. Financials (Based on Availability)
- 11.2.10 4C Foods
- 11.2.10.1. Overview
- 11.2.10.2. Products
- 11.2.10.3. SWOT Analysis
- 11.2.10.4. Recent Developments
- 11.2.10.5. Financials (Based on Availability)
- 11.2.11 BOH Plantations
- 11.2.11.1. Overview
- 11.2.11.2. Products
- 11.2.11.3. SWOT Analysis
- 11.2.11.4. Recent Developments
- 11.2.11.5. Financials (Based on Availability)
- 11.2.12 GFB Food
- 11.2.12.1. Overview
- 11.2.12.2. Products
- 11.2.12.3. SWOT Analysis
- 11.2.12.4. Recent Developments
- 11.2.12.5. Financials (Based on Availability)
- 11.2.13 Vending Updates
- 11.2.13.1. Overview
- 11.2.13.2. Products
- 11.2.13.3. SWOT Analysis
- 11.2.13.4. Recent Developments
- 11.2.13.5. Financials (Based on Availability)
- 11.2.1 Neel Beverages
List of Figures
- Figure 1: Global Instant Iced Tea Revenue Breakdown (million, %) by Region 2024 & 2032
- Figure 2: Global Instant Iced Tea Volume Breakdown (K, %) by Region 2024 & 2032
- Figure 3: North America Instant Iced Tea Revenue (million), by Application 2024 & 2032
- Figure 4: North America Instant Iced Tea Volume (K), by Application 2024 & 2032
- Figure 5: North America Instant Iced Tea Revenue Share (%), by Application 2024 & 2032
- Figure 6: North America Instant Iced Tea Volume Share (%), by Application 2024 & 2032
- Figure 7: North America Instant Iced Tea Revenue (million), by Types 2024 & 2032
- Figure 8: North America Instant Iced Tea Volume (K), by Types 2024 & 2032
- Figure 9: North America Instant Iced Tea Revenue Share (%), by Types 2024 & 2032
- Figure 10: North America Instant Iced Tea Volume Share (%), by Types 2024 & 2032
- Figure 11: North America Instant Iced Tea Revenue (million), by Country 2024 & 2032
- Figure 12: North America Instant Iced Tea Volume (K), by Country 2024 & 2032
- Figure 13: North America Instant Iced Tea Revenue Share (%), by Country 2024 & 2032
- Figure 14: North America Instant Iced Tea Volume Share (%), by Country 2024 & 2032
- Figure 15: South America Instant Iced Tea Revenue (million), by Application 2024 & 2032
- Figure 16: South America Instant Iced Tea Volume (K), by Application 2024 & 2032
- Figure 17: South America Instant Iced Tea Revenue Share (%), by Application 2024 & 2032
- Figure 18: South America Instant Iced Tea Volume Share (%), by Application 2024 & 2032
- Figure 19: South America Instant Iced Tea Revenue (million), by Types 2024 & 2032
- Figure 20: South America Instant Iced Tea Volume (K), by Types 2024 & 2032
- Figure 21: South America Instant Iced Tea Revenue Share (%), by Types 2024 & 2032
- Figure 22: South America Instant Iced Tea Volume Share (%), by Types 2024 & 2032
- Figure 23: South America Instant Iced Tea Revenue (million), by Country 2024 & 2032
- Figure 24: South America Instant Iced Tea Volume (K), by Country 2024 & 2032
- Figure 25: South America Instant Iced Tea Revenue Share (%), by Country 2024 & 2032
- Figure 26: South America Instant Iced Tea Volume Share (%), by Country 2024 & 2032
- Figure 27: Europe Instant Iced Tea Revenue (million), by Application 2024 & 2032
- Figure 28: Europe Instant Iced Tea Volume (K), by Application 2024 & 2032
- Figure 29: Europe Instant Iced Tea Revenue Share (%), by Application 2024 & 2032
- Figure 30: Europe Instant Iced Tea Volume Share (%), by Application 2024 & 2032
- Figure 31: Europe Instant Iced Tea Revenue (million), by Types 2024 & 2032
- Figure 32: Europe Instant Iced Tea Volume (K), by Types 2024 & 2032
- Figure 33: Europe Instant Iced Tea Revenue Share (%), by Types 2024 & 2032
- Figure 34: Europe Instant Iced Tea Volume Share (%), by Types 2024 & 2032
- Figure 35: Europe Instant Iced Tea Revenue (million), by Country 2024 & 2032
- Figure 36: Europe Instant Iced Tea Volume (K), by Country 2024 & 2032
- Figure 37: Europe Instant Iced Tea Revenue Share (%), by Country 2024 & 2032
- Figure 38: Europe Instant Iced Tea Volume Share (%), by Country 2024 & 2032
- Figure 39: Middle East & Africa Instant Iced Tea Revenue (million), by Application 2024 & 2032
- Figure 40: Middle East & Africa Instant Iced Tea Volume (K), by Application 2024 & 2032
- Figure 41: Middle East & Africa Instant Iced Tea Revenue Share (%), by Application 2024 & 2032
- Figure 42: Middle East & Africa Instant Iced Tea Volume Share (%), by Application 2024 & 2032
- Figure 43: Middle East & Africa Instant Iced Tea Revenue (million), by Types 2024 & 2032
- Figure 44: Middle East & Africa Instant Iced Tea Volume (K), by Types 2024 & 2032
- Figure 45: Middle East & Africa Instant Iced Tea Revenue Share (%), by Types 2024 & 2032
- Figure 46: Middle East & Africa Instant Iced Tea Volume Share (%), by Types 2024 & 2032
- Figure 47: Middle East & Africa Instant Iced Tea Revenue (million), by Country 2024 & 2032
- Figure 48: Middle East & Africa Instant Iced Tea Volume (K), by Country 2024 & 2032
- Figure 49: Middle East & Africa Instant Iced Tea Revenue Share (%), by Country 2024 & 2032
- Figure 50: Middle East & Africa Instant Iced Tea Volume Share (%), by Country 2024 & 2032
- Figure 51: Asia Pacific Instant Iced Tea Revenue (million), by Application 2024 & 2032
- Figure 52: Asia Pacific Instant Iced Tea Volume (K), by Application 2024 & 2032
- Figure 53: Asia Pacific Instant Iced Tea Revenue Share (%), by Application 2024 & 2032
- Figure 54: Asia Pacific Instant Iced Tea Volume Share (%), by Application 2024 & 2032
- Figure 55: Asia Pacific Instant Iced Tea Revenue (million), by Types 2024 & 2032
- Figure 56: Asia Pacific Instant Iced Tea Volume (K), by Types 2024 & 2032
- Figure 57: Asia Pacific Instant Iced Tea Revenue Share (%), by Types 2024 & 2032
- Figure 58: Asia Pacific Instant Iced Tea Volume Share (%), by Types 2024 & 2032
- Figure 59: Asia Pacific Instant Iced Tea Revenue (million), by Country 2024 & 2032
- Figure 60: Asia Pacific Instant Iced Tea Volume (K), by Country 2024 & 2032
- Figure 61: Asia Pacific Instant Iced Tea Revenue Share (%), by Country 2024 & 2032
- Figure 62: Asia Pacific Instant Iced Tea Volume Share (%), by Country 2024 & 2032
List of Tables
- Table 1: Global Instant Iced Tea Revenue million Forecast, by Region 2019 & 2032
- Table 2: Global Instant Iced Tea Volume K Forecast, by Region 2019 & 2032
- Table 3: Global Instant Iced Tea Revenue million Forecast, by Application 2019 & 2032
- Table 4: Global Instant Iced Tea Volume K Forecast, by Application 2019 & 2032
- Table 5: Global Instant Iced Tea Revenue million Forecast, by Types 2019 & 2032
- Table 6: Global Instant Iced Tea Volume K Forecast, by Types 2019 & 2032
- Table 7: Global Instant Iced Tea Revenue million Forecast, by Region 2019 & 2032
- Table 8: Global Instant Iced Tea Volume K Forecast, by Region 2019 & 2032
- Table 9: Global Instant Iced Tea Revenue million Forecast, by Application 2019 & 2032
- Table 10: Global Instant Iced Tea Volume K Forecast, by Application 2019 & 2032
- Table 11: Global Instant Iced Tea Revenue million Forecast, by Types 2019 & 2032
- Table 12: Global Instant Iced Tea Volume K Forecast, by Types 2019 & 2032
- Table 13: Global Instant Iced Tea Revenue million Forecast, by Country 2019 & 2032
- Table 14: Global Instant Iced Tea Volume K Forecast, by Country 2019 & 2032
- Table 15: United States Instant Iced Tea Revenue (million) Forecast, by Application 2019 & 2032
- Table 16: United States Instant Iced Tea Volume (K) Forecast, by Application 2019 & 2032
- Table 17: Canada Instant Iced Tea Revenue (million) Forecast, by Application 2019 & 2032
- Table 18: Canada Instant Iced Tea Volume (K) Forecast, by Application 2019 & 2032
- Table 19: Mexico Instant Iced Tea Revenue (million) Forecast, by Application 2019 & 2032
- Table 20: Mexico Instant Iced Tea Volume (K) Forecast, by Application 2019 & 2032
- Table 21: Global Instant Iced Tea Revenue million Forecast, by Application 2019 & 2032
- Table 22: Global Instant Iced Tea Volume K Forecast, by Application 2019 & 2032
- Table 23: Global Instant Iced Tea Revenue million Forecast, by Types 2019 & 2032
- Table 24: Global Instant Iced Tea Volume K Forecast, by Types 2019 & 2032
- Table 25: Global Instant Iced Tea Revenue million Forecast, by Country 2019 & 2032
- Table 26: Global Instant Iced Tea Volume K Forecast, by Country 2019 & 2032
- Table 27: Brazil Instant Iced Tea Revenue (million) Forecast, by Application 2019 & 2032
- Table 28: Brazil Instant Iced Tea Volume (K) Forecast, by Application 2019 & 2032
- Table 29: Argentina Instant Iced Tea Revenue (million) Forecast, by Application 2019 & 2032
- Table 30: Argentina Instant Iced Tea Volume (K) Forecast, by Application 2019 & 2032
- Table 31: Rest of South America Instant Iced Tea Revenue (million) Forecast, by Application 2019 & 2032
- Table 32: Rest of South America Instant Iced Tea Volume (K) Forecast, by Application 2019 & 2032
- Table 33: Global Instant Iced Tea Revenue million Forecast, by Application 2019 & 2032
- Table 34: Global Instant Iced Tea Volume K Forecast, by Application 2019 & 2032
- Table 35: Global Instant Iced Tea Revenue million Forecast, by Types 2019 & 2032
- Table 36: Global Instant Iced Tea Volume K Forecast, by Types 2019 & 2032
- Table 37: Global Instant Iced Tea Revenue million Forecast, by Country 2019 & 2032
- Table 38: Global Instant Iced Tea Volume K Forecast, by Country 2019 & 2032
- Table 39: United Kingdom Instant Iced Tea Revenue (million) Forecast, by Application 2019 & 2032
- Table 40: United Kingdom Instant Iced Tea Volume (K) Forecast, by Application 2019 & 2032
- Table 41: Germany Instant Iced Tea Revenue (million) Forecast, by Application 2019 & 2032
- Table 42: Germany Instant Iced Tea Volume (K) Forecast, by Application 2019 & 2032
- Table 43: France Instant Iced Tea Revenue (million) Forecast, by Application 2019 & 2032
- Table 44: France Instant Iced Tea Volume (K) Forecast, by Application 2019 & 2032
- Table 45: Italy Instant Iced Tea Revenue (million) Forecast, by Application 2019 & 2032
- Table 46: Italy Instant Iced Tea Volume (K) Forecast, by Application 2019 & 2032
- Table 47: Spain Instant Iced Tea Revenue (million) Forecast, by Application 2019 & 2032
- Table 48: Spain Instant Iced Tea Volume (K) Forecast, by Application 2019 & 2032
- Table 49: Russia Instant Iced Tea Revenue (million) Forecast, by Application 2019 & 2032
- Table 50: Russia Instant Iced Tea Volume (K) Forecast, by Application 2019 & 2032
- Table 51: Benelux Instant Iced Tea Revenue (million) Forecast, by Application 2019 & 2032
- Table 52: Benelux Instant Iced Tea Volume (K) Forecast, by Application 2019 & 2032
- Table 53: Nordics Instant Iced Tea Revenue (million) Forecast, by Application 2019 & 2032
- Table 54: Nordics Instant Iced Tea Volume (K) Forecast, by Application 2019 & 2032
- Table 55: Rest of Europe Instant Iced Tea Revenue (million) Forecast, by Application 2019 & 2032
- Table 56: Rest of Europe Instant Iced Tea Volume (K) Forecast, by Application 2019 & 2032
- Table 57: Global Instant Iced Tea Revenue million Forecast, by Application 2019 & 2032
- Table 58: Global Instant Iced Tea Volume K Forecast, by Application 2019 & 2032
- Table 59: Global Instant Iced Tea Revenue million Forecast, by Types 2019 & 2032
- Table 60: Global Instant Iced Tea Volume K Forecast, by Types 2019 & 2032
- Table 61: Global Instant Iced Tea Revenue million Forecast, by Country 2019 & 2032
- Table 62: Global Instant Iced Tea Volume K Forecast, by Country 2019 & 2032
- Table 63: Turkey Instant Iced Tea Revenue (million) Forecast, by Application 2019 & 2032
- Table 64: Turkey Instant Iced Tea Volume (K) Forecast, by Application 2019 & 2032
- Table 65: Israel Instant Iced Tea Revenue (million) Forecast, by Application 2019 & 2032
- Table 66: Israel Instant Iced Tea Volume (K) Forecast, by Application 2019 & 2032
- Table 67: GCC Instant Iced Tea Revenue (million) Forecast, by Application 2019 & 2032
- Table 68: GCC Instant Iced Tea Volume (K) Forecast, by Application 2019 & 2032
- Table 69: North Africa Instant Iced Tea Revenue (million) Forecast, by Application 2019 & 2032
- Table 70: North Africa Instant Iced Tea Volume (K) Forecast, by Application 2019 & 2032
- Table 71: South Africa Instant Iced Tea Revenue (million) Forecast, by Application 2019 & 2032
- Table 72: South Africa Instant Iced Tea Volume (K) Forecast, by Application 2019 & 2032
- Table 73: Rest of Middle East & Africa Instant Iced Tea Revenue (million) Forecast, by Application 2019 & 2032
- Table 74: Rest of Middle East & Africa Instant Iced Tea Volume (K) Forecast, by Application 2019 & 2032
- Table 75: Global Instant Iced Tea Revenue million Forecast, by Application 2019 & 2032
- Table 76: Global Instant Iced Tea Volume K Forecast, by Application 2019 & 2032
- Table 77: Global Instant Iced Tea Revenue million Forecast, by Types 2019 & 2032
- Table 78: Global Instant Iced Tea Volume K Forecast, by Types 2019 & 2032
- Table 79: Global Instant Iced Tea Revenue million Forecast, by Country 2019 & 2032
- Table 80: Global Instant Iced Tea Volume K Forecast, by Country 2019 & 2032
- Table 81: China Instant Iced Tea Revenue (million) Forecast, by Application 2019 & 2032
- Table 82: China Instant Iced Tea Volume (K) Forecast, by Application 2019 & 2032
- Table 83: India Instant Iced Tea Revenue (million) Forecast, by Application 2019 & 2032
- Table 84: India Instant Iced Tea Volume (K) Forecast, by Application 2019 & 2032
- Table 85: Japan Instant Iced Tea Revenue (million) Forecast, by Application 2019 & 2032
- Table 86: Japan Instant Iced Tea Volume (K) Forecast, by Application 2019 & 2032
- Table 87: South Korea Instant Iced Tea Revenue (million) Forecast, by Application 2019 & 2032
- Table 88: South Korea Instant Iced Tea Volume (K) Forecast, by Application 2019 & 2032
- Table 89: ASEAN Instant Iced Tea Revenue (million) Forecast, by Application 2019 & 2032
- Table 90: ASEAN Instant Iced Tea Volume (K) Forecast, by Application 2019 & 2032
- Table 91: Oceania Instant Iced Tea Revenue (million) Forecast, by Application 2019 & 2032
- Table 92: Oceania Instant Iced Tea Volume (K) Forecast, by Application 2019 & 2032
- Table 93: Rest of Asia Pacific Instant Iced Tea Revenue (million) Forecast, by Application 2019 & 2032
- Table 94: Rest of Asia Pacific Instant Iced Tea Volume (K) Forecast, by Application 2019 & 2032
Frequently Asked Questions
1. What is the projected Compound Annual Growth Rate (CAGR) of the Instant Iced Tea?
The projected CAGR is approximately 6.4%.
2. Which companies are prominent players in the Instant Iced Tea?
Key companies in the market include Neel Beverages, Panama Foods, Universal Marketing Agencies, Goodricke, Lipton, Purisure, InstantTeas, Nestea, Arizona Beverage, 4C Foods, BOH Plantations, GFB Food, Vending Updates.
3. What are the main segments of the Instant Iced Tea?
The market segments include Application, Types.
4. Can you provide details about the market size?
The market size is estimated to be USD 691 million as of 2022.
5. What are some drivers contributing to market growth?
N/A
6. What are the notable trends driving market growth?
N/A
7. Are there any restraints impacting market growth?
N/A
8. Can you provide examples of recent developments in the market?
N/A
9. What pricing options are available for accessing the report?
Pricing options include single-user, multi-user, and enterprise licenses priced at USD 3950.00, USD 5925.00, and USD 7900.00 respectively.
10. Is the market size provided in terms of value or volume?
The market size is provided in terms of value, measured in million and volume, measured in K.
11. Are there any specific market keywords associated with the report?
Yes, the market keyword associated with the report is "Instant Iced Tea," which aids in identifying and referencing the specific market segment covered.
12. How do I determine which pricing option suits my needs best?
The pricing options vary based on user requirements and access needs. Individual users may opt for single-user licenses, while businesses requiring broader access may choose multi-user or enterprise licenses for cost-effective access to the report.
13. Are there any additional resources or data provided in the Instant Iced Tea report?
While the report offers comprehensive insights, it's advisable to review the specific contents or supplementary materials provided to ascertain if additional resources or data are available.
14. How can I stay updated on further developments or reports in the Instant Iced Tea?
To stay informed about further developments, trends, and reports in the Instant Iced Tea, consider subscribing to industry newsletters, following relevant companies and organizations, or regularly checking reputable industry news sources and publications.
Methodology
Step 1 - Identification of Relevant Samples Size from Population Database


Step 2 - Approaches for Defining Global Market Size (Value, Volume* & Price*)

Note*: In applicable scenarios
Step 3 - Data Sources
Primary Research
- Web Analytics
- Survey Reports
- Research Institute
- Latest Research Reports
- Opinion Leaders
Secondary Research
- Annual Reports
- White Paper
- Latest Press Release
- Industry Association
- Paid Database
- Investor Presentations

Step 4 - Data Triangulation
Involves using different sources of information in order to increase the validity of a study
These sources are likely to be stakeholders in a program - participants, other researchers, program staff, other community members, and so on.
Then we put all data in single framework & apply various statistical tools to find out the dynamic on the market.
During the analysis stage, feedback from the stakeholder groups would be compared to determine areas of agreement as well as areas of divergence


