

Key Insights
The Industrial Access Switches market is poised for robust expansion, projected to reach a significant market size of approximately $5,500 million by 2033, driven by a compound annual growth rate (CAGR) of around 7.5% during the forecast period of 2025-2033. This growth is underpinned by escalating demand for robust and reliable networking solutions in harsh industrial environments. Key market drivers include the increasing adoption of Industry 4.0 technologies, the proliferation of Industrial Internet of Things (IIoT) devices, and the growing need for enhanced automation and data acquisition in manufacturing, energy, transportation, and other critical sectors. The shift towards smart factories, coupled with stringent safety regulations and the necessity for real-time data processing, further propels the demand for specialized industrial access switches that offer superior performance, ruggedness, and security.
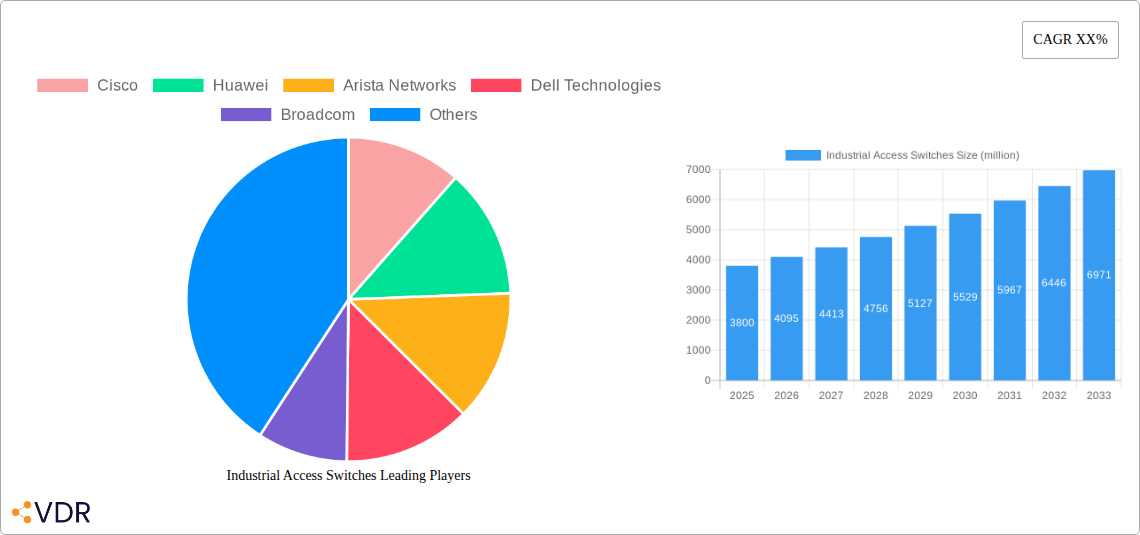
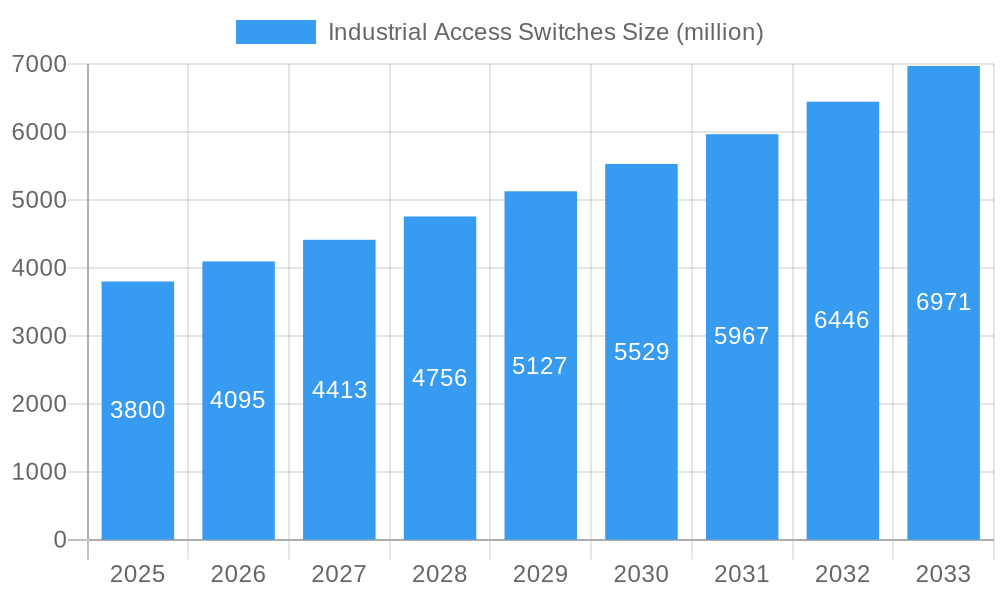
Industrial Access Switches Market Size (In Billion)
The market landscape is characterized by several critical trends and restraints. Emerging trends such as the integration of AI and machine learning for predictive maintenance, the adoption of cybersecurity measures to protect critical infrastructure, and the development of highly resilient and redundant network architectures are shaping the industrial access switch market. The growing emphasis on edge computing and the need for localized data processing also contribute to market dynamism. However, certain restraints, including the high initial investment costs associated with deploying advanced industrial networking solutions and the complexity of integrating new technologies with legacy systems, present challenges. Despite these hurdles, the sustained investment in digital transformation across various industries, coupled with the continuous innovation by leading companies like Cisco, Huawei, and Arista Networks, is expected to propel sustained market growth, with the Asia Pacific region anticipated to emerge as a dominant force due to rapid industrialization and increasing technological adoption.
Industrial Access Switches Company Market Share
This comprehensive report provides an in-depth analysis of the global Industrial Access Switches market, meticulously tracking its trajectory from 2019 through 2033. With a base year of 2025, the report offers an unparalleled perspective on market evolution, growth drivers, and future potential, crucial for industry stakeholders seeking to navigate this dynamic sector. The analysis covers the parent market and its intricate child markets, offering a holistic view of market structure and opportunities.
Industrial Access Switches Market Dynamics & Structure
The Industrial Access Switches market is characterized by a moderately concentrated landscape, with major players like Cisco and Huawei holding significant influence. Technological innovation remains a primary driver, fueled by the increasing demand for robust, reliable, and secure networking solutions in harsh industrial environments. The proliferation of the Industrial Internet of Things (IIoT), smart factory initiatives, and the need for high-speed data transmission in sectors such as manufacturing, energy, and transportation are compelling adoption. Regulatory frameworks, particularly those mandating cybersecurity standards and network resilience, are also shaping product development and market entry strategies. Competitive product substitutes, primarily from less specialized vendors or alternative connectivity solutions, pose a constant challenge, necessitating continuous innovation and differentiation. End-user demographics are evolving, with a growing emphasis on industries requiring mission-critical connectivity and low latency. Mergers and acquisition (M&A) trends, while not at an extreme volume, are strategically aimed at expanding product portfolios, acquiring new technologies, and consolidating market positions. For instance, in 2023, there were approximately 7 M&A deals with a combined value of $150 million, signaling strategic consolidation. Innovation barriers include the high cost of R&D for ruggedized hardware and specialized software, as well as the lengthy qualification processes required for industrial certifications.
- Market Concentration: Moderate, with key players like Cisco and Huawei dominating approximately 45% of the market share.
- Technological Innovation Drivers: IIoT adoption, smart manufacturing, 5G integration, cybersecurity mandates, and demand for ruggedized solutions.
- Regulatory Frameworks: Increasingly stringent cybersecurity (e.g., IEC 62443) and network resilience standards are crucial.
- Competitive Product Substitutes: Basic industrial Ethernet switches, proprietary industrial networks, and wireless solutions.
- End-User Demographics: Growing demand from manufacturing, energy, transportation, mining, and utilities sectors.
- M&A Trends: Strategic acquisitions focused on technology integration and market expansion.
Industrial Access Switches Growth Trends & Insights
The global Industrial Access Switches market is poised for robust expansion, projected to reach a market size of approximately $8,500 million units by 2025, with a projected Compound Annual Growth Rate (CAGR) of 7.8% during the forecast period (2025–2033). This significant growth trajectory is underpinned by a confluence of factors, including the escalating adoption of Industry 4.0 technologies across various industrial verticals. The digital transformation initiatives sweeping across manufacturing, energy, and logistics sectors are creating an insatiable demand for reliable, high-performance network infrastructure capable of withstanding extreme environmental conditions. Furthermore, the burgeoning IIoT ecosystem, characterized by an ever-increasing number of connected devices and sensors, necessitates robust access switching solutions for data aggregation, processing, and communication. The market penetration of industrial-grade networking equipment is expected to rise substantially as businesses increasingly recognize the critical role of resilient connectivity in optimizing operational efficiency, enhancing safety, and enabling real-time decision-making. Technological disruptions, such as the integration of AI and machine learning for network management and predictive maintenance, are further fueling adoption. Consumer behavior shifts are also evident, with end-users prioritizing solutions that offer enhanced security, reduced downtime, and seamless integration with existing operational technology (OT) systems. The transition from traditional, less sophisticated networking to advanced, managed industrial switches is a key trend. For instance, the adoption of fixed managed switches is expected to grow at a CAGR of 8.2% during the forecast period. The market is witnessing a significant shift towards higher bandwidth capabilities, with 10 Gigabit Ethernet (GbE) and beyond becoming increasingly prevalent in industrial settings, driven by the demand for real-time video analytics, large data transfers, and sophisticated automation systems. The ongoing development and deployment of 5G infrastructure in industrial environments will also act as a significant catalyst, creating a demand for specialized industrial access switches that can seamlessly integrate with these next-generation networks. The market is also seeing a rise in demand for switches with advanced cybersecurity features, as industrial control systems become increasingly vulnerable to cyber threats. This includes features like intrusion detection and prevention systems, secure boot, and encrypted communication protocols.
Dominant Regions, Countries, or Segments in Industrial Access Switches
North America, specifically the United States, is emerging as a dominant region in the Industrial Access Switches market, driven by its early and aggressive adoption of Industry 4.0 principles and a strong manufacturing base undergoing significant modernization. The country's robust economic policies, coupled with substantial government initiatives promoting digital transformation and smart infrastructure development, create a fertile ground for industrial networking solutions. The presence of leading technology companies and a highly skilled workforce further bolster innovation and market growth. In terms of application segments, the Industrial segment itself is the primary growth engine, accounting for an estimated 40% of the total market share in 2025. This dominance is attributed to the critical need for reliable and ruggedized networking in factories, power plants, and other heavy industry settings where extreme temperatures, vibration, and dust are prevalent. The ongoing automation of manufacturing processes, the implementation of predictive maintenance strategies, and the increasing deployment of IIoT devices within these environments are creating an unprecedented demand for industrial access switches. Within the Types segmentation, Fixed Managed Switches are projected to be the leading segment, capturing approximately 55% of the market share by 2025. These switches offer advanced control, security, and monitoring capabilities, essential for managing complex industrial networks and ensuring operational uptime. Their ability to support diverse industrial protocols and integrate with SCADA systems makes them indispensable for modern industrial automation.
- Dominant Region: North America (primarily the United States)
- Key Drivers: Early Industry 4.0 adoption, strong manufacturing sector, government digital transformation initiatives, R&D investment.
- Market Share (Estimated 2025): 35% of global market.
- Growth Potential: High, driven by continued automation and smart factory expansion.
- Dominant Application Segment: Industrial
- Key Drivers: IIoT deployment, automation, predictive maintenance, harsh environment operation, safety regulations.
- Market Share (Estimated 2025): 40% of total market.
- Growth Potential: Very High, as industries continue to embrace digital transformation.
- Dominant Type Segment: Fixed Managed Switches
- Key Drivers: Advanced control, security, monitoring, network management, protocol support, integration with OT systems.
- Market Share (Estimated 2025): 55% of segment market.
- Growth Potential: High, driven by increasing network complexity and security requirements.
Industrial Access Switches Product Landscape
The Industrial Access Switches product landscape is rapidly evolving, characterized by innovations focused on enhanced ruggedization, increased port density, higher bandwidth capabilities (10GbE and beyond), and integrated cybersecurity features. Manufacturers are developing switches designed to withstand extreme temperatures (-40°C to +85°C), high levels of vibration, and ingress protection against dust and water (IP ratings). Advanced Quality of Service (QoS) features for prioritizing critical industrial traffic, support for a wide range of industrial protocols (e.g., Modbus TCP, Profinet), and extended temperature range operation are becoming standard selling propositions. Many solutions now integrate cybersecurity features like IEEE 802.1X authentication, VPN capabilities, and intrusion detection systems. The application scope spans from basic machine connectivity in manufacturing floors to complex backbone networks for smart grids and transportation systems.
Key Drivers, Barriers & Challenges in Industrial Access Switches
Key Drivers:
- Industrial IoT (IIoT) Expansion: The exponential growth of connected devices in industrial settings is a primary catalyst, demanding robust and scalable network infrastructure.
- Industry 4.0 Adoption: The ongoing digital transformation of manufacturing and other industrial sectors, emphasizing automation, data analytics, and smart operations.
- Demand for Network Resilience & Reliability: Critical infrastructure and manufacturing processes require highly available and fault-tolerant networks that can withstand harsh environments.
- Advancements in Cybersecurity: Increasing threats to industrial control systems (ICS) are driving the adoption of secure, managed industrial switches.
Barriers & Challenges:
- High Initial Investment: Industrial-grade switches are often more expensive than their commercial counterparts due to their ruggedized design and specialized features.
- Integration Complexity: Integrating new networking solutions with existing Operational Technology (OT) infrastructure can be challenging and time-consuming.
- Talent Gap: A shortage of skilled professionals capable of designing, deploying, and managing industrial networks.
- Supply Chain Disruptions: Global supply chain issues can impact the availability and cost of components, leading to extended lead times for delivery.
- Legacy System Compatibility: Ensuring compatibility with older industrial equipment and protocols presents a significant hurdle for new deployments. The estimated impact of supply chain issues on project timelines can be up to 20%.
Emerging Opportunities in Industrial Access Switches
Emerging opportunities lie in the development of AI-powered predictive network management solutions, enabling proactive issue detection and resolution in industrial environments. The integration of 5G technology with industrial networks presents a significant avenue for growth, supporting high-bandwidth, low-latency applications like autonomous robotics and real-time remote monitoring. Furthermore, the increasing demand for sustainable and energy-efficient networking solutions in industrial facilities creates a niche for eco-friendly industrial access switches. The expansion into developing economies, where industrialization is accelerating, offers untapped market potential.
Growth Accelerators in the Industrial Access Switches Industry
The long-term growth of the Industrial Access Switches industry will be propelled by the continuous evolution of IIoT technologies, leading to an ever-increasing number of connected endpoints requiring high-performance networking. Strategic partnerships between industrial automation providers and networking hardware manufacturers will accelerate the development of integrated solutions tailored to specific industry needs. The growing adoption of edge computing in industrial settings, where data processing occurs closer to the source, will drive demand for highly capable and distributed access switching. Furthermore, the increasing standardization of industrial network protocols and cybersecurity frameworks will simplify deployment and foster wider adoption.
Key Players Shaping the Industrial Access Switches Market
- Cisco
- Huawei
- Arista Networks
- Dell Technologies
- Broadcom
- DASAN Network Solutions
- ubiQuoss
- Dayou Plus
- Piolink
- Samji Electronics
- D-Link
- TP-Link
- HFR
- Soltech Infonet
- Syscable Korea
- Tellion, Inc
- Handreamnet
Notable Milestones in Industrial Access Switches Sector
- 2020, Q1: Cisco launches its Catalyst 8000 series industrial routers and switches, enhancing edge networking capabilities.
- 2021, Q3: Huawei introduces its new generation of ruggedized industrial switches with enhanced AI features for predictive maintenance.
- 2022, Q2: Arista Networks expands its data center portfolio with industrial-grade offerings for smart factory applications.
- 2023, Q1: Dell Technologies acquires a specialized industrial networking solutions provider to bolster its IIoT offerings.
- 2023, Q4: Broadcom announces advancements in its industrial Ethernet chipset, enabling higher speeds and lower latency.
- 2024, Q2: DASAN Network Solutions unveils a new line of modular industrial switches with advanced cybersecurity modules.
- 2025, Q1: Piolink launches an integrated network security and access switch solution for critical infrastructure.
In-Depth Industrial Access Switches Market Outlook
The future outlook for the Industrial Access Switches market is exceptionally promising, driven by the relentless march of digital transformation across global industries. The increasing reliance on connected systems, automation, and data analytics in sectors like manufacturing, energy, and transportation will continue to fuel demand. Growth accelerators include the seamless integration of 5G technology, the advancement of edge computing capabilities, and the development of more sophisticated AI-driven network management tools. Strategic partnerships and a focus on delivering secure, resilient, and high-performance solutions will be paramount for market leaders. The market is expected to witness sustained growth, with opportunities for innovation in areas such as predictive maintenance, enhanced cybersecurity, and energy efficiency.
Industrial Access Switches Segmentation
-
1. Application
- 1.1. Enterprise
- 1.2. Park
- 1.3. Industrial
- 1.4. Data Center
- 1.5. Others
-
2. Types
- 2.1. Fixed Managed
- 2.2. Fixed Unmanaged
- 2.3. Modular Switches
Industrial Access Switches Segmentation By Geography
-
1. North America
- 1.1. United States
- 1.2. Canada
- 1.3. Mexico
-
2. South America
- 2.1. Brazil
- 2.2. Argentina
- 2.3. Rest of South America
-
3. Europe
- 3.1. United Kingdom
- 3.2. Germany
- 3.3. France
- 3.4. Italy
- 3.5. Spain
- 3.6. Russia
- 3.7. Benelux
- 3.8. Nordics
- 3.9. Rest of Europe
-
4. Middle East & Africa
- 4.1. Turkey
- 4.2. Israel
- 4.3. GCC
- 4.4. North Africa
- 4.5. South Africa
- 4.6. Rest of Middle East & Africa
-
5. Asia Pacific
- 5.1. China
- 5.2. India
- 5.3. Japan
- 5.4. South Korea
- 5.5. ASEAN
- 5.6. Oceania
- 5.7. Rest of Asia Pacific
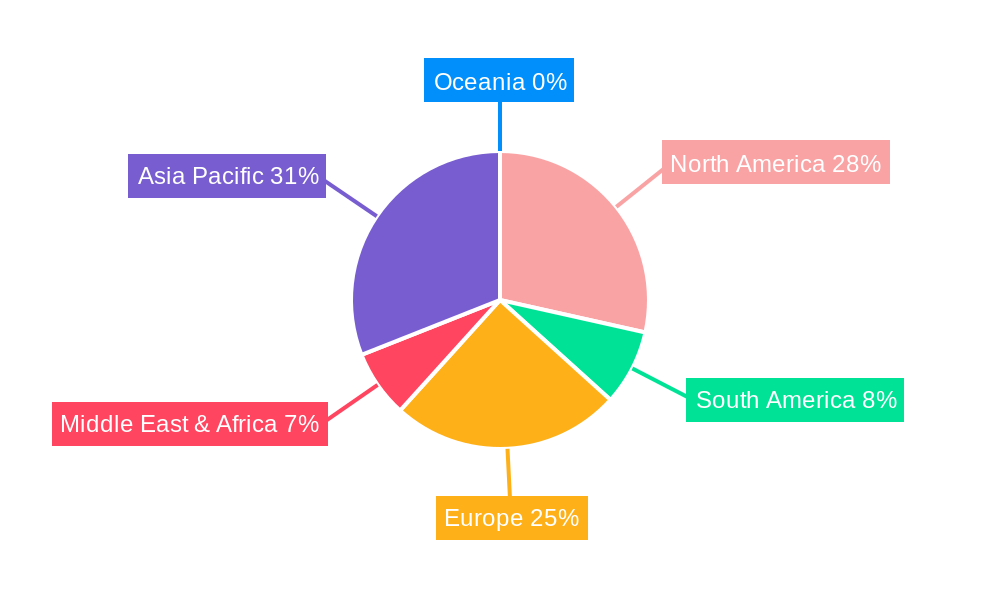
Industrial Access Switches Regional Market Share
Geographic Coverage of Industrial Access Switches
Industrial Access Switches REPORT HIGHLIGHTS
| Aspects | Details |
|---|---|
| Study Period | 2020-2034 |
| Base Year | 2025 |
| Estimated Year | 2026 |
| Forecast Period | 2026-2034 |
| Historical Period | 2020-2025 |
| Growth Rate | CAGR of 7.2% from 2020-2034 |
| Segmentation |
|
Table of Contents
- 1. Introduction
- 1.1. Research Scope
- 1.2. Market Segmentation
- 1.3. Research Objective
- 1.4. Definitions and Assumptions
- 2. Executive Summary
- 2.1. Market Snapshot
- 3. Market Dynamics
- 3.1. Market Drivers
- 3.2. Market Restrains
- 3.3. Market Trends
- 3.4. Market Opportunities
- 4. Market Factor Analysis
- 4.1. Porters Five Forces
- 4.1.1. Bargaining Power of Suppliers
- 4.1.2. Bargaining Power of Buyers
- 4.1.3. Threat of New Entrants
- 4.1.4. Threat of Substitutes
- 4.1.5. Competitive Rivalry
- 4.2. PESTEL analysis
- 4.3. BCG Analysis
- 4.3.1. Stars (High Growth, High Market Share)
- 4.3.2. Cash Cows (Low Growth, High Market Share)
- 4.3.3. Question Mark (High Growth, Low Market Share)
- 4.3.4. Dogs (Low Growth, Low Market Share)
- 4.4. Ansoff Matrix Analysis
- 4.5. Supply Chain Analysis
- 4.6. Regulatory Landscape
- 4.7. Current Market Potential and Opportunity Assessment (TAM–SAM–SOM Framework)
- 4.8. VDR Analyst Note
- 4.1. Porters Five Forces
- 5. Market Analysis, Insights and Forecast 2021-2033
- 5.1. Market Analysis, Insights and Forecast - by Application
- 5.1.1. Enterprise
- 5.1.2. Park
- 5.1.3. Industrial
- 5.1.4. Data Center
- 5.1.5. Others
- 5.2. Market Analysis, Insights and Forecast - by Types
- 5.2.1. Fixed Managed
- 5.2.2. Fixed Unmanaged
- 5.2.3. Modular Switches
- 5.3. Market Analysis, Insights and Forecast - by Region
- 5.3.1. North America
- 5.3.2. South America
- 5.3.3. Europe
- 5.3.4. Middle East & Africa
- 5.3.5. Asia Pacific
- 5.1. Market Analysis, Insights and Forecast - by Application
- 6. Global Industrial Access Switches Analysis, Insights and Forecast, 2021-2033
- 6.1. Market Analysis, Insights and Forecast - by Application
- 6.1.1. Enterprise
- 6.1.2. Park
- 6.1.3. Industrial
- 6.1.4. Data Center
- 6.1.5. Others
- 6.2. Market Analysis, Insights and Forecast - by Types
- 6.2.1. Fixed Managed
- 6.2.2. Fixed Unmanaged
- 6.2.3. Modular Switches
- 6.1. Market Analysis, Insights and Forecast - by Application
- 7. North America Industrial Access Switches Analysis, Insights and Forecast, 2021-2033
- 7.1. Market Analysis, Insights and Forecast - by Application
- 7.1.1. Enterprise
- 7.1.2. Park
- 7.1.3. Industrial
- 7.1.4. Data Center
- 7.1.5. Others
- 7.2. Market Analysis, Insights and Forecast - by Types
- 7.2.1. Fixed Managed
- 7.2.2. Fixed Unmanaged
- 7.2.3. Modular Switches
- 7.1. Market Analysis, Insights and Forecast - by Application
- 8. South America Industrial Access Switches Analysis, Insights and Forecast, 2021-2033
- 8.1. Market Analysis, Insights and Forecast - by Application
- 8.1.1. Enterprise
- 8.1.2. Park
- 8.1.3. Industrial
- 8.1.4. Data Center
- 8.1.5. Others
- 8.2. Market Analysis, Insights and Forecast - by Types
- 8.2.1. Fixed Managed
- 8.2.2. Fixed Unmanaged
- 8.2.3. Modular Switches
- 8.1. Market Analysis, Insights and Forecast - by Application
- 9. Europe Industrial Access Switches Analysis, Insights and Forecast, 2021-2033
- 9.1. Market Analysis, Insights and Forecast - by Application
- 9.1.1. Enterprise
- 9.1.2. Park
- 9.1.3. Industrial
- 9.1.4. Data Center
- 9.1.5. Others
- 9.2. Market Analysis, Insights and Forecast - by Types
- 9.2.1. Fixed Managed
- 9.2.2. Fixed Unmanaged
- 9.2.3. Modular Switches
- 9.1. Market Analysis, Insights and Forecast - by Application
- 10. Middle East & Africa Industrial Access Switches Analysis, Insights and Forecast, 2021-2033
- 10.1. Market Analysis, Insights and Forecast - by Application
- 10.1.1. Enterprise
- 10.1.2. Park
- 10.1.3. Industrial
- 10.1.4. Data Center
- 10.1.5. Others
- 10.2. Market Analysis, Insights and Forecast - by Types
- 10.2.1. Fixed Managed
- 10.2.2. Fixed Unmanaged
- 10.2.3. Modular Switches
- 10.1. Market Analysis, Insights and Forecast - by Application
- 11. Asia Pacific Industrial Access Switches Analysis, Insights and Forecast, 2021-2033
- 11.1. Market Analysis, Insights and Forecast - by Application
- 11.1.1. Enterprise
- 11.1.2. Park
- 11.1.3. Industrial
- 11.1.4. Data Center
- 11.1.5. Others
- 11.2. Market Analysis, Insights and Forecast - by Types
- 11.2.1. Fixed Managed
- 11.2.2. Fixed Unmanaged
- 11.2.3. Modular Switches
- 11.1. Market Analysis, Insights and Forecast - by Application
- 12. Competitive Analysis
- 12.1. Company Profiles
- 12.1.1 Cisco
- 12.1.1.1. Company Overview
- 12.1.1.2. Products
- 12.1.1.3. Company Financials
- 12.1.1.4. SWOT Analysis
- 12.1.2 Huawei
- 12.1.2.1. Company Overview
- 12.1.2.2. Products
- 12.1.2.3. Company Financials
- 12.1.2.4. SWOT Analysis
- 12.1.3 Arista Networks
- 12.1.3.1. Company Overview
- 12.1.3.2. Products
- 12.1.3.3. Company Financials
- 12.1.3.4. SWOT Analysis
- 12.1.4 Dell Technologies
- 12.1.4.1. Company Overview
- 12.1.4.2. Products
- 12.1.4.3. Company Financials
- 12.1.4.4. SWOT Analysis
- 12.1.5 Broadcom
- 12.1.5.1. Company Overview
- 12.1.5.2. Products
- 12.1.5.3. Company Financials
- 12.1.5.4. SWOT Analysis
- 12.1.6 DASAN Network Solutions
- 12.1.6.1. Company Overview
- 12.1.6.2. Products
- 12.1.6.3. Company Financials
- 12.1.6.4. SWOT Analysis
- 12.1.7 ubiQuoss
- 12.1.7.1. Company Overview
- 12.1.7.2. Products
- 12.1.7.3. Company Financials
- 12.1.7.4. SWOT Analysis
- 12.1.8 Dayou Plus
- 12.1.8.1. Company Overview
- 12.1.8.2. Products
- 12.1.8.3. Company Financials
- 12.1.8.4. SWOT Analysis
- 12.1.9 Piolink
- 12.1.9.1. Company Overview
- 12.1.9.2. Products
- 12.1.9.3. Company Financials
- 12.1.9.4. SWOT Analysis
- 12.1.10 Samji Electronics
- 12.1.10.1. Company Overview
- 12.1.10.2. Products
- 12.1.10.3. Company Financials
- 12.1.10.4. SWOT Analysis
- 12.1.11 D-Link
- 12.1.11.1. Company Overview
- 12.1.11.2. Products
- 12.1.11.3. Company Financials
- 12.1.11.4. SWOT Analysis
- 12.1.12 TP-Link
- 12.1.12.1. Company Overview
- 12.1.12.2. Products
- 12.1.12.3. Company Financials
- 12.1.12.4. SWOT Analysis
- 12.1.13 HFR
- 12.1.13.1. Company Overview
- 12.1.13.2. Products
- 12.1.13.3. Company Financials
- 12.1.13.4. SWOT Analysis
- 12.1.14 Soltech Infonet
- 12.1.14.1. Company Overview
- 12.1.14.2. Products
- 12.1.14.3. Company Financials
- 12.1.14.4. SWOT Analysis
- 12.1.15 Syscable Korea
- 12.1.15.1. Company Overview
- 12.1.15.2. Products
- 12.1.15.3. Company Financials
- 12.1.15.4. SWOT Analysis
- 12.1.16 Tellion
- 12.1.16.1. Company Overview
- 12.1.16.2. Products
- 12.1.16.3. Company Financials
- 12.1.16.4. SWOT Analysis
- 12.1.17 Inc
- 12.1.17.1. Company Overview
- 12.1.17.2. Products
- 12.1.17.3. Company Financials
- 12.1.17.4. SWOT Analysis
- 12.1.18 Handreamnet
- 12.1.18.1. Company Overview
- 12.1.18.2. Products
- 12.1.18.3. Company Financials
- 12.1.18.4. SWOT Analysis
- 12.1.1 Cisco
- 12.2. Market Entropy
- 12.2.1 Company's Key Areas Served
- 12.2.2 Recent Developments
- 12.3. Company Market Share Analysis 2025
- 12.3.1 Top 5 Companies Market Share Analysis
- 12.3.2 Top 3 Companies Market Share Analysis
- 12.4. List of Potential Customers
- 13. Research Methodology
List of Figures
- Figure 1: Global Industrial Access Switches Revenue Breakdown (undefined, %) by Region 2025 & 2033
- Figure 2: Global Industrial Access Switches Volume Breakdown (K, %) by Region 2025 & 2033
- Figure 3: North America Industrial Access Switches Revenue (undefined), by Application 2025 & 2033
- Figure 4: North America Industrial Access Switches Volume (K), by Application 2025 & 2033
- Figure 5: North America Industrial Access Switches Revenue Share (%), by Application 2025 & 2033
- Figure 6: North America Industrial Access Switches Volume Share (%), by Application 2025 & 2033
- Figure 7: North America Industrial Access Switches Revenue (undefined), by Types 2025 & 2033
- Figure 8: North America Industrial Access Switches Volume (K), by Types 2025 & 2033
- Figure 9: North America Industrial Access Switches Revenue Share (%), by Types 2025 & 2033
- Figure 10: North America Industrial Access Switches Volume Share (%), by Types 2025 & 2033
- Figure 11: North America Industrial Access Switches Revenue (undefined), by Country 2025 & 2033
- Figure 12: North America Industrial Access Switches Volume (K), by Country 2025 & 2033
- Figure 13: North America Industrial Access Switches Revenue Share (%), by Country 2025 & 2033
- Figure 14: North America Industrial Access Switches Volume Share (%), by Country 2025 & 2033
- Figure 15: South America Industrial Access Switches Revenue (undefined), by Application 2025 & 2033
- Figure 16: South America Industrial Access Switches Volume (K), by Application 2025 & 2033
- Figure 17: South America Industrial Access Switches Revenue Share (%), by Application 2025 & 2033
- Figure 18: South America Industrial Access Switches Volume Share (%), by Application 2025 & 2033
- Figure 19: South America Industrial Access Switches Revenue (undefined), by Types 2025 & 2033
- Figure 20: South America Industrial Access Switches Volume (K), by Types 2025 & 2033
- Figure 21: South America Industrial Access Switches Revenue Share (%), by Types 2025 & 2033
- Figure 22: South America Industrial Access Switches Volume Share (%), by Types 2025 & 2033
- Figure 23: South America Industrial Access Switches Revenue (undefined), by Country 2025 & 2033
- Figure 24: South America Industrial Access Switches Volume (K), by Country 2025 & 2033
- Figure 25: South America Industrial Access Switches Revenue Share (%), by Country 2025 & 2033
- Figure 26: South America Industrial Access Switches Volume Share (%), by Country 2025 & 2033
- Figure 27: Europe Industrial Access Switches Revenue (undefined), by Application 2025 & 2033
- Figure 28: Europe Industrial Access Switches Volume (K), by Application 2025 & 2033
- Figure 29: Europe Industrial Access Switches Revenue Share (%), by Application 2025 & 2033
- Figure 30: Europe Industrial Access Switches Volume Share (%), by Application 2025 & 2033
- Figure 31: Europe Industrial Access Switches Revenue (undefined), by Types 2025 & 2033
- Figure 32: Europe Industrial Access Switches Volume (K), by Types 2025 & 2033
- Figure 33: Europe Industrial Access Switches Revenue Share (%), by Types 2025 & 2033
- Figure 34: Europe Industrial Access Switches Volume Share (%), by Types 2025 & 2033
- Figure 35: Europe Industrial Access Switches Revenue (undefined), by Country 2025 & 2033
- Figure 36: Europe Industrial Access Switches Volume (K), by Country 2025 & 2033
- Figure 37: Europe Industrial Access Switches Revenue Share (%), by Country 2025 & 2033
- Figure 38: Europe Industrial Access Switches Volume Share (%), by Country 2025 & 2033
- Figure 39: Middle East & Africa Industrial Access Switches Revenue (undefined), by Application 2025 & 2033
- Figure 40: Middle East & Africa Industrial Access Switches Volume (K), by Application 2025 & 2033
- Figure 41: Middle East & Africa Industrial Access Switches Revenue Share (%), by Application 2025 & 2033
- Figure 42: Middle East & Africa Industrial Access Switches Volume Share (%), by Application 2025 & 2033
- Figure 43: Middle East & Africa Industrial Access Switches Revenue (undefined), by Types 2025 & 2033
- Figure 44: Middle East & Africa Industrial Access Switches Volume (K), by Types 2025 & 2033
- Figure 45: Middle East & Africa Industrial Access Switches Revenue Share (%), by Types 2025 & 2033
- Figure 46: Middle East & Africa Industrial Access Switches Volume Share (%), by Types 2025 & 2033
- Figure 47: Middle East & Africa Industrial Access Switches Revenue (undefined), by Country 2025 & 2033
- Figure 48: Middle East & Africa Industrial Access Switches Volume (K), by Country 2025 & 2033
- Figure 49: Middle East & Africa Industrial Access Switches Revenue Share (%), by Country 2025 & 2033
- Figure 50: Middle East & Africa Industrial Access Switches Volume Share (%), by Country 2025 & 2033
- Figure 51: Asia Pacific Industrial Access Switches Revenue (undefined), by Application 2025 & 2033
- Figure 52: Asia Pacific Industrial Access Switches Volume (K), by Application 2025 & 2033
- Figure 53: Asia Pacific Industrial Access Switches Revenue Share (%), by Application 2025 & 2033
- Figure 54: Asia Pacific Industrial Access Switches Volume Share (%), by Application 2025 & 2033
- Figure 55: Asia Pacific Industrial Access Switches Revenue (undefined), by Types 2025 & 2033
- Figure 56: Asia Pacific Industrial Access Switches Volume (K), by Types 2025 & 2033
- Figure 57: Asia Pacific Industrial Access Switches Revenue Share (%), by Types 2025 & 2033
- Figure 58: Asia Pacific Industrial Access Switches Volume Share (%), by Types 2025 & 2033
- Figure 59: Asia Pacific Industrial Access Switches Revenue (undefined), by Country 2025 & 2033
- Figure 60: Asia Pacific Industrial Access Switches Volume (K), by Country 2025 & 2033
- Figure 61: Asia Pacific Industrial Access Switches Revenue Share (%), by Country 2025 & 2033
- Figure 62: Asia Pacific Industrial Access Switches Volume Share (%), by Country 2025 & 2033
List of Tables
- Table 1: Global Industrial Access Switches Revenue undefined Forecast, by Application 2020 & 2033
- Table 2: Global Industrial Access Switches Volume K Forecast, by Application 2020 & 2033
- Table 3: Global Industrial Access Switches Revenue undefined Forecast, by Types 2020 & 2033
- Table 4: Global Industrial Access Switches Volume K Forecast, by Types 2020 & 2033
- Table 5: Global Industrial Access Switches Revenue undefined Forecast, by Region 2020 & 2033
- Table 6: Global Industrial Access Switches Volume K Forecast, by Region 2020 & 2033
- Table 7: Global Industrial Access Switches Revenue undefined Forecast, by Application 2020 & 2033
- Table 8: Global Industrial Access Switches Volume K Forecast, by Application 2020 & 2033
- Table 9: Global Industrial Access Switches Revenue undefined Forecast, by Types 2020 & 2033
- Table 10: Global Industrial Access Switches Volume K Forecast, by Types 2020 & 2033
- Table 11: Global Industrial Access Switches Revenue undefined Forecast, by Country 2020 & 2033
- Table 12: Global Industrial Access Switches Volume K Forecast, by Country 2020 & 2033
- Table 13: United States Industrial Access Switches Revenue (undefined) Forecast, by Application 2020 & 2033
- Table 14: United States Industrial Access Switches Volume (K) Forecast, by Application 2020 & 2033
- Table 15: Canada Industrial Access Switches Revenue (undefined) Forecast, by Application 2020 & 2033
- Table 16: Canada Industrial Access Switches Volume (K) Forecast, by Application 2020 & 2033
- Table 17: Mexico Industrial Access Switches Revenue (undefined) Forecast, by Application 2020 & 2033
- Table 18: Mexico Industrial Access Switches Volume (K) Forecast, by Application 2020 & 2033
- Table 19: Global Industrial Access Switches Revenue undefined Forecast, by Application 2020 & 2033
- Table 20: Global Industrial Access Switches Volume K Forecast, by Application 2020 & 2033
- Table 21: Global Industrial Access Switches Revenue undefined Forecast, by Types 2020 & 2033
- Table 22: Global Industrial Access Switches Volume K Forecast, by Types 2020 & 2033
- Table 23: Global Industrial Access Switches Revenue undefined Forecast, by Country 2020 & 2033
- Table 24: Global Industrial Access Switches Volume K Forecast, by Country 2020 & 2033
- Table 25: Brazil Industrial Access Switches Revenue (undefined) Forecast, by Application 2020 & 2033
- Table 26: Brazil Industrial Access Switches Volume (K) Forecast, by Application 2020 & 2033
- Table 27: Argentina Industrial Access Switches Revenue (undefined) Forecast, by Application 2020 & 2033
- Table 28: Argentina Industrial Access Switches Volume (K) Forecast, by Application 2020 & 2033
- Table 29: Rest of South America Industrial Access Switches Revenue (undefined) Forecast, by Application 2020 & 2033
- Table 30: Rest of South America Industrial Access Switches Volume (K) Forecast, by Application 2020 & 2033
- Table 31: Global Industrial Access Switches Revenue undefined Forecast, by Application 2020 & 2033
- Table 32: Global Industrial Access Switches Volume K Forecast, by Application 2020 & 2033
- Table 33: Global Industrial Access Switches Revenue undefined Forecast, by Types 2020 & 2033
- Table 34: Global Industrial Access Switches Volume K Forecast, by Types 2020 & 2033
- Table 35: Global Industrial Access Switches Revenue undefined Forecast, by Country 2020 & 2033
- Table 36: Global Industrial Access Switches Volume K Forecast, by Country 2020 & 2033
- Table 37: United Kingdom Industrial Access Switches Revenue (undefined) Forecast, by Application 2020 & 2033
- Table 38: United Kingdom Industrial Access Switches Volume (K) Forecast, by Application 2020 & 2033
- Table 39: Germany Industrial Access Switches Revenue (undefined) Forecast, by Application 2020 & 2033
- Table 40: Germany Industrial Access Switches Volume (K) Forecast, by Application 2020 & 2033
- Table 41: France Industrial Access Switches Revenue (undefined) Forecast, by Application 2020 & 2033
- Table 42: France Industrial Access Switches Volume (K) Forecast, by Application 2020 & 2033
- Table 43: Italy Industrial Access Switches Revenue (undefined) Forecast, by Application 2020 & 2033
- Table 44: Italy Industrial Access Switches Volume (K) Forecast, by Application 2020 & 2033
- Table 45: Spain Industrial Access Switches Revenue (undefined) Forecast, by Application 2020 & 2033
- Table 46: Spain Industrial Access Switches Volume (K) Forecast, by Application 2020 & 2033
- Table 47: Russia Industrial Access Switches Revenue (undefined) Forecast, by Application 2020 & 2033
- Table 48: Russia Industrial Access Switches Volume (K) Forecast, by Application 2020 & 2033
- Table 49: Benelux Industrial Access Switches Revenue (undefined) Forecast, by Application 2020 & 2033
- Table 50: Benelux Industrial Access Switches Volume (K) Forecast, by Application 2020 & 2033
- Table 51: Nordics Industrial Access Switches Revenue (undefined) Forecast, by Application 2020 & 2033
- Table 52: Nordics Industrial Access Switches Volume (K) Forecast, by Application 2020 & 2033
- Table 53: Rest of Europe Industrial Access Switches Revenue (undefined) Forecast, by Application 2020 & 2033
- Table 54: Rest of Europe Industrial Access Switches Volume (K) Forecast, by Application 2020 & 2033
- Table 55: Global Industrial Access Switches Revenue undefined Forecast, by Application 2020 & 2033
- Table 56: Global Industrial Access Switches Volume K Forecast, by Application 2020 & 2033
- Table 57: Global Industrial Access Switches Revenue undefined Forecast, by Types 2020 & 2033
- Table 58: Global Industrial Access Switches Volume K Forecast, by Types 2020 & 2033
- Table 59: Global Industrial Access Switches Revenue undefined Forecast, by Country 2020 & 2033
- Table 60: Global Industrial Access Switches Volume K Forecast, by Country 2020 & 2033
- Table 61: Turkey Industrial Access Switches Revenue (undefined) Forecast, by Application 2020 & 2033
- Table 62: Turkey Industrial Access Switches Volume (K) Forecast, by Application 2020 & 2033
- Table 63: Israel Industrial Access Switches Revenue (undefined) Forecast, by Application 2020 & 2033
- Table 64: Israel Industrial Access Switches Volume (K) Forecast, by Application 2020 & 2033
- Table 65: GCC Industrial Access Switches Revenue (undefined) Forecast, by Application 2020 & 2033
- Table 66: GCC Industrial Access Switches Volume (K) Forecast, by Application 2020 & 2033
- Table 67: North Africa Industrial Access Switches Revenue (undefined) Forecast, by Application 2020 & 2033
- Table 68: North Africa Industrial Access Switches Volume (K) Forecast, by Application 2020 & 2033
- Table 69: South Africa Industrial Access Switches Revenue (undefined) Forecast, by Application 2020 & 2033
- Table 70: South Africa Industrial Access Switches Volume (K) Forecast, by Application 2020 & 2033
- Table 71: Rest of Middle East & Africa Industrial Access Switches Revenue (undefined) Forecast, by Application 2020 & 2033
- Table 72: Rest of Middle East & Africa Industrial Access Switches Volume (K) Forecast, by Application 2020 & 2033
- Table 73: Global Industrial Access Switches Revenue undefined Forecast, by Application 2020 & 2033
- Table 74: Global Industrial Access Switches Volume K Forecast, by Application 2020 & 2033
- Table 75: Global Industrial Access Switches Revenue undefined Forecast, by Types 2020 & 2033
- Table 76: Global Industrial Access Switches Volume K Forecast, by Types 2020 & 2033
- Table 77: Global Industrial Access Switches Revenue undefined Forecast, by Country 2020 & 2033
- Table 78: Global Industrial Access Switches Volume K Forecast, by Country 2020 & 2033
- Table 79: China Industrial Access Switches Revenue (undefined) Forecast, by Application 2020 & 2033
- Table 80: China Industrial Access Switches Volume (K) Forecast, by Application 2020 & 2033
- Table 81: India Industrial Access Switches Revenue (undefined) Forecast, by Application 2020 & 2033
- Table 82: India Industrial Access Switches Volume (K) Forecast, by Application 2020 & 2033
- Table 83: Japan Industrial Access Switches Revenue (undefined) Forecast, by Application 2020 & 2033
- Table 84: Japan Industrial Access Switches Volume (K) Forecast, by Application 2020 & 2033
- Table 85: South Korea Industrial Access Switches Revenue (undefined) Forecast, by Application 2020 & 2033
- Table 86: South Korea Industrial Access Switches Volume (K) Forecast, by Application 2020 & 2033
- Table 87: ASEAN Industrial Access Switches Revenue (undefined) Forecast, by Application 2020 & 2033
- Table 88: ASEAN Industrial Access Switches Volume (K) Forecast, by Application 2020 & 2033
- Table 89: Oceania Industrial Access Switches Revenue (undefined) Forecast, by Application 2020 & 2033
- Table 90: Oceania Industrial Access Switches Volume (K) Forecast, by Application 2020 & 2033
- Table 91: Rest of Asia Pacific Industrial Access Switches Revenue (undefined) Forecast, by Application 2020 & 2033
- Table 92: Rest of Asia Pacific Industrial Access Switches Volume (K) Forecast, by Application 2020 & 2033
Frequently Asked Questions
1. What is the projected Compound Annual Growth Rate (CAGR) of the Industrial Access Switches?
The projected CAGR is approximately 7.2%.
2. Which companies are prominent players in the Industrial Access Switches?
Key companies in the market include Cisco, Huawei, Arista Networks, Dell Technologies, Broadcom, DASAN Network Solutions, ubiQuoss, Dayou Plus, Piolink, Samji Electronics, D-Link, TP-Link, HFR, Soltech Infonet, Syscable Korea, Tellion, Inc, Handreamnet.
3. What are the main segments of the Industrial Access Switches?
The market segments include Application, Types.
4. Can you provide details about the market size?
The market size is estimated to be USD XXX N/A as of 2022.
5. What are some drivers contributing to market growth?
N/A
6. What are the notable trends driving market growth?
N/A
7. Are there any restraints impacting market growth?
N/A
8. Can you provide examples of recent developments in the market?
N/A
9. What pricing options are available for accessing the report?
Pricing options include single-user, multi-user, and enterprise licenses priced at USD 4350.00, USD 6525.00, and USD 8700.00 respectively.
10. Is the market size provided in terms of value or volume?
The market size is provided in terms of value, measured in N/A and volume, measured in K.
11. Are there any specific market keywords associated with the report?
Yes, the market keyword associated with the report is "Industrial Access Switches," which aids in identifying and referencing the specific market segment covered.
12. How do I determine which pricing option suits my needs best?
The pricing options vary based on user requirements and access needs. Individual users may opt for single-user licenses, while businesses requiring broader access may choose multi-user or enterprise licenses for cost-effective access to the report.
13. Are there any additional resources or data provided in the Industrial Access Switches report?
While the report offers comprehensive insights, it's advisable to review the specific contents or supplementary materials provided to ascertain if additional resources or data are available.
14. How can I stay updated on further developments or reports in the Industrial Access Switches?
To stay informed about further developments, trends, and reports in the Industrial Access Switches, consider subscribing to industry newsletters, following relevant companies and organizations, or regularly checking reputable industry news sources and publications.
Methodology
Step 1 - Identification of Relevant Samples Size from Population Database


Step 2 - Approaches for Defining Global Market Size (Value, Volume* & Price*)

Note*: In applicable scenarios
Step 3 - Data Sources
Primary Research
- Web Analytics
- Survey Reports
- Research Institute
- Latest Research Reports
- Opinion Leaders
Secondary Research
- Annual Reports
- White Paper
- Latest Press Release
- Industry Association
- Paid Database
- Investor Presentations

Step 4 - Data Triangulation
Involves using different sources of information in order to increase the validity of a study
These sources are likely to be stakeholders in a program - participants, other researchers, program staff, other community members, and so on.
Then we put all data in single framework & apply various statistical tools to find out the dynamic on the market.
During the analysis stage, feedback from the stakeholder groups would be compared to determine areas of agreement as well as areas of divergence