
Key Insights
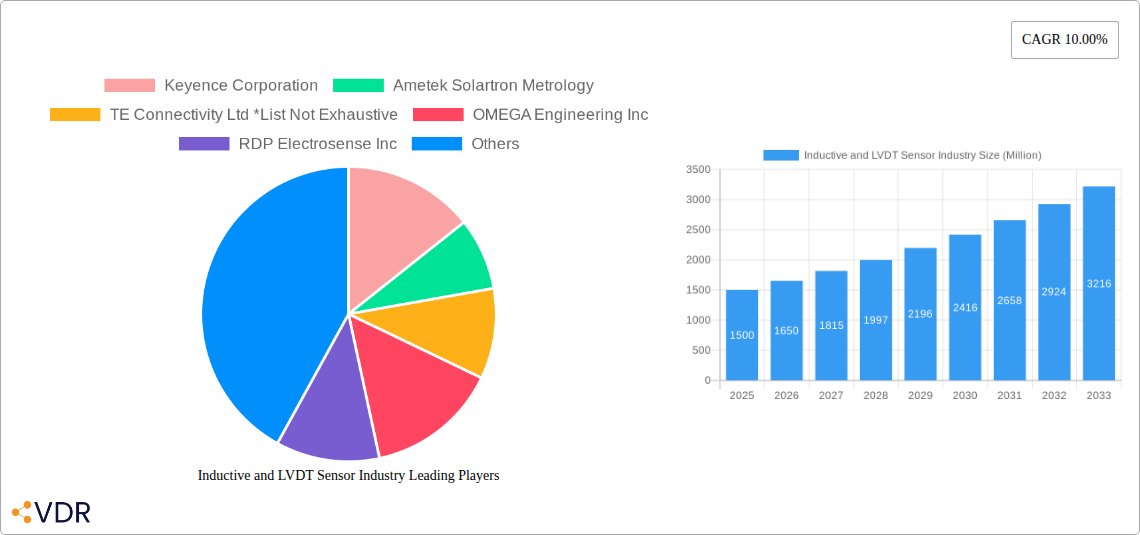
The Inductive and LVDT Sensor market is experiencing robust growth, projected to reach a substantial size within the next decade. Driven by increasing automation across diverse sectors like automotive, aerospace, and healthcare, the demand for precise and reliable displacement measurement solutions is fueling this expansion. The 10% CAGR indicates a consistent upward trajectory, with significant contributions from technological advancements leading to more compact, efficient, and cost-effective sensor designs. Growth is particularly pronounced in applications demanding high accuracy and durability, such as automotive engine management systems and aerospace navigation. The market is segmented by sensor type (DC, AC, digital I/O, and others), product (XLT, gaging sensors, displacement sensors, and others), and application (automotive, aerospace, consumer electronics, medical, energy, oil & gas, and others). Competition is fairly intense, with established players like Keyence Corporation and Ametek Solartron Metrology alongside specialized manufacturers. Future growth will be influenced by the adoption of Industry 4.0 technologies, increased focus on miniaturization and integration, and the rising demand for sensors in advanced manufacturing processes.
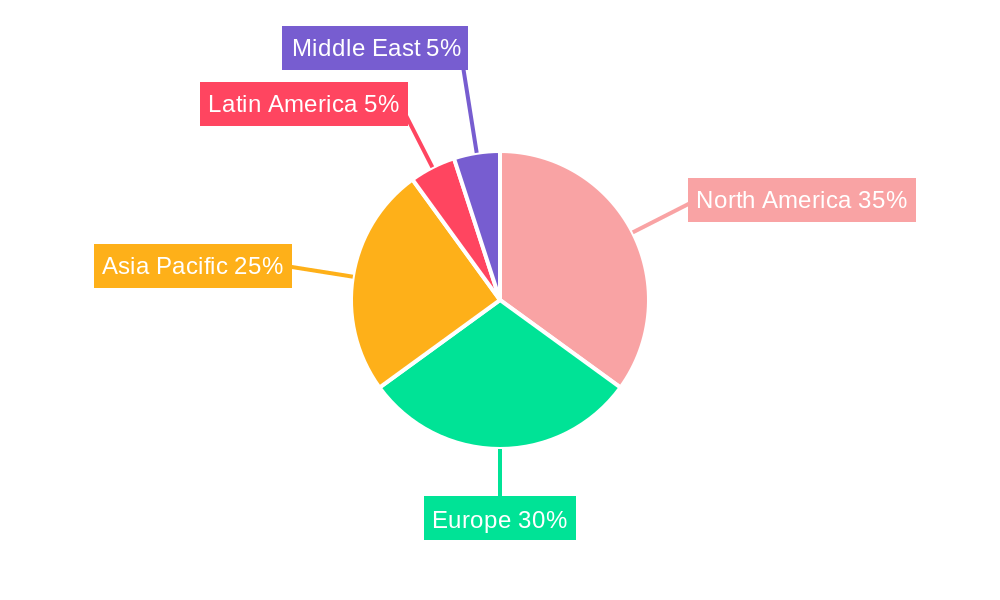
Despite the positive outlook, market growth faces certain restraints. The high initial investment cost associated with LVDT sensors and the need for specialized technical expertise in installation and calibration could hinder wider adoption in certain sectors. The market may also face competition from alternative sensor technologies, including optical and capacitive sensors, that offer unique advantages in specific applications. However, LVDT sensors continue to hold a strong position due to their robustness, reliability and excellent performance under harsh environmental conditions. The market’s geographical distribution is likely to favor developed regions initially (North America and Europe) but significant expansion is anticipated in Asia-Pacific due to increased industrialization and technological advancements.
Inductive and LVDT Sensor Industry Market Report: 2019-2033
This comprehensive report provides an in-depth analysis of the Inductive and LVDT Sensor market, encompassing market dynamics, growth trends, regional analysis, product landscape, key players, and future outlook. The report covers the period from 2019 to 2033, with a base year of 2025 and a forecast period of 2025-2033. The market is segmented by type (DC Operated LVDT Sensor, AC Operated LVDT Sensor, Digital I/O LVDT Sensor, Other Types), product (XLT, LVDT Gaging Sensor, LVDT Displacement/Position Sensor, Other Products), and application (Automotive, Aerospace and Defense, Consumer Electronics, Medical and Healthcare, Energy and Power, Oil and Gas, Other Applications). Key players analyzed include Keyence Corporation, Ametek Solartron Metrology, TE Connectivity Ltd, OMEGA Engineering Inc, RDP Electrosense Inc, Trans-Tek Inc, Micro-Epsilon Group, Comptrol Incorporated, and Brunswick Instrument LLC. This report is crucial for industry professionals, investors, and strategic decision-makers seeking a comprehensive understanding of this dynamic market.
Inductive and LVDT Sensor Industry Market Dynamics & Structure
The inductive and LVDT sensor market is characterized by a moderately concentrated structure, with a few major players holding significant market share. Technological innovation, particularly in miniaturization and enhanced precision, is a key driver. Stringent regulatory frameworks concerning safety and accuracy in specific applications (e.g., aerospace) influence market dynamics. Competitive substitutes, such as capacitive and optical sensors, exert pressure, especially in cost-sensitive applications. End-user demographics, driven by the growth of automation and precision engineering across diverse industries, shape demand. M&A activity in the sector remains moderate but strategic, aiming to consolidate market share and expand technological capabilities.
- Market Concentration: The top 5 players hold approximately xx% of the global market share in 2025 (Estimated).
- Technological Innovation: Focus on miniaturization, improved accuracy (±xx µm), and increased durability is driving market growth.
- Regulatory Frameworks: Compliance with industry-specific standards (e.g., ISO 9001, FAA regulations) influences adoption rates.
- Competitive Substitutes: Capacitive and optical sensors pose a competitive threat, particularly in applications requiring lower precision and cost.
- M&A Trends: An estimated xx M&A deals occurred within the sector between 2019 and 2024.
- Innovation Barriers: High R&D costs and the need for specialized expertise present challenges to new entrants.
Inductive and LVDT Sensor Industry Growth Trends & Insights
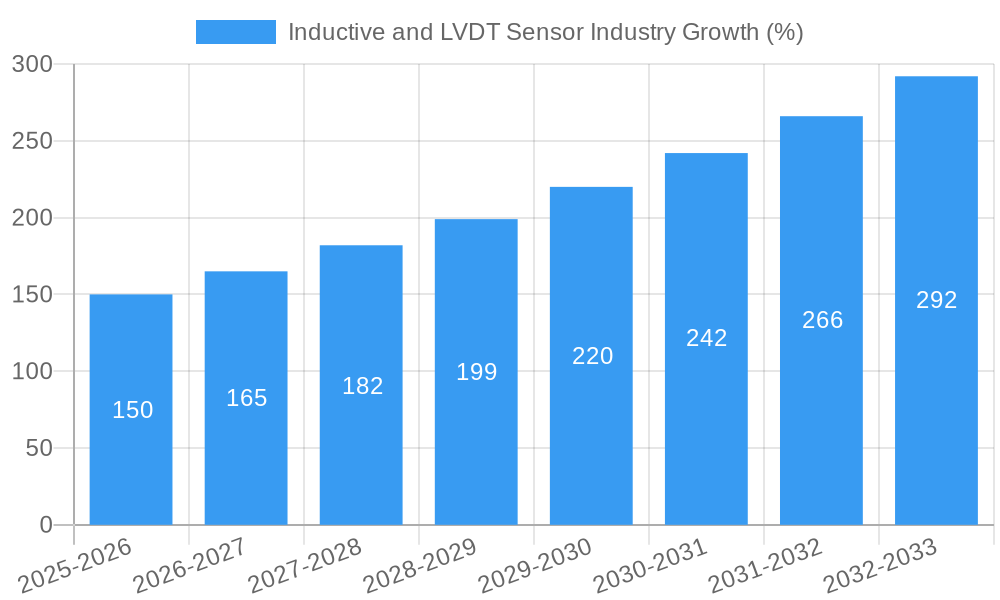
The global inductive and LVDT sensor market experienced robust growth during the historical period (2019-2024), driven by increasing automation across various industries. The market size reached xx million units in 2024 and is projected to reach xx million units by 2033, exhibiting a CAGR of xx% during the forecast period (2025-2033). Technological disruptions, such as the integration of advanced signal processing and digital interfaces, are enhancing sensor performance and adoption rates. Consumer behavior shifts toward higher precision and reliability are also fueling market growth. Market penetration in emerging economies is also a significant growth driver. Specific applications like electric vehicles and advanced manufacturing are demonstrating high growth potential, contributing to overall market expansion.
Dominant Regions, Countries, or Segments in Inductive and LVDT Sensor Industry
North America currently holds the largest market share due to significant investments in automation and advanced manufacturing. However, the Asia-Pacific region is expected to witness the fastest growth rate driven by increasing industrialization and expanding automotive and consumer electronics sectors. Within the product segments, LVDT Displacement/Position sensors lead with xx% market share in 2025 (Estimated), followed by LVDT Gaging Sensors. The automotive and aerospace & defense sectors are the largest application segments, collectively accounting for approximately xx% of the market.
- North America: Strong presence of major players and high adoption rates in automotive and aerospace drive market dominance.
- Asia-Pacific: Rapid industrialization and growth in consumer electronics fuel significant growth potential.
- Europe: Stable growth driven by automation investments in various industrial sectors.
- LVDT Displacement/Position Sensors: High demand in precision engineering and automation applications.
- Automotive Application: Growth is driven by the increasing adoption of advanced driver-assistance systems (ADAS) and electric vehicles.
- Aerospace & Defense: Stringent quality standards and high precision requirements propel market growth.
Inductive and LVDT Sensor Industry Product Landscape
The inductive and LVDT sensor market showcases continuous innovation. Recent advancements include miniaturized designs, improved signal-to-noise ratios, and the integration of advanced digital interfaces. These improvements enhance accuracy, reliability, and ease of integration into various systems. Unique selling propositions include high precision, durability, and wide operating temperature ranges, which are key factors influencing customer choice. Technological advancements focus on enhancing sensor resolution, reducing power consumption, and improving compatibility with modern industrial communication protocols.
Key Drivers, Barriers & Challenges in Inductive and LVDT Sensor Industry
Key Drivers: Increasing automation across industries, demand for high-precision measurements, growth of technologically advanced applications (e.g., robotics, IoT), and government initiatives promoting industrial automation are key drivers.
Challenges & Restraints: The high initial investment required for sensor implementation, potential supply chain disruptions, and intense competition from substitute technologies pose significant challenges. Fluctuations in raw material prices and stringent regulatory compliance also impact profitability. Estimated xx% of manufacturers face supply chain bottlenecks in 2025 (Estimated).
Emerging Opportunities in Inductive and LVDT Sensor Industry
Emerging opportunities lie in the growing demand for high-precision sensors in healthcare applications (e.g., minimally invasive surgery), the development of IoT-enabled sensors for smart factories, and the expansion into niche markets like renewable energy monitoring. Customization of sensors for specific applications and the development of robust wireless sensor networks also present significant growth opportunities.
Growth Accelerators in the Inductive and LVDT Sensor Industry Industry
Technological breakthroughs in material science and signal processing are crucial for enhancing sensor performance. Strategic partnerships between sensor manufacturers and system integrators expand market reach and foster innovation. Targeted market expansion strategies focusing on emerging economies and high-growth application segments will accelerate market growth.
Key Players Shaping the Inductive and LVDT Sensor Industry Market
- Keyence Corporation
- Ametek Solartron Metrology
- TE Connectivity Ltd
- OMEGA Engineering Inc
- RDP Electrosense Inc
- Trans-Tek Inc
- Micro-Epsilon Group
- Comptrol Incorporated
- Brunswick Instrument LLC
Notable Milestones in Inductive and LVDT Sensor Industry Sector
- 2021: Keyence Corporation launched a new line of high-precision LVDT sensors.
- 2022: Ametek Solartron Metrology acquired a smaller sensor technology company, expanding its product portfolio.
- 2023: New industry standards for LVDT sensor accuracy were introduced. (Specifics not available, placeholder for actual data)
In-Depth Inductive and LVDT Sensor Industry Market Outlook
The inductive and LVDT sensor market is poised for continued growth, driven by technological advancements and increasing demand across diverse sectors. Strategic investments in R&D, expansion into emerging markets, and strategic partnerships will be key to success in this competitive landscape. The potential for sensor integration in emerging technologies like robotics and IoT creates significant opportunities for market expansion and innovation. The market will see continued innovation in sensor materials, miniaturization, and integration with advanced communication protocols, further enhancing performance and applications.
Inductive and LVDT Sensor Industry Segmentation
-
1. Type
- 1.1. DC Operated LVDT Sensor
- 1.2. AC Operated LVDT Sensor
- 1.3. Digital I/O LVDT Sensor
- 1.4. Other Types
-
2. Product
- 2.1. XLT
- 2.2. LVDT Gaging Sensor
- 2.3. LVDT Displacement/Position Sensor
- 2.4. Other Products
-
3. Application
- 3.1. Automotive
- 3.2. Aerospace and Defense
- 3.3. Consumer Electronics
- 3.4. Medical and Healthcare
- 3.5. Energy and Power
- 3.6. Oil and Gas
- 3.7. Other Applications
Inductive and LVDT Sensor Industry Segmentation By Geography
- 1. North America
- 2. Europe
- 3. Asia Pacific
- 4. Latin America
- 5. Middle East
Inductive and LVDT Sensor Industry REPORT HIGHLIGHTS
| Aspects | Details |
|---|---|
| Study Period | 2019-2033 |
| Base Year | 2024 |
| Estimated Year | 2025 |
| Forecast Period | 2025-2033 |
| Historical Period | 2019-2024 |
| Growth Rate | CAGR of 10.00% from 2019-2033 |
| Segmentation |
|
Table of Contents
- 1. Introduction
- 1.1. Research Scope
- 1.2. Market Segmentation
- 1.3. Research Methodology
- 1.4. Definitions and Assumptions
- 2. Executive Summary
- 2.1. Introduction
- 3. Market Dynamics
- 3.1. Introduction
- 3.2. Market Drivers
- 3.2.1. ; Increase in Demand for Applications in Automobile and Transportation Industries; Rising Demand for Industrial Automation
- 3.3. Market Restrains
- 3.3.1. ; High Initial Setup Costs
- 3.4. Market Trends
- 3.4.1. Applications in Aerospace & Defence to Create a Huge Demand for Inductive and LVDT Sensors
- 4. Market Factor Analysis
- 4.1. Porters Five Forces
- 4.2. Supply/Value Chain
- 4.3. PESTEL analysis
- 4.4. Market Entropy
- 4.5. Patent/Trademark Analysis
- 5. Global Inductive and LVDT Sensor Industry Analysis, Insights and Forecast, 2019-2031
- 5.1. Market Analysis, Insights and Forecast - by Type
- 5.1.1. DC Operated LVDT Sensor
- 5.1.2. AC Operated LVDT Sensor
- 5.1.3. Digital I/O LVDT Sensor
- 5.1.4. Other Types
- 5.2. Market Analysis, Insights and Forecast - by Product
- 5.2.1. XLT
- 5.2.2. LVDT Gaging Sensor
- 5.2.3. LVDT Displacement/Position Sensor
- 5.2.4. Other Products
- 5.3. Market Analysis, Insights and Forecast - by Application
- 5.3.1. Automotive
- 5.3.2. Aerospace and Defense
- 5.3.3. Consumer Electronics
- 5.3.4. Medical and Healthcare
- 5.3.5. Energy and Power
- 5.3.6. Oil and Gas
- 5.3.7. Other Applications
- 5.4. Market Analysis, Insights and Forecast - by Region
- 5.4.1. North America
- 5.4.2. Europe
- 5.4.3. Asia Pacific
- 5.4.4. Latin America
- 5.4.5. Middle East
- 5.1. Market Analysis, Insights and Forecast - by Type
- 6. North America Inductive and LVDT Sensor Industry Analysis, Insights and Forecast, 2019-2031
- 6.1. Market Analysis, Insights and Forecast - by Type
- 6.1.1. DC Operated LVDT Sensor
- 6.1.2. AC Operated LVDT Sensor
- 6.1.3. Digital I/O LVDT Sensor
- 6.1.4. Other Types
- 6.2. Market Analysis, Insights and Forecast - by Product
- 6.2.1. XLT
- 6.2.2. LVDT Gaging Sensor
- 6.2.3. LVDT Displacement/Position Sensor
- 6.2.4. Other Products
- 6.3. Market Analysis, Insights and Forecast - by Application
- 6.3.1. Automotive
- 6.3.2. Aerospace and Defense
- 6.3.3. Consumer Electronics
- 6.3.4. Medical and Healthcare
- 6.3.5. Energy and Power
- 6.3.6. Oil and Gas
- 6.3.7. Other Applications
- 6.1. Market Analysis, Insights and Forecast - by Type
- 7. Europe Inductive and LVDT Sensor Industry Analysis, Insights and Forecast, 2019-2031
- 7.1. Market Analysis, Insights and Forecast - by Type
- 7.1.1. DC Operated LVDT Sensor
- 7.1.2. AC Operated LVDT Sensor
- 7.1.3. Digital I/O LVDT Sensor
- 7.1.4. Other Types
- 7.2. Market Analysis, Insights and Forecast - by Product
- 7.2.1. XLT
- 7.2.2. LVDT Gaging Sensor
- 7.2.3. LVDT Displacement/Position Sensor
- 7.2.4. Other Products
- 7.3. Market Analysis, Insights and Forecast - by Application
- 7.3.1. Automotive
- 7.3.2. Aerospace and Defense
- 7.3.3. Consumer Electronics
- 7.3.4. Medical and Healthcare
- 7.3.5. Energy and Power
- 7.3.6. Oil and Gas
- 7.3.7. Other Applications
- 7.1. Market Analysis, Insights and Forecast - by Type
- 8. Asia Pacific Inductive and LVDT Sensor Industry Analysis, Insights and Forecast, 2019-2031
- 8.1. Market Analysis, Insights and Forecast - by Type
- 8.1.1. DC Operated LVDT Sensor
- 8.1.2. AC Operated LVDT Sensor
- 8.1.3. Digital I/O LVDT Sensor
- 8.1.4. Other Types
- 8.2. Market Analysis, Insights and Forecast - by Product
- 8.2.1. XLT
- 8.2.2. LVDT Gaging Sensor
- 8.2.3. LVDT Displacement/Position Sensor
- 8.2.4. Other Products
- 8.3. Market Analysis, Insights and Forecast - by Application
- 8.3.1. Automotive
- 8.3.2. Aerospace and Defense
- 8.3.3. Consumer Electronics
- 8.3.4. Medical and Healthcare
- 8.3.5. Energy and Power
- 8.3.6. Oil and Gas
- 8.3.7. Other Applications
- 8.1. Market Analysis, Insights and Forecast - by Type
- 9. Latin America Inductive and LVDT Sensor Industry Analysis, Insights and Forecast, 2019-2031
- 9.1. Market Analysis, Insights and Forecast - by Type
- 9.1.1. DC Operated LVDT Sensor
- 9.1.2. AC Operated LVDT Sensor
- 9.1.3. Digital I/O LVDT Sensor
- 9.1.4. Other Types
- 9.2. Market Analysis, Insights and Forecast - by Product
- 9.2.1. XLT
- 9.2.2. LVDT Gaging Sensor
- 9.2.3. LVDT Displacement/Position Sensor
- 9.2.4. Other Products
- 9.3. Market Analysis, Insights and Forecast - by Application
- 9.3.1. Automotive
- 9.3.2. Aerospace and Defense
- 9.3.3. Consumer Electronics
- 9.3.4. Medical and Healthcare
- 9.3.5. Energy and Power
- 9.3.6. Oil and Gas
- 9.3.7. Other Applications
- 9.1. Market Analysis, Insights and Forecast - by Type
- 10. Middle East Inductive and LVDT Sensor Industry Analysis, Insights and Forecast, 2019-2031
- 10.1. Market Analysis, Insights and Forecast - by Type
- 10.1.1. DC Operated LVDT Sensor
- 10.1.2. AC Operated LVDT Sensor
- 10.1.3. Digital I/O LVDT Sensor
- 10.1.4. Other Types
- 10.2. Market Analysis, Insights and Forecast - by Product
- 10.2.1. XLT
- 10.2.2. LVDT Gaging Sensor
- 10.2.3. LVDT Displacement/Position Sensor
- 10.2.4. Other Products
- 10.3. Market Analysis, Insights and Forecast - by Application
- 10.3.1. Automotive
- 10.3.2. Aerospace and Defense
- 10.3.3. Consumer Electronics
- 10.3.4. Medical and Healthcare
- 10.3.5. Energy and Power
- 10.3.6. Oil and Gas
- 10.3.7. Other Applications
- 10.1. Market Analysis, Insights and Forecast - by Type
- 11. North America Inductive and LVDT Sensor Industry Analysis, Insights and Forecast, 2019-2031
- 11.1. Market Analysis, Insights and Forecast - By Country/Sub-region
- 11.1.1.
- 12. Europe Inductive and LVDT Sensor Industry Analysis, Insights and Forecast, 2019-2031
- 12.1. Market Analysis, Insights and Forecast - By Country/Sub-region
- 12.1.1.
- 13. Asia Pacific Inductive and LVDT Sensor Industry Analysis, Insights and Forecast, 2019-2031
- 13.1. Market Analysis, Insights and Forecast - By Country/Sub-region
- 13.1.1.
- 14. Latin America Inductive and LVDT Sensor Industry Analysis, Insights and Forecast, 2019-2031
- 14.1. Market Analysis, Insights and Forecast - By Country/Sub-region
- 14.1.1.
- 15. Middle East Inductive and LVDT Sensor Industry Analysis, Insights and Forecast, 2019-2031
- 15.1. Market Analysis, Insights and Forecast - By Country/Sub-region
- 15.1.1.
- 16. Competitive Analysis
- 16.1. Global Market Share Analysis 2024
- 16.2. Company Profiles
- 16.2.1 Keyence Corporation
- 16.2.1.1. Overview
- 16.2.1.2. Products
- 16.2.1.3. SWOT Analysis
- 16.2.1.4. Recent Developments
- 16.2.1.5. Financials (Based on Availability)
- 16.2.2 Ametek Solartron Metrology
- 16.2.2.1. Overview
- 16.2.2.2. Products
- 16.2.2.3. SWOT Analysis
- 16.2.2.4. Recent Developments
- 16.2.2.5. Financials (Based on Availability)
- 16.2.3 TE Connectivity Ltd *List Not Exhaustive
- 16.2.3.1. Overview
- 16.2.3.2. Products
- 16.2.3.3. SWOT Analysis
- 16.2.3.4. Recent Developments
- 16.2.3.5. Financials (Based on Availability)
- 16.2.4 OMEGA Engineering Inc
- 16.2.4.1. Overview
- 16.2.4.2. Products
- 16.2.4.3. SWOT Analysis
- 16.2.4.4. Recent Developments
- 16.2.4.5. Financials (Based on Availability)
- 16.2.5 RDP Electrosense Inc
- 16.2.5.1. Overview
- 16.2.5.2. Products
- 16.2.5.3. SWOT Analysis
- 16.2.5.4. Recent Developments
- 16.2.5.5. Financials (Based on Availability)
- 16.2.6 Trans-Tek Inc
- 16.2.6.1. Overview
- 16.2.6.2. Products
- 16.2.6.3. SWOT Analysis
- 16.2.6.4. Recent Developments
- 16.2.6.5. Financials (Based on Availability)
- 16.2.7 Micro-Epsilon Group
- 16.2.7.1. Overview
- 16.2.7.2. Products
- 16.2.7.3. SWOT Analysis
- 16.2.7.4. Recent Developments
- 16.2.7.5. Financials (Based on Availability)
- 16.2.8 Comptrol Incorporated
- 16.2.8.1. Overview
- 16.2.8.2. Products
- 16.2.8.3. SWOT Analysis
- 16.2.8.4. Recent Developments
- 16.2.8.5. Financials (Based on Availability)
- 16.2.9 Brunswick Instrument LLC
- 16.2.9.1. Overview
- 16.2.9.2. Products
- 16.2.9.3. SWOT Analysis
- 16.2.9.4. Recent Developments
- 16.2.9.5. Financials (Based on Availability)
- 16.2.1 Keyence Corporation
List of Figures
- Figure 1: Global Inductive and LVDT Sensor Industry Revenue Breakdown (Million, %) by Region 2024 & 2032
- Figure 2: North America Inductive and LVDT Sensor Industry Revenue (Million), by Country 2024 & 2032
- Figure 3: North America Inductive and LVDT Sensor Industry Revenue Share (%), by Country 2024 & 2032
- Figure 4: Europe Inductive and LVDT Sensor Industry Revenue (Million), by Country 2024 & 2032
- Figure 5: Europe Inductive and LVDT Sensor Industry Revenue Share (%), by Country 2024 & 2032
- Figure 6: Asia Pacific Inductive and LVDT Sensor Industry Revenue (Million), by Country 2024 & 2032
- Figure 7: Asia Pacific Inductive and LVDT Sensor Industry Revenue Share (%), by Country 2024 & 2032
- Figure 8: Latin America Inductive and LVDT Sensor Industry Revenue (Million), by Country 2024 & 2032
- Figure 9: Latin America Inductive and LVDT Sensor Industry Revenue Share (%), by Country 2024 & 2032
- Figure 10: Middle East Inductive and LVDT Sensor Industry Revenue (Million), by Country 2024 & 2032
- Figure 11: Middle East Inductive and LVDT Sensor Industry Revenue Share (%), by Country 2024 & 2032
- Figure 12: North America Inductive and LVDT Sensor Industry Revenue (Million), by Type 2024 & 2032
- Figure 13: North America Inductive and LVDT Sensor Industry Revenue Share (%), by Type 2024 & 2032
- Figure 14: North America Inductive and LVDT Sensor Industry Revenue (Million), by Product 2024 & 2032
- Figure 15: North America Inductive and LVDT Sensor Industry Revenue Share (%), by Product 2024 & 2032
- Figure 16: North America Inductive and LVDT Sensor Industry Revenue (Million), by Application 2024 & 2032
- Figure 17: North America Inductive and LVDT Sensor Industry Revenue Share (%), by Application 2024 & 2032
- Figure 18: North America Inductive and LVDT Sensor Industry Revenue (Million), by Country 2024 & 2032
- Figure 19: North America Inductive and LVDT Sensor Industry Revenue Share (%), by Country 2024 & 2032
- Figure 20: Europe Inductive and LVDT Sensor Industry Revenue (Million), by Type 2024 & 2032
- Figure 21: Europe Inductive and LVDT Sensor Industry Revenue Share (%), by Type 2024 & 2032
- Figure 22: Europe Inductive and LVDT Sensor Industry Revenue (Million), by Product 2024 & 2032
- Figure 23: Europe Inductive and LVDT Sensor Industry Revenue Share (%), by Product 2024 & 2032
- Figure 24: Europe Inductive and LVDT Sensor Industry Revenue (Million), by Application 2024 & 2032
- Figure 25: Europe Inductive and LVDT Sensor Industry Revenue Share (%), by Application 2024 & 2032
- Figure 26: Europe Inductive and LVDT Sensor Industry Revenue (Million), by Country 2024 & 2032
- Figure 27: Europe Inductive and LVDT Sensor Industry Revenue Share (%), by Country 2024 & 2032
- Figure 28: Asia Pacific Inductive and LVDT Sensor Industry Revenue (Million), by Type 2024 & 2032
- Figure 29: Asia Pacific Inductive and LVDT Sensor Industry Revenue Share (%), by Type 2024 & 2032
- Figure 30: Asia Pacific Inductive and LVDT Sensor Industry Revenue (Million), by Product 2024 & 2032
- Figure 31: Asia Pacific Inductive and LVDT Sensor Industry Revenue Share (%), by Product 2024 & 2032
- Figure 32: Asia Pacific Inductive and LVDT Sensor Industry Revenue (Million), by Application 2024 & 2032
- Figure 33: Asia Pacific Inductive and LVDT Sensor Industry Revenue Share (%), by Application 2024 & 2032
- Figure 34: Asia Pacific Inductive and LVDT Sensor Industry Revenue (Million), by Country 2024 & 2032
- Figure 35: Asia Pacific Inductive and LVDT Sensor Industry Revenue Share (%), by Country 2024 & 2032
- Figure 36: Latin America Inductive and LVDT Sensor Industry Revenue (Million), by Type 2024 & 2032
- Figure 37: Latin America Inductive and LVDT Sensor Industry Revenue Share (%), by Type 2024 & 2032
- Figure 38: Latin America Inductive and LVDT Sensor Industry Revenue (Million), by Product 2024 & 2032
- Figure 39: Latin America Inductive and LVDT Sensor Industry Revenue Share (%), by Product 2024 & 2032
- Figure 40: Latin America Inductive and LVDT Sensor Industry Revenue (Million), by Application 2024 & 2032
- Figure 41: Latin America Inductive and LVDT Sensor Industry Revenue Share (%), by Application 2024 & 2032
- Figure 42: Latin America Inductive and LVDT Sensor Industry Revenue (Million), by Country 2024 & 2032
- Figure 43: Latin America Inductive and LVDT Sensor Industry Revenue Share (%), by Country 2024 & 2032
- Figure 44: Middle East Inductive and LVDT Sensor Industry Revenue (Million), by Type 2024 & 2032
- Figure 45: Middle East Inductive and LVDT Sensor Industry Revenue Share (%), by Type 2024 & 2032
- Figure 46: Middle East Inductive and LVDT Sensor Industry Revenue (Million), by Product 2024 & 2032
- Figure 47: Middle East Inductive and LVDT Sensor Industry Revenue Share (%), by Product 2024 & 2032
- Figure 48: Middle East Inductive and LVDT Sensor Industry Revenue (Million), by Application 2024 & 2032
- Figure 49: Middle East Inductive and LVDT Sensor Industry Revenue Share (%), by Application 2024 & 2032
- Figure 50: Middle East Inductive and LVDT Sensor Industry Revenue (Million), by Country 2024 & 2032
- Figure 51: Middle East Inductive and LVDT Sensor Industry Revenue Share (%), by Country 2024 & 2032
List of Tables
- Table 1: Global Inductive and LVDT Sensor Industry Revenue Million Forecast, by Region 2019 & 2032
- Table 2: Global Inductive and LVDT Sensor Industry Revenue Million Forecast, by Type 2019 & 2032
- Table 3: Global Inductive and LVDT Sensor Industry Revenue Million Forecast, by Product 2019 & 2032
- Table 4: Global Inductive and LVDT Sensor Industry Revenue Million Forecast, by Application 2019 & 2032
- Table 5: Global Inductive and LVDT Sensor Industry Revenue Million Forecast, by Region 2019 & 2032
- Table 6: Global Inductive and LVDT Sensor Industry Revenue Million Forecast, by Country 2019 & 2032
- Table 7: Inductive and LVDT Sensor Industry Revenue (Million) Forecast, by Application 2019 & 2032
- Table 8: Global Inductive and LVDT Sensor Industry Revenue Million Forecast, by Country 2019 & 2032
- Table 9: Inductive and LVDT Sensor Industry Revenue (Million) Forecast, by Application 2019 & 2032
- Table 10: Global Inductive and LVDT Sensor Industry Revenue Million Forecast, by Country 2019 & 2032
- Table 11: Inductive and LVDT Sensor Industry Revenue (Million) Forecast, by Application 2019 & 2032
- Table 12: Global Inductive and LVDT Sensor Industry Revenue Million Forecast, by Country 2019 & 2032
- Table 13: Inductive and LVDT Sensor Industry Revenue (Million) Forecast, by Application 2019 & 2032
- Table 14: Global Inductive and LVDT Sensor Industry Revenue Million Forecast, by Country 2019 & 2032
- Table 15: Inductive and LVDT Sensor Industry Revenue (Million) Forecast, by Application 2019 & 2032
- Table 16: Global Inductive and LVDT Sensor Industry Revenue Million Forecast, by Type 2019 & 2032
- Table 17: Global Inductive and LVDT Sensor Industry Revenue Million Forecast, by Product 2019 & 2032
- Table 18: Global Inductive and LVDT Sensor Industry Revenue Million Forecast, by Application 2019 & 2032
- Table 19: Global Inductive and LVDT Sensor Industry Revenue Million Forecast, by Country 2019 & 2032
- Table 20: Global Inductive and LVDT Sensor Industry Revenue Million Forecast, by Type 2019 & 2032
- Table 21: Global Inductive and LVDT Sensor Industry Revenue Million Forecast, by Product 2019 & 2032
- Table 22: Global Inductive and LVDT Sensor Industry Revenue Million Forecast, by Application 2019 & 2032
- Table 23: Global Inductive and LVDT Sensor Industry Revenue Million Forecast, by Country 2019 & 2032
- Table 24: Global Inductive and LVDT Sensor Industry Revenue Million Forecast, by Type 2019 & 2032
- Table 25: Global Inductive and LVDT Sensor Industry Revenue Million Forecast, by Product 2019 & 2032
- Table 26: Global Inductive and LVDT Sensor Industry Revenue Million Forecast, by Application 2019 & 2032
- Table 27: Global Inductive and LVDT Sensor Industry Revenue Million Forecast, by Country 2019 & 2032
- Table 28: Global Inductive and LVDT Sensor Industry Revenue Million Forecast, by Type 2019 & 2032
- Table 29: Global Inductive and LVDT Sensor Industry Revenue Million Forecast, by Product 2019 & 2032
- Table 30: Global Inductive and LVDT Sensor Industry Revenue Million Forecast, by Application 2019 & 2032
- Table 31: Global Inductive and LVDT Sensor Industry Revenue Million Forecast, by Country 2019 & 2032
- Table 32: Global Inductive and LVDT Sensor Industry Revenue Million Forecast, by Type 2019 & 2032
- Table 33: Global Inductive and LVDT Sensor Industry Revenue Million Forecast, by Product 2019 & 2032
- Table 34: Global Inductive and LVDT Sensor Industry Revenue Million Forecast, by Application 2019 & 2032
- Table 35: Global Inductive and LVDT Sensor Industry Revenue Million Forecast, by Country 2019 & 2032
Frequently Asked Questions
1. What is the projected Compound Annual Growth Rate (CAGR) of the Inductive and LVDT Sensor Industry?
The projected CAGR is approximately 10.00%.
2. Which companies are prominent players in the Inductive and LVDT Sensor Industry?
Key companies in the market include Keyence Corporation, Ametek Solartron Metrology, TE Connectivity Ltd *List Not Exhaustive, OMEGA Engineering Inc, RDP Electrosense Inc, Trans-Tek Inc, Micro-Epsilon Group, Comptrol Incorporated, Brunswick Instrument LLC.
3. What are the main segments of the Inductive and LVDT Sensor Industry?
The market segments include Type, Product, Application.
4. Can you provide details about the market size?
The market size is estimated to be USD XX Million as of 2022.
5. What are some drivers contributing to market growth?
; Increase in Demand for Applications in Automobile and Transportation Industries; Rising Demand for Industrial Automation.
6. What are the notable trends driving market growth?
Applications in Aerospace & Defence to Create a Huge Demand for Inductive and LVDT Sensors.
7. Are there any restraints impacting market growth?
; High Initial Setup Costs.
8. Can you provide examples of recent developments in the market?
N/A
9. What pricing options are available for accessing the report?
Pricing options include single-user, multi-user, and enterprise licenses priced at USD 4750, USD 5250, and USD 8750 respectively.
10. Is the market size provided in terms of value or volume?
The market size is provided in terms of value, measured in Million.
11. Are there any specific market keywords associated with the report?
Yes, the market keyword associated with the report is "Inductive and LVDT Sensor Industry," which aids in identifying and referencing the specific market segment covered.
12. How do I determine which pricing option suits my needs best?
The pricing options vary based on user requirements and access needs. Individual users may opt for single-user licenses, while businesses requiring broader access may choose multi-user or enterprise licenses for cost-effective access to the report.
13. Are there any additional resources or data provided in the Inductive and LVDT Sensor Industry report?
While the report offers comprehensive insights, it's advisable to review the specific contents or supplementary materials provided to ascertain if additional resources or data are available.
14. How can I stay updated on further developments or reports in the Inductive and LVDT Sensor Industry?
To stay informed about further developments, trends, and reports in the Inductive and LVDT Sensor Industry, consider subscribing to industry newsletters, following relevant companies and organizations, or regularly checking reputable industry news sources and publications.
Methodology
Step 1 - Identification of Relevant Samples Size from Population Database


Step 2 - Approaches for Defining Global Market Size (Value, Volume* & Price*)

Note*: In applicable scenarios
Step 3 - Data Sources
Primary Research
- Web Analytics
- Survey Reports
- Research Institute
- Latest Research Reports
- Opinion Leaders
Secondary Research
- Annual Reports
- White Paper
- Latest Press Release
- Industry Association
- Paid Database
- Investor Presentations

Step 4 - Data Triangulation
Involves using different sources of information in order to increase the validity of a study
These sources are likely to be stakeholders in a program - participants, other researchers, program staff, other community members, and so on.
Then we put all data in single framework & apply various statistical tools to find out the dynamic on the market.
During the analysis stage, feedback from the stakeholder groups would be compared to determine areas of agreement as well as areas of divergence


