
Key Insights
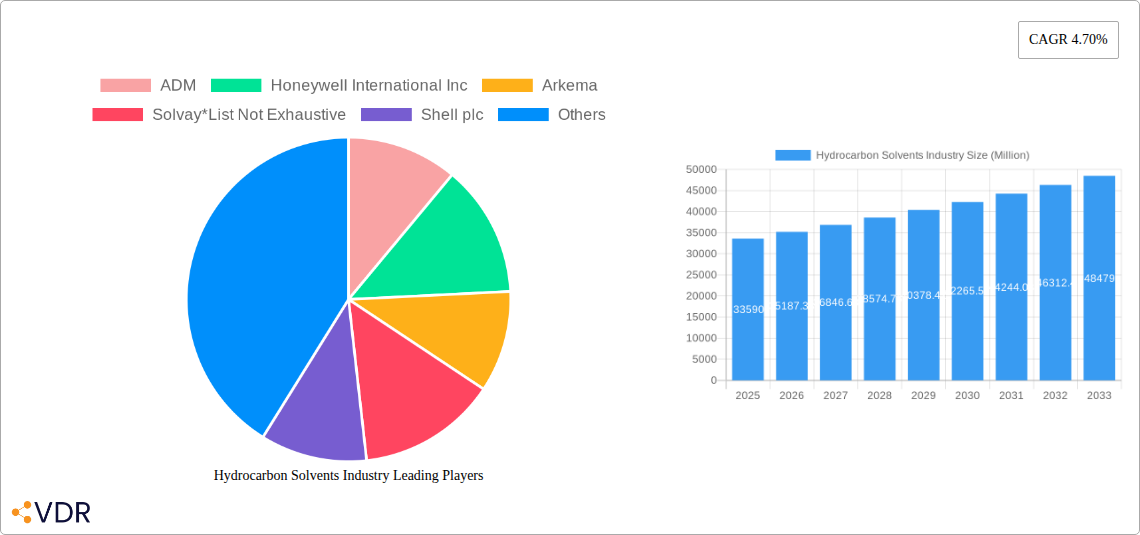
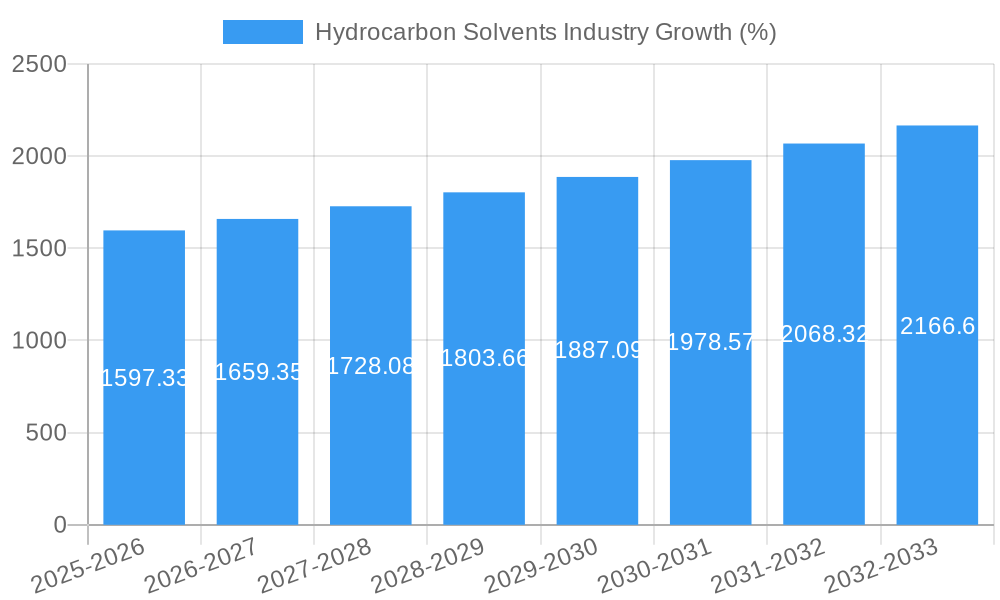
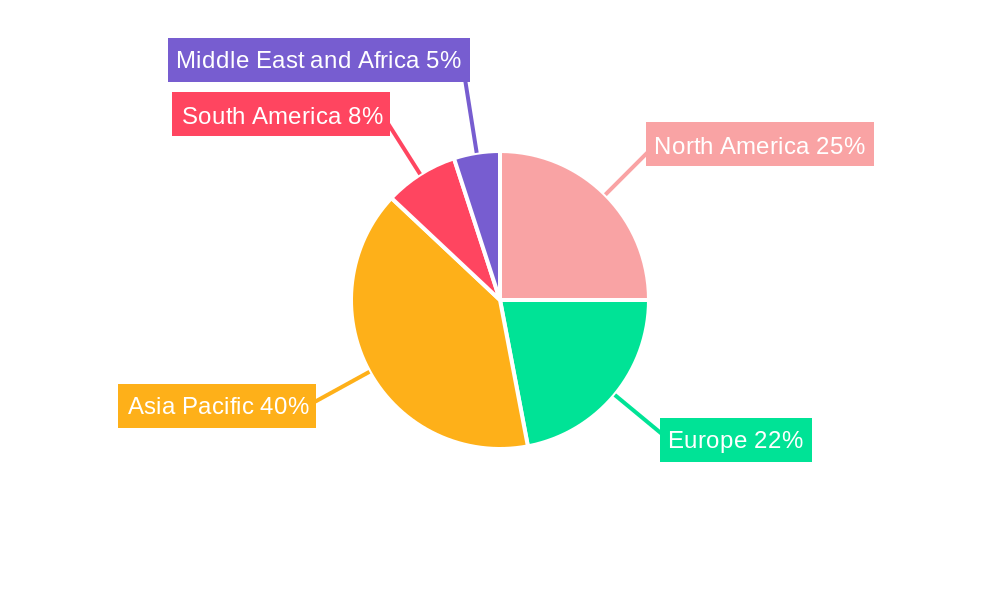
The global hydrocarbon solvents market, valued at approximately $33.59 billion in 2025, is projected to experience robust growth, driven by a compound annual growth rate (CAGR) of 4.70% from 2025 to 2033. This expansion is fueled by several key factors. The increasing demand for hydrocarbon solvents across various applications, including paints and coatings, adhesives, and personal care products, is a significant driver. The paints and coatings sector, a major consumer of hydrocarbon solvents, is benefiting from the growth in construction and infrastructure development globally. Furthermore, the automotive industry's reliance on hydrocarbon solvents in manufacturing processes contributes to market expansion. The Asia-Pacific region, particularly China and India, are expected to exhibit significant growth due to rapid industrialization and urbanization, leading to increased demand for solvents in various sectors. However, environmental concerns regarding volatile organic compounds (VOCs) emissions and stricter regulations pose a challenge to the industry. Companies are actively investing in research and development to produce more environmentally friendly alternatives, potentially impacting market dynamics in the long term. Nevertheless, the overall outlook for hydrocarbon solvents remains positive, driven by the continuous demand from key industries and ongoing innovations in solvent technology.
The competitive landscape is characterized by both large multinational corporations and regional players. Major players like ExxonMobil, Shell, BASF, and others are leveraging their extensive distribution networks and technological capabilities to maintain market leadership. Smaller regional players often focus on niche applications or specialized solvent formulations to compete effectively. The market is also witnessing increased mergers and acquisitions as companies seek to expand their product portfolios and geographical reach. The continuous innovation in solvent technology, coupled with the development of sustainable alternatives, is expected to reshape the competitive landscape in the coming years. The focus on reducing VOC emissions and increasing the sustainability of solvent production will be crucial for long-term success within the industry. This includes a shift towards bio-based solvents where feasible, impacting market share across different solvent types.
Hydrocarbon Solvents Industry Market Report: 2019-2033
This comprehensive report provides an in-depth analysis of the Hydrocarbon Solvents industry, encompassing market dynamics, growth trends, regional insights, product landscape, and key players. With a study period spanning 2019-2033, a base year of 2025, and a forecast period of 2025-2033, this report is an essential resource for industry professionals, investors, and strategic decision-makers. The report analyzes the parent market of Solvents and the child market of Hydrocarbon Solvents, offering granular insights into various segments and applications. The market size is presented in million units throughout the report.
Hydrocarbon Solvents Industry Market Dynamics & Structure
The Hydrocarbon Solvents market is characterized by a moderately concentrated landscape, with a few dominant players holding significant market share. Market concentration is influenced by factors such as economies of scale, technological expertise, and access to raw materials. Technological innovation, primarily focused on enhancing solvent performance, sustainability, and reducing environmental impact, is a key driver. Stringent environmental regulations are shaping the industry, pushing manufacturers towards greener solutions and sustainable practices. Competitive pressures from substitute solvents, such as bio-based solvents, are also impacting the market. End-user demographics, particularly in the paints and coatings, adhesives, and personal care sectors, significantly influence demand. M&A activity in the industry has been moderate, with xx deals recorded during the historical period (2019-2024), driven by strategic expansion and technology acquisition.
- Market Concentration: Moderately concentrated, with top 5 players holding xx% market share in 2024.
- Technological Innovation: Focus on bio-based alternatives and improved solvent performance.
- Regulatory Framework: Increasingly stringent environmental regulations driving sustainable practices.
- Competitive Substitutes: Bio-based solvents present a growing competitive challenge.
- M&A Activity: xx deals during 2019-2024, primarily focused on strategic expansion.
Hydrocarbon Solvents Industry Growth Trends & Insights
The Hydrocarbon Solvents market experienced steady growth during the historical period (2019-2024), driven primarily by increasing demand from various end-use sectors. The market size reached xx million units in 2024, exhibiting a CAGR of xx% during this period. Technological advancements, particularly in the development of high-performance solvents with improved efficiency and reduced environmental footprint, have influenced adoption rates. Consumer preference shifts towards eco-friendly products are also impacting market dynamics, with a growing demand for bio-based alternatives. However, fluctuating crude oil prices and economic downturns can influence market growth. The forecast period (2025-2033) anticipates continued growth, albeit at a moderated pace, driven by sustained demand from key end-use sectors and emerging applications. The market is projected to reach xx million units by 2033, with a projected CAGR of xx%.
Dominant Regions, Countries, or Segments in Hydrocarbon Solvents Industry
The North American region dominated the Hydrocarbon Solvents market in 2024, holding an estimated xx% market share, followed by Europe and Asia-Pacific. This dominance is attributed to factors such as established industrial infrastructure, high demand from key end-use sectors, and strong presence of major market players. Within the segments, the Petrochemical-based Solvents segment holds the largest market share, driven by its cost-effectiveness and wide applicability. The Paints and Coatings application segment also leads in terms of volume and value, driven by the significant use of hydrocarbon solvents in paints and coatings formulations.
- Key Regional Drivers:
- North America: Strong industrial base, high demand from various sectors.
- Europe: Stringent environmental regulations driving innovation in sustainable solvents.
- Asia-Pacific: Rapid industrialization and increasing urbanization fueling demand.
- Key Segment Drivers:
- Petrochemical-based Solvents: Cost-effectiveness and wide applicability.
- Paints and Coatings Application: High volume and value driven by significant solvent usage.
Hydrocarbon Solvents Industry Product Landscape
The Hydrocarbon Solvents market offers a diverse range of products, categorized by source (bio-based, petrochemical-based), type (oxygenated, hydrocarbon, halogenated), and application. Recent innovations focus on improving solvent performance, reducing VOC emissions, and enhancing sustainability. The unique selling propositions of different solvents are dictated by their specific properties, such as volatility, solvency power, and compatibility with different materials. Technological advancements are geared towards developing solvents with improved efficiency, reduced environmental impact, and enhanced safety features.
Key Drivers, Barriers & Challenges in Hydrocarbon Solvents Industry
Key Drivers:
- Increasing demand from key end-use sectors (paints & coatings, adhesives).
- Technological advancements leading to improved solvent performance and sustainability.
- Growing demand for environmentally friendly solvents.
Key Challenges & Restraints:
- Fluctuations in crude oil prices impacting raw material costs.
- Stringent environmental regulations and associated compliance costs.
- Competition from bio-based and other alternative solvents. This competition has resulted in a xx% reduction in market share for traditional hydrocarbon solvents in some segments.
Emerging Opportunities in Hydrocarbon Solvents Industry
- Growing demand for sustainable and biodegradable solvents.
- Expansion into emerging markets with high growth potential.
- Development of specialized solvents for niche applications (e.g., 3D printing).
Growth Accelerators in the Hydrocarbon Solvents Industry
Technological breakthroughs in solvent synthesis and formulation, along with strategic partnerships aimed at expanding market reach and improving product offerings, will significantly influence future growth. Strategic market expansion into high-growth regions and the development of sustainable and environmentally friendly solvents are also critical catalysts for long-term growth.
Key Players Shaping the Hydrocarbon Solvents Industry Market
- ADM
- Honeywell International Inc
- Arkema
- Solvay
- Shell plc
- Bharat Petroleum Corporation Limited
- Exxon Mobil Corporation
- INEOS
- Celanese Corporation
- GROUPE BERKEM
- Ashland
- BASF SE
- LyondellBasell Industries Holdings B V
- Huntsman International LLC
- Sasol Limited
- Gandhar Oil Refinery (India) Limited
- Dow
- Eastman Chemical Company
Notable Milestones in Hydrocarbon Solvents Industry Sector
- 2020: Introduction of a new generation of bio-based hydrocarbon solvents by Company X.
- 2022: Merger between Company Y and Company Z, creating a larger market player.
- 2023: Launch of a new solvent technology focused on reducing VOC emissions by Company A. (Further milestones can be added here)
In-Depth Hydrocarbon Solvents Industry Market Outlook
The Hydrocarbon Solvents market is poised for continued growth, driven by technological advancements, strategic partnerships, and increasing demand from key end-use industries. The future market potential is substantial, with significant opportunities for innovation in sustainable solvents and expansion into niche applications. Companies focusing on sustainability and technological leadership are expected to achieve strong growth and market share gains.
Hydrocarbon Solvents Industry Segmentation
-
1. Source
- 1.1. Bio-based Solvents
- 1.2. Petrochemical-based Solvents
-
2. Type
- 2.1. Oxygenated Solvents
- 2.2. Hydrocarbon Solvents
- 2.3. Halogenated Solvents
-
3. Application
- 3.1. Adhesives
- 3.2. Paints and Coatings
- 3.3. Personal Care
- 3.4. Pharmaceuticals
- 3.5. Polymer Production
- 3.6. Other Ap
Hydrocarbon Solvents Industry Segmentation By Geography
-
1. Asia Pacific
- 1.1. China
- 1.2. India
- 1.3. Japan
- 1.4. South Korea
- 1.5. Malaysia
- 1.6. Thailand
- 1.7. Indonesia
- 1.8. Vietnam
- 1.9. Rest of Asia Pacific
-
2. North America
- 2.1. United States
- 2.2. Canada
- 2.3. Mexico
-
3. Europe
- 3.1. Germany
- 3.2. United Kingdom
- 3.3. France
- 3.4. Italy
- 3.5. Spain
- 3.6. NORDIC Countries
- 3.7. Turkey
- 3.8. Russia
- 3.9. Rest of Europe
-
4. South America
- 4.1. Brazil
- 4.2. Argentina
- 4.3. Colombia
- 4.4. Rest of South America
-
5. Middle East and Africa
- 5.1. Saudi Arabia
- 5.2. Qatar
- 5.3. United Arab Emirates
- 5.4. Nigeria
- 5.5. Egypt
- 5.6. South Africa
- 5.7. Rest of Middle East and Africa
Hydrocarbon Solvents Industry REPORT HIGHLIGHTS
| Aspects | Details |
|---|---|
| Study Period | 2019-2033 |
| Base Year | 2024 |
| Estimated Year | 2025 |
| Forecast Period | 2025-2033 |
| Historical Period | 2019-2024 |
| Growth Rate | CAGR of 4.70% from 2019-2033 |
| Segmentation |
|
Table of Contents
- 1. Introduction
- 1.1. Research Scope
- 1.2. Market Segmentation
- 1.3. Research Methodology
- 1.4. Definitions and Assumptions
- 2. Executive Summary
- 2.1. Introduction
- 3. Market Dynamics
- 3.1. Introduction
- 3.2. Market Drivers
- 3.2.1. Surging Demand from the Paints & Coatings Sector; Stringent Regulations in Place to Minimize VOC Emissions; Other Drivers
- 3.3. Market Restrains
- 3.3.1. High Manufacturing Costs and Performance Issues of Solvents; Detrimental Effects of Chemical Solvents
- 3.4. Market Trends
- 3.4.1. Significant Demand from Construction and Automotive Industry
- 4. Market Factor Analysis
- 4.1. Porters Five Forces
- 4.2. Supply/Value Chain
- 4.3. PESTEL analysis
- 4.4. Market Entropy
- 4.5. Patent/Trademark Analysis
- 5. Global Hydrocarbon Solvents Industry Analysis, Insights and Forecast, 2019-2031
- 5.1. Market Analysis, Insights and Forecast - by Source
- 5.1.1. Bio-based Solvents
- 5.1.2. Petrochemical-based Solvents
- 5.2. Market Analysis, Insights and Forecast - by Type
- 5.2.1. Oxygenated Solvents
- 5.2.2. Hydrocarbon Solvents
- 5.2.3. Halogenated Solvents
- 5.3. Market Analysis, Insights and Forecast - by Application
- 5.3.1. Adhesives
- 5.3.2. Paints and Coatings
- 5.3.3. Personal Care
- 5.3.4. Pharmaceuticals
- 5.3.5. Polymer Production
- 5.3.6. Other Ap
- 5.4. Market Analysis, Insights and Forecast - by Region
- 5.4.1. Asia Pacific
- 5.4.2. North America
- 5.4.3. Europe
- 5.4.4. South America
- 5.4.5. Middle East and Africa
- 5.1. Market Analysis, Insights and Forecast - by Source
- 6. Asia Pacific Hydrocarbon Solvents Industry Analysis, Insights and Forecast, 2019-2031
- 6.1. Market Analysis, Insights and Forecast - by Source
- 6.1.1. Bio-based Solvents
- 6.1.2. Petrochemical-based Solvents
- 6.2. Market Analysis, Insights and Forecast - by Type
- 6.2.1. Oxygenated Solvents
- 6.2.2. Hydrocarbon Solvents
- 6.2.3. Halogenated Solvents
- 6.3. Market Analysis, Insights and Forecast - by Application
- 6.3.1. Adhesives
- 6.3.2. Paints and Coatings
- 6.3.3. Personal Care
- 6.3.4. Pharmaceuticals
- 6.3.5. Polymer Production
- 6.3.6. Other Ap
- 6.1. Market Analysis, Insights and Forecast - by Source
- 7. North America Hydrocarbon Solvents Industry Analysis, Insights and Forecast, 2019-2031
- 7.1. Market Analysis, Insights and Forecast - by Source
- 7.1.1. Bio-based Solvents
- 7.1.2. Petrochemical-based Solvents
- 7.2. Market Analysis, Insights and Forecast - by Type
- 7.2.1. Oxygenated Solvents
- 7.2.2. Hydrocarbon Solvents
- 7.2.3. Halogenated Solvents
- 7.3. Market Analysis, Insights and Forecast - by Application
- 7.3.1. Adhesives
- 7.3.2. Paints and Coatings
- 7.3.3. Personal Care
- 7.3.4. Pharmaceuticals
- 7.3.5. Polymer Production
- 7.3.6. Other Ap
- 7.1. Market Analysis, Insights and Forecast - by Source
- 8. Europe Hydrocarbon Solvents Industry Analysis, Insights and Forecast, 2019-2031
- 8.1. Market Analysis, Insights and Forecast - by Source
- 8.1.1. Bio-based Solvents
- 8.1.2. Petrochemical-based Solvents
- 8.2. Market Analysis, Insights and Forecast - by Type
- 8.2.1. Oxygenated Solvents
- 8.2.2. Hydrocarbon Solvents
- 8.2.3. Halogenated Solvents
- 8.3. Market Analysis, Insights and Forecast - by Application
- 8.3.1. Adhesives
- 8.3.2. Paints and Coatings
- 8.3.3. Personal Care
- 8.3.4. Pharmaceuticals
- 8.3.5. Polymer Production
- 8.3.6. Other Ap
- 8.1. Market Analysis, Insights and Forecast - by Source
- 9. South America Hydrocarbon Solvents Industry Analysis, Insights and Forecast, 2019-2031
- 9.1. Market Analysis, Insights and Forecast - by Source
- 9.1.1. Bio-based Solvents
- 9.1.2. Petrochemical-based Solvents
- 9.2. Market Analysis, Insights and Forecast - by Type
- 9.2.1. Oxygenated Solvents
- 9.2.2. Hydrocarbon Solvents
- 9.2.3. Halogenated Solvents
- 9.3. Market Analysis, Insights and Forecast - by Application
- 9.3.1. Adhesives
- 9.3.2. Paints and Coatings
- 9.3.3. Personal Care
- 9.3.4. Pharmaceuticals
- 9.3.5. Polymer Production
- 9.3.6. Other Ap
- 9.1. Market Analysis, Insights and Forecast - by Source
- 10. Middle East and Africa Hydrocarbon Solvents Industry Analysis, Insights and Forecast, 2019-2031
- 10.1. Market Analysis, Insights and Forecast - by Source
- 10.1.1. Bio-based Solvents
- 10.1.2. Petrochemical-based Solvents
- 10.2. Market Analysis, Insights and Forecast - by Type
- 10.2.1. Oxygenated Solvents
- 10.2.2. Hydrocarbon Solvents
- 10.2.3. Halogenated Solvents
- 10.3. Market Analysis, Insights and Forecast - by Application
- 10.3.1. Adhesives
- 10.3.2. Paints and Coatings
- 10.3.3. Personal Care
- 10.3.4. Pharmaceuticals
- 10.3.5. Polymer Production
- 10.3.6. Other Ap
- 10.1. Market Analysis, Insights and Forecast - by Source
- 11. Asia Pacific Hydrocarbon Solvents Industry Analysis, Insights and Forecast, 2019-2031
- 11.1. Market Analysis, Insights and Forecast - By Country/Sub-region
- 11.1.1 China
- 11.1.2 India
- 11.1.3 Japan
- 11.1.4 South Korea
- 11.1.5 Rest of Asia Pacific
- 12. North America Hydrocarbon Solvents Industry Analysis, Insights and Forecast, 2019-2031
- 12.1. Market Analysis, Insights and Forecast - By Country/Sub-region
- 12.1.1 United States
- 12.1.2 Canada
- 12.1.3 Mexico
- 13. Europe Hydrocarbon Solvents Industry Analysis, Insights and Forecast, 2019-2031
- 13.1. Market Analysis, Insights and Forecast - By Country/Sub-region
- 13.1.1 Germany
- 13.1.2 United Kingdom
- 13.1.3 France
- 13.1.4 Italy
- 13.1.5 Rest of Europe
- 14. South America Hydrocarbon Solvents Industry Analysis, Insights and Forecast, 2019-2031
- 14.1. Market Analysis, Insights and Forecast - By Country/Sub-region
- 14.1.1 Brazil
- 14.1.2 Argentina
- 14.1.3 Rest of South America
- 15. Middle East and Africa Hydrocarbon Solvents Industry Analysis, Insights and Forecast, 2019-2031
- 15.1. Market Analysis, Insights and Forecast - By Country/Sub-region
- 15.1.1 Saudi Arabia
- 15.1.2 South Africa
- 15.1.3 Rest of Middle East and Africa
- 16. Competitive Analysis
- 16.1. Global Market Share Analysis 2024
- 16.2. Company Profiles
- 16.2.1 ADM
- 16.2.1.1. Overview
- 16.2.1.2. Products
- 16.2.1.3. SWOT Analysis
- 16.2.1.4. Recent Developments
- 16.2.1.5. Financials (Based on Availability)
- 16.2.2 Honeywell International Inc
- 16.2.2.1. Overview
- 16.2.2.2. Products
- 16.2.2.3. SWOT Analysis
- 16.2.2.4. Recent Developments
- 16.2.2.5. Financials (Based on Availability)
- 16.2.3 Arkema
- 16.2.3.1. Overview
- 16.2.3.2. Products
- 16.2.3.3. SWOT Analysis
- 16.2.3.4. Recent Developments
- 16.2.3.5. Financials (Based on Availability)
- 16.2.4 Solvay*List Not Exhaustive
- 16.2.4.1. Overview
- 16.2.4.2. Products
- 16.2.4.3. SWOT Analysis
- 16.2.4.4. Recent Developments
- 16.2.4.5. Financials (Based on Availability)
- 16.2.5 Shell plc
- 16.2.5.1. Overview
- 16.2.5.2. Products
- 16.2.5.3. SWOT Analysis
- 16.2.5.4. Recent Developments
- 16.2.5.5. Financials (Based on Availability)
- 16.2.6 Bharat Petroleum Corporation Limited
- 16.2.6.1. Overview
- 16.2.6.2. Products
- 16.2.6.3. SWOT Analysis
- 16.2.6.4. Recent Developments
- 16.2.6.5. Financials (Based on Availability)
- 16.2.7 Exxon Mobil Corporation
- 16.2.7.1. Overview
- 16.2.7.2. Products
- 16.2.7.3. SWOT Analysis
- 16.2.7.4. Recent Developments
- 16.2.7.5. Financials (Based on Availability)
- 16.2.8 INEOS
- 16.2.8.1. Overview
- 16.2.8.2. Products
- 16.2.8.3. SWOT Analysis
- 16.2.8.4. Recent Developments
- 16.2.8.5. Financials (Based on Availability)
- 16.2.9 Celanese Corporation
- 16.2.9.1. Overview
- 16.2.9.2. Products
- 16.2.9.3. SWOT Analysis
- 16.2.9.4. Recent Developments
- 16.2.9.5. Financials (Based on Availability)
- 16.2.10 GROUPE BERKEM
- 16.2.10.1. Overview
- 16.2.10.2. Products
- 16.2.10.3. SWOT Analysis
- 16.2.10.4. Recent Developments
- 16.2.10.5. Financials (Based on Availability)
- 16.2.11 Ashland
- 16.2.11.1. Overview
- 16.2.11.2. Products
- 16.2.11.3. SWOT Analysis
- 16.2.11.4. Recent Developments
- 16.2.11.5. Financials (Based on Availability)
- 16.2.12 BASF SE
- 16.2.12.1. Overview
- 16.2.12.2. Products
- 16.2.12.3. SWOT Analysis
- 16.2.12.4. Recent Developments
- 16.2.12.5. Financials (Based on Availability)
- 16.2.13 LyondellBasell Industries Holdings B V
- 16.2.13.1. Overview
- 16.2.13.2. Products
- 16.2.13.3. SWOT Analysis
- 16.2.13.4. Recent Developments
- 16.2.13.5. Financials (Based on Availability)
- 16.2.14 Huntsman International LLC
- 16.2.14.1. Overview
- 16.2.14.2. Products
- 16.2.14.3. SWOT Analysis
- 16.2.14.4. Recent Developments
- 16.2.14.5. Financials (Based on Availability)
- 16.2.15 Sasol Limited
- 16.2.15.1. Overview
- 16.2.15.2. Products
- 16.2.15.3. SWOT Analysis
- 16.2.15.4. Recent Developments
- 16.2.15.5. Financials (Based on Availability)
- 16.2.16 Gandhar Oil Refinery (India) Limited
- 16.2.16.1. Overview
- 16.2.16.2. Products
- 16.2.16.3. SWOT Analysis
- 16.2.16.4. Recent Developments
- 16.2.16.5. Financials (Based on Availability)
- 16.2.17 Dow
- 16.2.17.1. Overview
- 16.2.17.2. Products
- 16.2.17.3. SWOT Analysis
- 16.2.17.4. Recent Developments
- 16.2.17.5. Financials (Based on Availability)
- 16.2.18 Eastman Chemical Company
- 16.2.18.1. Overview
- 16.2.18.2. Products
- 16.2.18.3. SWOT Analysis
- 16.2.18.4. Recent Developments
- 16.2.18.5. Financials (Based on Availability)
- 16.2.1 ADM
List of Figures
- Figure 1: Global Hydrocarbon Solvents Industry Revenue Breakdown (Million, %) by Region 2024 & 2032
- Figure 2: Asia Pacific Hydrocarbon Solvents Industry Revenue (Million), by Country 2024 & 2032
- Figure 3: Asia Pacific Hydrocarbon Solvents Industry Revenue Share (%), by Country 2024 & 2032
- Figure 4: North America Hydrocarbon Solvents Industry Revenue (Million), by Country 2024 & 2032
- Figure 5: North America Hydrocarbon Solvents Industry Revenue Share (%), by Country 2024 & 2032
- Figure 6: Europe Hydrocarbon Solvents Industry Revenue (Million), by Country 2024 & 2032
- Figure 7: Europe Hydrocarbon Solvents Industry Revenue Share (%), by Country 2024 & 2032
- Figure 8: South America Hydrocarbon Solvents Industry Revenue (Million), by Country 2024 & 2032
- Figure 9: South America Hydrocarbon Solvents Industry Revenue Share (%), by Country 2024 & 2032
- Figure 10: Middle East and Africa Hydrocarbon Solvents Industry Revenue (Million), by Country 2024 & 2032
- Figure 11: Middle East and Africa Hydrocarbon Solvents Industry Revenue Share (%), by Country 2024 & 2032
- Figure 12: Asia Pacific Hydrocarbon Solvents Industry Revenue (Million), by Source 2024 & 2032
- Figure 13: Asia Pacific Hydrocarbon Solvents Industry Revenue Share (%), by Source 2024 & 2032
- Figure 14: Asia Pacific Hydrocarbon Solvents Industry Revenue (Million), by Type 2024 & 2032
- Figure 15: Asia Pacific Hydrocarbon Solvents Industry Revenue Share (%), by Type 2024 & 2032
- Figure 16: Asia Pacific Hydrocarbon Solvents Industry Revenue (Million), by Application 2024 & 2032
- Figure 17: Asia Pacific Hydrocarbon Solvents Industry Revenue Share (%), by Application 2024 & 2032
- Figure 18: Asia Pacific Hydrocarbon Solvents Industry Revenue (Million), by Country 2024 & 2032
- Figure 19: Asia Pacific Hydrocarbon Solvents Industry Revenue Share (%), by Country 2024 & 2032
- Figure 20: North America Hydrocarbon Solvents Industry Revenue (Million), by Source 2024 & 2032
- Figure 21: North America Hydrocarbon Solvents Industry Revenue Share (%), by Source 2024 & 2032
- Figure 22: North America Hydrocarbon Solvents Industry Revenue (Million), by Type 2024 & 2032
- Figure 23: North America Hydrocarbon Solvents Industry Revenue Share (%), by Type 2024 & 2032
- Figure 24: North America Hydrocarbon Solvents Industry Revenue (Million), by Application 2024 & 2032
- Figure 25: North America Hydrocarbon Solvents Industry Revenue Share (%), by Application 2024 & 2032
- Figure 26: North America Hydrocarbon Solvents Industry Revenue (Million), by Country 2024 & 2032
- Figure 27: North America Hydrocarbon Solvents Industry Revenue Share (%), by Country 2024 & 2032
- Figure 28: Europe Hydrocarbon Solvents Industry Revenue (Million), by Source 2024 & 2032
- Figure 29: Europe Hydrocarbon Solvents Industry Revenue Share (%), by Source 2024 & 2032
- Figure 30: Europe Hydrocarbon Solvents Industry Revenue (Million), by Type 2024 & 2032
- Figure 31: Europe Hydrocarbon Solvents Industry Revenue Share (%), by Type 2024 & 2032
- Figure 32: Europe Hydrocarbon Solvents Industry Revenue (Million), by Application 2024 & 2032
- Figure 33: Europe Hydrocarbon Solvents Industry Revenue Share (%), by Application 2024 & 2032
- Figure 34: Europe Hydrocarbon Solvents Industry Revenue (Million), by Country 2024 & 2032
- Figure 35: Europe Hydrocarbon Solvents Industry Revenue Share (%), by Country 2024 & 2032
- Figure 36: South America Hydrocarbon Solvents Industry Revenue (Million), by Source 2024 & 2032
- Figure 37: South America Hydrocarbon Solvents Industry Revenue Share (%), by Source 2024 & 2032
- Figure 38: South America Hydrocarbon Solvents Industry Revenue (Million), by Type 2024 & 2032
- Figure 39: South America Hydrocarbon Solvents Industry Revenue Share (%), by Type 2024 & 2032
- Figure 40: South America Hydrocarbon Solvents Industry Revenue (Million), by Application 2024 & 2032
- Figure 41: South America Hydrocarbon Solvents Industry Revenue Share (%), by Application 2024 & 2032
- Figure 42: South America Hydrocarbon Solvents Industry Revenue (Million), by Country 2024 & 2032
- Figure 43: South America Hydrocarbon Solvents Industry Revenue Share (%), by Country 2024 & 2032
- Figure 44: Middle East and Africa Hydrocarbon Solvents Industry Revenue (Million), by Source 2024 & 2032
- Figure 45: Middle East and Africa Hydrocarbon Solvents Industry Revenue Share (%), by Source 2024 & 2032
- Figure 46: Middle East and Africa Hydrocarbon Solvents Industry Revenue (Million), by Type 2024 & 2032
- Figure 47: Middle East and Africa Hydrocarbon Solvents Industry Revenue Share (%), by Type 2024 & 2032
- Figure 48: Middle East and Africa Hydrocarbon Solvents Industry Revenue (Million), by Application 2024 & 2032
- Figure 49: Middle East and Africa Hydrocarbon Solvents Industry Revenue Share (%), by Application 2024 & 2032
- Figure 50: Middle East and Africa Hydrocarbon Solvents Industry Revenue (Million), by Country 2024 & 2032
- Figure 51: Middle East and Africa Hydrocarbon Solvents Industry Revenue Share (%), by Country 2024 & 2032
List of Tables
- Table 1: Global Hydrocarbon Solvents Industry Revenue Million Forecast, by Region 2019 & 2032
- Table 2: Global Hydrocarbon Solvents Industry Revenue Million Forecast, by Source 2019 & 2032
- Table 3: Global Hydrocarbon Solvents Industry Revenue Million Forecast, by Type 2019 & 2032
- Table 4: Global Hydrocarbon Solvents Industry Revenue Million Forecast, by Application 2019 & 2032
- Table 5: Global Hydrocarbon Solvents Industry Revenue Million Forecast, by Region 2019 & 2032
- Table 6: Global Hydrocarbon Solvents Industry Revenue Million Forecast, by Country 2019 & 2032
- Table 7: China Hydrocarbon Solvents Industry Revenue (Million) Forecast, by Application 2019 & 2032
- Table 8: India Hydrocarbon Solvents Industry Revenue (Million) Forecast, by Application 2019 & 2032
- Table 9: Japan Hydrocarbon Solvents Industry Revenue (Million) Forecast, by Application 2019 & 2032
- Table 10: South Korea Hydrocarbon Solvents Industry Revenue (Million) Forecast, by Application 2019 & 2032
- Table 11: Rest of Asia Pacific Hydrocarbon Solvents Industry Revenue (Million) Forecast, by Application 2019 & 2032
- Table 12: Global Hydrocarbon Solvents Industry Revenue Million Forecast, by Country 2019 & 2032
- Table 13: United States Hydrocarbon Solvents Industry Revenue (Million) Forecast, by Application 2019 & 2032
- Table 14: Canada Hydrocarbon Solvents Industry Revenue (Million) Forecast, by Application 2019 & 2032
- Table 15: Mexico Hydrocarbon Solvents Industry Revenue (Million) Forecast, by Application 2019 & 2032
- Table 16: Global Hydrocarbon Solvents Industry Revenue Million Forecast, by Country 2019 & 2032
- Table 17: Germany Hydrocarbon Solvents Industry Revenue (Million) Forecast, by Application 2019 & 2032
- Table 18: United Kingdom Hydrocarbon Solvents Industry Revenue (Million) Forecast, by Application 2019 & 2032
- Table 19: France Hydrocarbon Solvents Industry Revenue (Million) Forecast, by Application 2019 & 2032
- Table 20: Italy Hydrocarbon Solvents Industry Revenue (Million) Forecast, by Application 2019 & 2032
- Table 21: Rest of Europe Hydrocarbon Solvents Industry Revenue (Million) Forecast, by Application 2019 & 2032
- Table 22: Global Hydrocarbon Solvents Industry Revenue Million Forecast, by Country 2019 & 2032
- Table 23: Brazil Hydrocarbon Solvents Industry Revenue (Million) Forecast, by Application 2019 & 2032
- Table 24: Argentina Hydrocarbon Solvents Industry Revenue (Million) Forecast, by Application 2019 & 2032
- Table 25: Rest of South America Hydrocarbon Solvents Industry Revenue (Million) Forecast, by Application 2019 & 2032
- Table 26: Global Hydrocarbon Solvents Industry Revenue Million Forecast, by Country 2019 & 2032
- Table 27: Saudi Arabia Hydrocarbon Solvents Industry Revenue (Million) Forecast, by Application 2019 & 2032
- Table 28: South Africa Hydrocarbon Solvents Industry Revenue (Million) Forecast, by Application 2019 & 2032
- Table 29: Rest of Middle East and Africa Hydrocarbon Solvents Industry Revenue (Million) Forecast, by Application 2019 & 2032
- Table 30: Global Hydrocarbon Solvents Industry Revenue Million Forecast, by Source 2019 & 2032
- Table 31: Global Hydrocarbon Solvents Industry Revenue Million Forecast, by Type 2019 & 2032
- Table 32: Global Hydrocarbon Solvents Industry Revenue Million Forecast, by Application 2019 & 2032
- Table 33: Global Hydrocarbon Solvents Industry Revenue Million Forecast, by Country 2019 & 2032
- Table 34: China Hydrocarbon Solvents Industry Revenue (Million) Forecast, by Application 2019 & 2032
- Table 35: India Hydrocarbon Solvents Industry Revenue (Million) Forecast, by Application 2019 & 2032
- Table 36: Japan Hydrocarbon Solvents Industry Revenue (Million) Forecast, by Application 2019 & 2032
- Table 37: South Korea Hydrocarbon Solvents Industry Revenue (Million) Forecast, by Application 2019 & 2032
- Table 38: Malaysia Hydrocarbon Solvents Industry Revenue (Million) Forecast, by Application 2019 & 2032
- Table 39: Thailand Hydrocarbon Solvents Industry Revenue (Million) Forecast, by Application 2019 & 2032
- Table 40: Indonesia Hydrocarbon Solvents Industry Revenue (Million) Forecast, by Application 2019 & 2032
- Table 41: Vietnam Hydrocarbon Solvents Industry Revenue (Million) Forecast, by Application 2019 & 2032
- Table 42: Rest of Asia Pacific Hydrocarbon Solvents Industry Revenue (Million) Forecast, by Application 2019 & 2032
- Table 43: Global Hydrocarbon Solvents Industry Revenue Million Forecast, by Source 2019 & 2032
- Table 44: Global Hydrocarbon Solvents Industry Revenue Million Forecast, by Type 2019 & 2032
- Table 45: Global Hydrocarbon Solvents Industry Revenue Million Forecast, by Application 2019 & 2032
- Table 46: Global Hydrocarbon Solvents Industry Revenue Million Forecast, by Country 2019 & 2032
- Table 47: United States Hydrocarbon Solvents Industry Revenue (Million) Forecast, by Application 2019 & 2032
- Table 48: Canada Hydrocarbon Solvents Industry Revenue (Million) Forecast, by Application 2019 & 2032
- Table 49: Mexico Hydrocarbon Solvents Industry Revenue (Million) Forecast, by Application 2019 & 2032
- Table 50: Global Hydrocarbon Solvents Industry Revenue Million Forecast, by Source 2019 & 2032
- Table 51: Global Hydrocarbon Solvents Industry Revenue Million Forecast, by Type 2019 & 2032
- Table 52: Global Hydrocarbon Solvents Industry Revenue Million Forecast, by Application 2019 & 2032
- Table 53: Global Hydrocarbon Solvents Industry Revenue Million Forecast, by Country 2019 & 2032
- Table 54: Germany Hydrocarbon Solvents Industry Revenue (Million) Forecast, by Application 2019 & 2032
- Table 55: United Kingdom Hydrocarbon Solvents Industry Revenue (Million) Forecast, by Application 2019 & 2032
- Table 56: France Hydrocarbon Solvents Industry Revenue (Million) Forecast, by Application 2019 & 2032
- Table 57: Italy Hydrocarbon Solvents Industry Revenue (Million) Forecast, by Application 2019 & 2032
- Table 58: Spain Hydrocarbon Solvents Industry Revenue (Million) Forecast, by Application 2019 & 2032
- Table 59: NORDIC Countries Hydrocarbon Solvents Industry Revenue (Million) Forecast, by Application 2019 & 2032
- Table 60: Turkey Hydrocarbon Solvents Industry Revenue (Million) Forecast, by Application 2019 & 2032
- Table 61: Russia Hydrocarbon Solvents Industry Revenue (Million) Forecast, by Application 2019 & 2032
- Table 62: Rest of Europe Hydrocarbon Solvents Industry Revenue (Million) Forecast, by Application 2019 & 2032
- Table 63: Global Hydrocarbon Solvents Industry Revenue Million Forecast, by Source 2019 & 2032
- Table 64: Global Hydrocarbon Solvents Industry Revenue Million Forecast, by Type 2019 & 2032
- Table 65: Global Hydrocarbon Solvents Industry Revenue Million Forecast, by Application 2019 & 2032
- Table 66: Global Hydrocarbon Solvents Industry Revenue Million Forecast, by Country 2019 & 2032
- Table 67: Brazil Hydrocarbon Solvents Industry Revenue (Million) Forecast, by Application 2019 & 2032
- Table 68: Argentina Hydrocarbon Solvents Industry Revenue (Million) Forecast, by Application 2019 & 2032
- Table 69: Colombia Hydrocarbon Solvents Industry Revenue (Million) Forecast, by Application 2019 & 2032
- Table 70: Rest of South America Hydrocarbon Solvents Industry Revenue (Million) Forecast, by Application 2019 & 2032
- Table 71: Global Hydrocarbon Solvents Industry Revenue Million Forecast, by Source 2019 & 2032
- Table 72: Global Hydrocarbon Solvents Industry Revenue Million Forecast, by Type 2019 & 2032
- Table 73: Global Hydrocarbon Solvents Industry Revenue Million Forecast, by Application 2019 & 2032
- Table 74: Global Hydrocarbon Solvents Industry Revenue Million Forecast, by Country 2019 & 2032
- Table 75: Saudi Arabia Hydrocarbon Solvents Industry Revenue (Million) Forecast, by Application 2019 & 2032
- Table 76: Qatar Hydrocarbon Solvents Industry Revenue (Million) Forecast, by Application 2019 & 2032
- Table 77: United Arab Emirates Hydrocarbon Solvents Industry Revenue (Million) Forecast, by Application 2019 & 2032
- Table 78: Nigeria Hydrocarbon Solvents Industry Revenue (Million) Forecast, by Application 2019 & 2032
- Table 79: Egypt Hydrocarbon Solvents Industry Revenue (Million) Forecast, by Application 2019 & 2032
- Table 80: South Africa Hydrocarbon Solvents Industry Revenue (Million) Forecast, by Application 2019 & 2032
- Table 81: Rest of Middle East and Africa Hydrocarbon Solvents Industry Revenue (Million) Forecast, by Application 2019 & 2032
Frequently Asked Questions
1. What is the projected Compound Annual Growth Rate (CAGR) of the Hydrocarbon Solvents Industry?
The projected CAGR is approximately 4.70%.
2. Which companies are prominent players in the Hydrocarbon Solvents Industry?
Key companies in the market include ADM, Honeywell International Inc, Arkema, Solvay*List Not Exhaustive, Shell plc, Bharat Petroleum Corporation Limited, Exxon Mobil Corporation, INEOS, Celanese Corporation, GROUPE BERKEM, Ashland, BASF SE, LyondellBasell Industries Holdings B V, Huntsman International LLC, Sasol Limited, Gandhar Oil Refinery (India) Limited, Dow, Eastman Chemical Company.
3. What are the main segments of the Hydrocarbon Solvents Industry?
The market segments include Source, Type, Application.
4. Can you provide details about the market size?
The market size is estimated to be USD 33.59 Million as of 2022.
5. What are some drivers contributing to market growth?
Surging Demand from the Paints & Coatings Sector; Stringent Regulations in Place to Minimize VOC Emissions; Other Drivers.
6. What are the notable trends driving market growth?
Significant Demand from Construction and Automotive Industry.
7. Are there any restraints impacting market growth?
High Manufacturing Costs and Performance Issues of Solvents; Detrimental Effects of Chemical Solvents.
8. Can you provide examples of recent developments in the market?
N/A
9. What pricing options are available for accessing the report?
Pricing options include single-user, multi-user, and enterprise licenses priced at USD 4750, USD 5250, and USD 8750 respectively.
10. Is the market size provided in terms of value or volume?
The market size is provided in terms of value, measured in Million.
11. Are there any specific market keywords associated with the report?
Yes, the market keyword associated with the report is "Hydrocarbon Solvents Industry," which aids in identifying and referencing the specific market segment covered.
12. How do I determine which pricing option suits my needs best?
The pricing options vary based on user requirements and access needs. Individual users may opt for single-user licenses, while businesses requiring broader access may choose multi-user or enterprise licenses for cost-effective access to the report.
13. Are there any additional resources or data provided in the Hydrocarbon Solvents Industry report?
While the report offers comprehensive insights, it's advisable to review the specific contents or supplementary materials provided to ascertain if additional resources or data are available.
14. How can I stay updated on further developments or reports in the Hydrocarbon Solvents Industry?
To stay informed about further developments, trends, and reports in the Hydrocarbon Solvents Industry, consider subscribing to industry newsletters, following relevant companies and organizations, or regularly checking reputable industry news sources and publications.
Methodology
Step 1 - Identification of Relevant Samples Size from Population Database


Step 2 - Approaches for Defining Global Market Size (Value, Volume* & Price*)

Note*: In applicable scenarios
Step 3 - Data Sources
Primary Research
- Web Analytics
- Survey Reports
- Research Institute
- Latest Research Reports
- Opinion Leaders
Secondary Research
- Annual Reports
- White Paper
- Latest Press Release
- Industry Association
- Paid Database
- Investor Presentations

Step 4 - Data Triangulation
Involves using different sources of information in order to increase the validity of a study
These sources are likely to be stakeholders in a program - participants, other researchers, program staff, other community members, and so on.
Then we put all data in single framework & apply various statistical tools to find out the dynamic on the market.
During the analysis stage, feedback from the stakeholder groups would be compared to determine areas of agreement as well as areas of divergence


