
Key Insights
The high-throughput screening (HTS) market is experiencing robust growth, driven by the increasing demand for faster and more efficient drug discovery and development processes within the pharmaceutical and biotechnology industries. The market's expansion is fueled by several key factors. Advances in technologies like ultra-high-throughput screening, cell-based assays, and lab-on-a-chip systems are enabling researchers to screen significantly larger compound libraries in shorter timeframes, leading to accelerated target identification and lead optimization. Furthermore, the rising prevalence of chronic diseases and the growing need for personalized medicine are stimulating substantial investment in drug discovery research, thereby boosting the HTS market. The integration of label-free technologies minimizes the need for reagents and reduces assay costs, further propelling market growth. Applications spanning target identification, primary screening, and toxicology studies across various therapeutic areas contribute to the market's overall expansion.
Despite the positive trajectory, market growth faces some challenges. The high cost of advanced HTS technologies and specialized expertise needed to operate them can be a barrier for entry for smaller research institutions and organizations. Regulatory hurdles and the complexity of translating HTS results into clinical success also impact market growth. However, the ongoing development of more affordable and user-friendly HTS technologies, coupled with increasing collaborations between academic institutions, pharmaceutical companies, and contract research organizations, is expected to mitigate these challenges. The market is segmented by technology (e.g., ultra-high-throughput screening, cell-based assays), application (e.g., target identification, primary screening, toxicology), products and services (instruments, reagents, services), and end-user (pharmaceutical and biotechnology firms, academia, CROs). North America currently holds a significant market share due to the presence of major pharmaceutical companies and robust research infrastructure; however, Asia Pacific is expected to witness significant growth in the coming years, driven by expanding research activities and increasing healthcare spending in countries like China and India. The forecast period of 2025-2033 promises sustained growth, with the market expected to reach a substantial size driven by continued technological innovation and the ever-increasing demand for efficient drug discovery solutions.
HTS Market: A Comprehensive Market Report (2019-2033)
This comprehensive report provides a detailed analysis of the High-Throughput Screening (HTS) market, encompassing market dynamics, growth trends, regional dominance, product landscape, key players, and future outlook. The report covers the period from 2019 to 2033, with 2025 as the base year and a forecast period from 2025 to 2033. The market is segmented by technology (Ultra-high-throughput Screening, Cell-based Assays, Lab-on-a-chip, Label-free Technology), application (Target Identification, Primary Screening, Toxicology), product and services (Instruments, Reagents and Kits, Services), and end-user (Pharmaceutical and Biotechnology Firms, Academia and Research Institutes, Contract Research Organizations). The total market size is projected to reach xx Million by 2033.
HTS Market Dynamics & Structure
The HTS market is characterized by moderate concentration, with key players like Thermo Fisher Scientific, Danaher Corporation, and Merck KGaA holding significant market share. Technological innovation, particularly in automation and miniaturization, is a primary growth driver. Stringent regulatory frameworks, especially concerning drug development and safety, influence market growth. Competitive substitutes, such as traditional screening methods, pose a challenge. The end-user demographic is primarily driven by pharmaceutical and biotechnology firms, followed by academic and research institutions and contract research organizations (CROs). M&A activity in the sector has been relatively active, with xx deals recorded between 2019 and 2024, reflecting consolidation and expansion strategies. The average deal size was approximately xx Million.
- Market Concentration: Moderately concentrated, with top 5 players holding approximately xx% market share in 2024.
- Technological Innovation: Significant advancements in automation, miniaturization (e.g., lab-on-a-chip technologies), and data analysis drive market growth.
- Regulatory Landscape: Stringent regulations concerning drug safety and efficacy impact market development and adoption.
- Competitive Landscape: Traditional screening methods and emerging technologies pose competitive pressure.
- M&A Activity: xx M&A deals recorded between 2019-2024, with an average deal size of xx Million, indicating consolidation and strategic expansion.
- Innovation Barriers: High R&D costs, stringent regulatory approvals, and the need for skilled personnel are significant barriers.
HTS Market Growth Trends & Insights
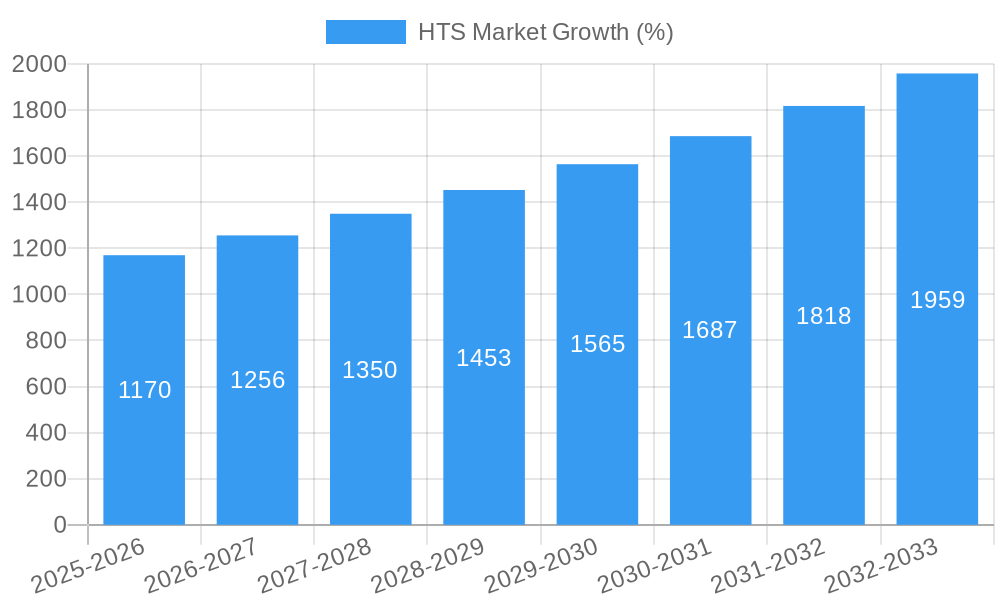
The HTS market experienced significant growth during the historical period (2019-2024), with a CAGR of xx%. This growth is primarily attributed to increasing demand for faster and more efficient drug discovery and development processes. The rising prevalence of chronic diseases and growing investments in pharmaceutical R&D are key factors fueling market expansion. Technological advancements, such as the development of automated high-throughput screening systems and advanced analytical tools, have significantly enhanced the efficiency and throughput of HTS, further accelerating market growth. The market penetration rate for HTS in the pharmaceutical industry has increased from xx% in 2019 to xx% in 2024. The market is expected to continue its growth trajectory during the forecast period (2025-2033), driven by factors such as increasing demand for personalized medicine and the growing adoption of HTS in academic and research settings. The forecast CAGR is estimated at xx%.
Dominant Regions, Countries, or Segments in HTS Market
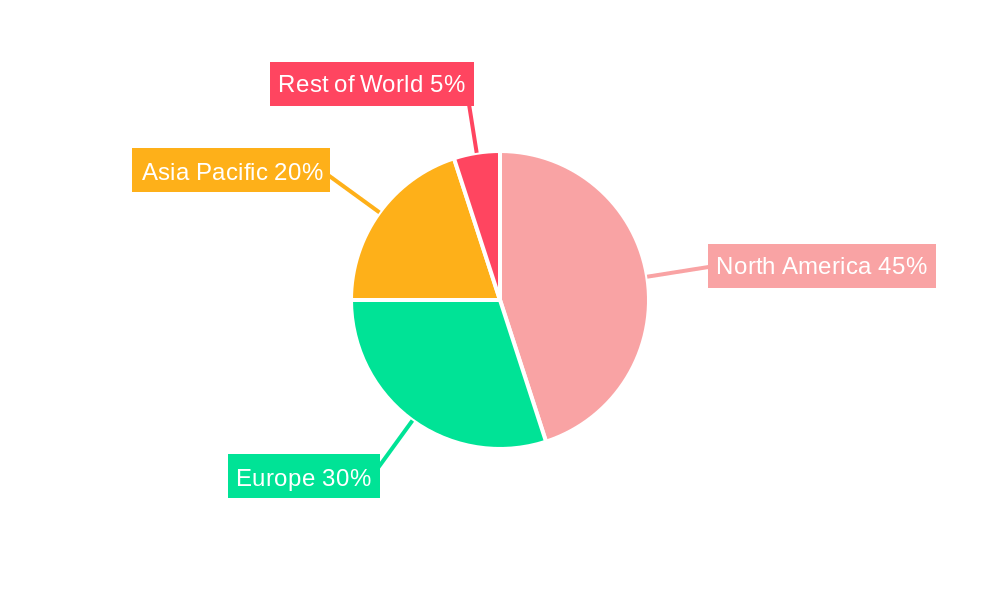
North America currently dominates the HTS market, driven by strong R&D spending, the presence of major pharmaceutical and biotechnology companies, and advanced healthcare infrastructure. Europe follows closely, exhibiting robust growth due to a similar infrastructure and R&D activities. Within the segments, Ultra-high-throughput Screening and Cell-based Assays hold the largest market share, fueled by their effectiveness and wide applicability. The Pharmaceutical and Biotechnology Firms segment also dominates the end-user landscape.
- North America: Strong R&D investment, presence of major pharmaceutical companies, and advanced healthcare infrastructure drive market dominance.
- Europe: Similar to North America, robust R&D activities and healthcare infrastructure support market growth.
- Asia-Pacific: Growing pharmaceutical industry and increasing R&D investment are expected to drive future growth.
- Dominant Segments: Ultra-high-throughput screening and Cell-based assays command significant market share due to their efficiency and wide application.
- Dominant End-user: Pharmaceutical and Biotechnology firms account for the largest portion of the market.
HTS Market Product Landscape
The HTS market offers a diverse range of products and services, including automated liquid handling systems, microplate readers, and software solutions for data analysis. Significant innovations include the integration of artificial intelligence (AI) and machine learning (ML) for improved data analysis and drug discovery. The latest generation of instruments offer increased throughput, enhanced sensitivity, and improved data quality. Companies are focusing on developing user-friendly interfaces and integrated workflows to enhance usability and efficiency. Miniaturized systems, such as lab-on-a-chip devices, are gaining traction due to their cost-effectiveness and reduced reagent consumption.
Key Drivers, Barriers & Challenges in HTS Market
Key Drivers:
- Increasing demand for faster and more efficient drug discovery and development.
- Rising prevalence of chronic diseases.
- Growing investments in pharmaceutical and biotechnology research and development.
- Technological advancements leading to more efficient and accurate HTS platforms.
Challenges and Restraints:
- High initial investment costs for advanced HTS systems can be a barrier for smaller organizations.
- Stringent regulatory approvals for new HTS technologies and related products can cause delays in market entry.
- The complexity of HTS operations may require highly skilled personnel, leading to higher operational costs.
- Competition from established players and emerging technologies can put downward pressure on prices.
Emerging Opportunities in HTS Market
- Growing adoption of personalized medicine.
- Expansion into new therapeutic areas, such as oncology and infectious diseases.
- Development of novel HTS platforms with improved efficiency, sensitivity, and throughput.
- Integration of advanced data analytics techniques, such as AI and ML, to accelerate drug discovery.
Growth Accelerators in the HTS Market Industry
Technological advancements, strategic partnerships, and expansion into emerging markets are key growth accelerators for the HTS industry. The development of novel screening technologies and improved data analysis tools is enhancing the efficiency and effectiveness of HTS. Strategic collaborations between pharmaceutical companies, biotechnology firms, and technology providers are fostering innovation and accelerating product development. The expansion into emerging markets with growing healthcare infrastructure and increasing pharmaceutical R&D investment presents significant opportunities for growth.
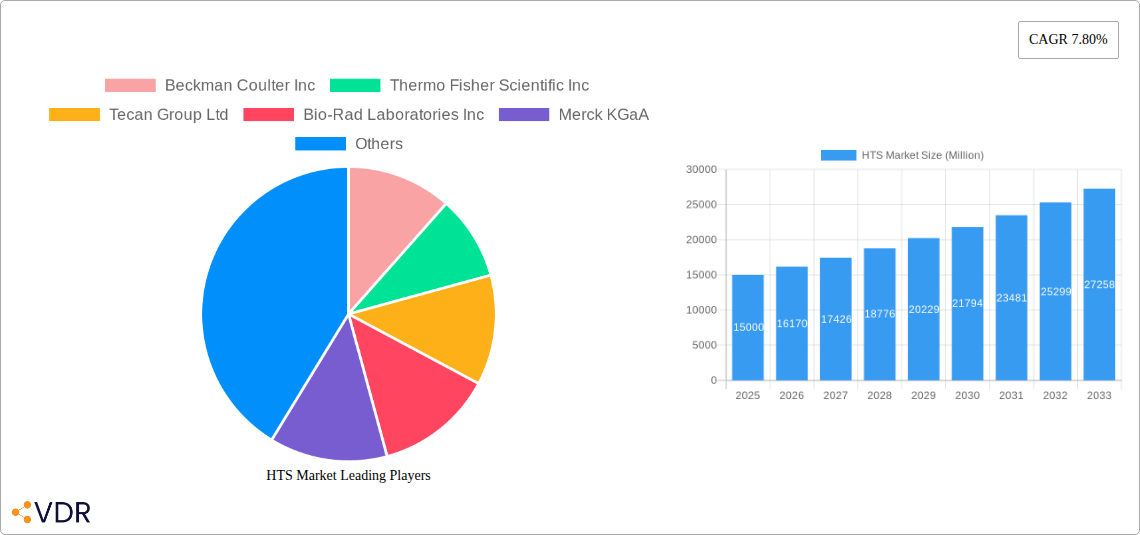
Key Players Shaping the HTS Market Market
- Beckman Coulter Inc
- Thermo Fisher Scientific Inc
- Tecan Group Ltd
- Bio-Rad Laboratories Inc
- Merck KGaA
- GE Healthcare
- Danaher Corporation
- Agilent Technologies Inc
- PerkinElmer Inc
- Axxam SpA
Notable Milestones in HTS Market Sector
- August 2022: Molbio Diagnostics launched a new test for differential diagnosis of HIV 1 and HIV 2 with viral loads within 60 minutes.
- July 2022: Evotech Technologies launched the cell analyzer 'Opera' for fast high-content analysis of drug activity with sub-cellular resolution.
- February 2022: Bruker Corporation launched the timsTOF MALDI PharmaPulse (timsTOF MPP) system, a groundbreaking new high-end solution for unbiased, deep HTS and uHTS based on label-free mass spectrometry.
In-Depth HTS Market Market Outlook
The HTS market is poised for continued growth driven by the factors mentioned above. Strategic partnerships and technological advancements will further accelerate market expansion. The development of novel applications in areas like personalized medicine and the expansion into emerging markets offer significant opportunities for market players. Focusing on providing integrated solutions, including advanced data analytics and user-friendly interfaces, will be crucial for success in this competitive landscape. The market is expected to see increased adoption of innovative technologies such as AI and ML for improved data analysis and drug discovery, further driving growth in the coming years.
HTS Market Segmentation
-
1. Technology
- 1.1. Ultra-high-throughput Screening
- 1.2. Cell-based Assays
- 1.3. Lab-on-a-chip
- 1.4. Label-free Technology
-
2. Applications
- 2.1. Target Identification
- 2.2. Primary Screening
- 2.3. Toxicology
-
3. Products and Services
- 3.1. Instruments
- 3.2. Reagents and Kits
-
4. End User
- 4.1. Pharmaceutical and Biotechnology Firms
- 4.2. Academia and Research Institutes
- 4.3. Contract Research Organizations
HTS Market Segmentation By Geography
-
1. North America
- 1.1. United States
- 1.2. Canada
- 1.3. Mexico
-
2. Europe
- 2.1. Germany
- 2.2. United Kingdom
- 2.3. France
- 2.4. Italy
- 2.5. Spain
- 2.6. Rest of Europe
-
3. Asia Pacific
- 3.1. China
- 3.2. Japan
- 3.3. India
- 3.4. Australia
- 3.5. South Korea
- 3.6. Rest of Asia Pacific
- 4. Middle East
-
5. GCC
- 5.1. South Africa
- 5.2. Rest of Middle East and Africa
-
6. South America
- 6.1. Brazil
- 6.2. Argentina
- 6.3. Rest of South America
HTS Market REPORT HIGHLIGHTS
| Aspects | Details |
|---|---|
| Study Period | 2019-2033 |
| Base Year | 2024 |
| Estimated Year | 2025 |
| Forecast Period | 2025-2033 |
| Historical Period | 2019-2024 |
| Growth Rate | CAGR of 7.80% from 2019-2033 |
| Segmentation |
|
Table of Contents
- 1. Introduction
- 1.1. Research Scope
- 1.2. Market Segmentation
- 1.3. Research Methodology
- 1.4. Definitions and Assumptions
- 2. Executive Summary
- 2.1. Introduction
- 3. Market Dynamics
- 3.1. Introduction
- 3.2. Market Drivers
- 3.2.1. Open Access to High-throughput Screening Laboratories; Technological Advancements in HTS; Increasing Usage in Universities and Research Centers
- 3.3. Market Restrains
- 3.3.1. High Capital Investment; Need for Extensive Automation Techniques
- 3.4. Market Trends
- 3.4.1. Pharmaceutical and Biotechnology Firms Segment Expects to Register a High CAGR Over the Forecast Period
- 4. Market Factor Analysis
- 4.1. Porters Five Forces
- 4.2. Supply/Value Chain
- 4.3. PESTEL analysis
- 4.4. Market Entropy
- 4.5. Patent/Trademark Analysis
- 5. Global HTS Market Analysis, Insights and Forecast, 2019-2031
- 5.1. Market Analysis, Insights and Forecast - by Technology
- 5.1.1. Ultra-high-throughput Screening
- 5.1.2. Cell-based Assays
- 5.1.3. Lab-on-a-chip
- 5.1.4. Label-free Technology
- 5.2. Market Analysis, Insights and Forecast - by Applications
- 5.2.1. Target Identification
- 5.2.2. Primary Screening
- 5.2.3. Toxicology
- 5.3. Market Analysis, Insights and Forecast - by Products and Services
- 5.3.1. Instruments
- 5.3.2. Reagents and Kits
- 5.4. Market Analysis, Insights and Forecast - by End User
- 5.4.1. Pharmaceutical and Biotechnology Firms
- 5.4.2. Academia and Research Institutes
- 5.4.3. Contract Research Organizations
- 5.5. Market Analysis, Insights and Forecast - by Region
- 5.5.1. North America
- 5.5.2. Europe
- 5.5.3. Asia Pacific
- 5.5.4. Middle East
- 5.5.5. GCC
- 5.5.6. South America
- 5.1. Market Analysis, Insights and Forecast - by Technology
- 6. North America HTS Market Analysis, Insights and Forecast, 2019-2031
- 6.1. Market Analysis, Insights and Forecast - by Technology
- 6.1.1. Ultra-high-throughput Screening
- 6.1.2. Cell-based Assays
- 6.1.3. Lab-on-a-chip
- 6.1.4. Label-free Technology
- 6.2. Market Analysis, Insights and Forecast - by Applications
- 6.2.1. Target Identification
- 6.2.2. Primary Screening
- 6.2.3. Toxicology
- 6.3. Market Analysis, Insights and Forecast - by Products and Services
- 6.3.1. Instruments
- 6.3.2. Reagents and Kits
- 6.4. Market Analysis, Insights and Forecast - by End User
- 6.4.1. Pharmaceutical and Biotechnology Firms
- 6.4.2. Academia and Research Institutes
- 6.4.3. Contract Research Organizations
- 6.1. Market Analysis, Insights and Forecast - by Technology
- 7. Europe HTS Market Analysis, Insights and Forecast, 2019-2031
- 7.1. Market Analysis, Insights and Forecast - by Technology
- 7.1.1. Ultra-high-throughput Screening
- 7.1.2. Cell-based Assays
- 7.1.3. Lab-on-a-chip
- 7.1.4. Label-free Technology
- 7.2. Market Analysis, Insights and Forecast - by Applications
- 7.2.1. Target Identification
- 7.2.2. Primary Screening
- 7.2.3. Toxicology
- 7.3. Market Analysis, Insights and Forecast - by Products and Services
- 7.3.1. Instruments
- 7.3.2. Reagents and Kits
- 7.4. Market Analysis, Insights and Forecast - by End User
- 7.4.1. Pharmaceutical and Biotechnology Firms
- 7.4.2. Academia and Research Institutes
- 7.4.3. Contract Research Organizations
- 7.1. Market Analysis, Insights and Forecast - by Technology
- 8. Asia Pacific HTS Market Analysis, Insights and Forecast, 2019-2031
- 8.1. Market Analysis, Insights and Forecast - by Technology
- 8.1.1. Ultra-high-throughput Screening
- 8.1.2. Cell-based Assays
- 8.1.3. Lab-on-a-chip
- 8.1.4. Label-free Technology
- 8.2. Market Analysis, Insights and Forecast - by Applications
- 8.2.1. Target Identification
- 8.2.2. Primary Screening
- 8.2.3. Toxicology
- 8.3. Market Analysis, Insights and Forecast - by Products and Services
- 8.3.1. Instruments
- 8.3.2. Reagents and Kits
- 8.4. Market Analysis, Insights and Forecast - by End User
- 8.4.1. Pharmaceutical and Biotechnology Firms
- 8.4.2. Academia and Research Institutes
- 8.4.3. Contract Research Organizations
- 8.1. Market Analysis, Insights and Forecast - by Technology
- 9. Middle East HTS Market Analysis, Insights and Forecast, 2019-2031
- 9.1. Market Analysis, Insights and Forecast - by Technology
- 9.1.1. Ultra-high-throughput Screening
- 9.1.2. Cell-based Assays
- 9.1.3. Lab-on-a-chip
- 9.1.4. Label-free Technology
- 9.2. Market Analysis, Insights and Forecast - by Applications
- 9.2.1. Target Identification
- 9.2.2. Primary Screening
- 9.2.3. Toxicology
- 9.3. Market Analysis, Insights and Forecast - by Products and Services
- 9.3.1. Instruments
- 9.3.2. Reagents and Kits
- 9.4. Market Analysis, Insights and Forecast - by End User
- 9.4.1. Pharmaceutical and Biotechnology Firms
- 9.4.2. Academia and Research Institutes
- 9.4.3. Contract Research Organizations
- 9.1. Market Analysis, Insights and Forecast - by Technology
- 10. GCC HTS Market Analysis, Insights and Forecast, 2019-2031
- 10.1. Market Analysis, Insights and Forecast - by Technology
- 10.1.1. Ultra-high-throughput Screening
- 10.1.2. Cell-based Assays
- 10.1.3. Lab-on-a-chip
- 10.1.4. Label-free Technology
- 10.2. Market Analysis, Insights and Forecast - by Applications
- 10.2.1. Target Identification
- 10.2.2. Primary Screening
- 10.2.3. Toxicology
- 10.3. Market Analysis, Insights and Forecast - by Products and Services
- 10.3.1. Instruments
- 10.3.2. Reagents and Kits
- 10.4. Market Analysis, Insights and Forecast - by End User
- 10.4.1. Pharmaceutical and Biotechnology Firms
- 10.4.2. Academia and Research Institutes
- 10.4.3. Contract Research Organizations
- 10.1. Market Analysis, Insights and Forecast - by Technology
- 11. South America HTS Market Analysis, Insights and Forecast, 2019-2031
- 11.1. Market Analysis, Insights and Forecast - by Technology
- 11.1.1. Ultra-high-throughput Screening
- 11.1.2. Cell-based Assays
- 11.1.3. Lab-on-a-chip
- 11.1.4. Label-free Technology
- 11.2. Market Analysis, Insights and Forecast - by Applications
- 11.2.1. Target Identification
- 11.2.2. Primary Screening
- 11.2.3. Toxicology
- 11.3. Market Analysis, Insights and Forecast - by Products and Services
- 11.3.1. Instruments
- 11.3.2. Reagents and Kits
- 11.4. Market Analysis, Insights and Forecast - by End User
- 11.4.1. Pharmaceutical and Biotechnology Firms
- 11.4.2. Academia and Research Institutes
- 11.4.3. Contract Research Organizations
- 11.1. Market Analysis, Insights and Forecast - by Technology
- 12. North America HTS Market Analysis, Insights and Forecast, 2019-2031
- 12.1. Market Analysis, Insights and Forecast - By Country/Sub-region
- 12.1.1 United States
- 12.1.2 Canada
- 12.1.3 Mexico
- 13. Europe HTS Market Analysis, Insights and Forecast, 2019-2031
- 13.1. Market Analysis, Insights and Forecast - By Country/Sub-region
- 13.1.1 Germany
- 13.1.2 United Kingdom
- 13.1.3 France
- 13.1.4 Italy
- 13.1.5 Spain
- 13.1.6 Rest of Europe
- 14. Asia Pacific HTS Market Analysis, Insights and Forecast, 2019-2031
- 14.1. Market Analysis, Insights and Forecast - By Country/Sub-region
- 14.1.1 China
- 14.1.2 Japan
- 14.1.3 India
- 14.1.4 Australia
- 14.1.5 South Korea
- 14.1.6 Rest of Asia Pacific
- 15. Middle East HTS Market Analysis, Insights and Forecast, 2019-2031
- 15.1. Market Analysis, Insights and Forecast - By Country/Sub-region
- 15.1.1. undefined
- 16. GCC HTS Market Analysis, Insights and Forecast, 2019-2031
- 16.1. Market Analysis, Insights and Forecast - By Country/Sub-region
- 16.1.1 South Africa
- 16.1.2 Rest of Middle East and Africa
- 17. South America HTS Market Analysis, Insights and Forecast, 2019-2031
- 17.1. Market Analysis, Insights and Forecast - By Country/Sub-region
- 17.1.1 Brazil
- 17.1.2 Argentina
- 17.1.3 Rest of South America
- 18. Competitive Analysis
- 18.1. Global Market Share Analysis 2024
- 18.2. Company Profiles
- 18.2.1 Beckman Coulter Inc
- 18.2.1.1. Overview
- 18.2.1.2. Products
- 18.2.1.3. SWOT Analysis
- 18.2.1.4. Recent Developments
- 18.2.1.5. Financials (Based on Availability)
- 18.2.2 Thermo Fisher Scientific Inc
- 18.2.2.1. Overview
- 18.2.2.2. Products
- 18.2.2.3. SWOT Analysis
- 18.2.2.4. Recent Developments
- 18.2.2.5. Financials (Based on Availability)
- 18.2.3 Tecan Group Ltd
- 18.2.3.1. Overview
- 18.2.3.2. Products
- 18.2.3.3. SWOT Analysis
- 18.2.3.4. Recent Developments
- 18.2.3.5. Financials (Based on Availability)
- 18.2.4 Bio-Rad Laboratories Inc
- 18.2.4.1. Overview
- 18.2.4.2. Products
- 18.2.4.3. SWOT Analysis
- 18.2.4.4. Recent Developments
- 18.2.4.5. Financials (Based on Availability)
- 18.2.5 Merck KGaA
- 18.2.5.1. Overview
- 18.2.5.2. Products
- 18.2.5.3. SWOT Analysis
- 18.2.5.4. Recent Developments
- 18.2.5.5. Financials (Based on Availability)
- 18.2.6 GE Healthcare
- 18.2.6.1. Overview
- 18.2.6.2. Products
- 18.2.6.3. SWOT Analysis
- 18.2.6.4. Recent Developments
- 18.2.6.5. Financials (Based on Availability)
- 18.2.7 Danaher Corporation
- 18.2.7.1. Overview
- 18.2.7.2. Products
- 18.2.7.3. SWOT Analysis
- 18.2.7.4. Recent Developments
- 18.2.7.5. Financials (Based on Availability)
- 18.2.8 Agilent Technologies Inc
- 18.2.8.1. Overview
- 18.2.8.2. Products
- 18.2.8.3. SWOT Analysis
- 18.2.8.4. Recent Developments
- 18.2.8.5. Financials (Based on Availability)
- 18.2.9 PerkinElmer Inc
- 18.2.9.1. Overview
- 18.2.9.2. Products
- 18.2.9.3. SWOT Analysis
- 18.2.9.4. Recent Developments
- 18.2.9.5. Financials (Based on Availability)
- 18.2.10 Axxam SpA
- 18.2.10.1. Overview
- 18.2.10.2. Products
- 18.2.10.3. SWOT Analysis
- 18.2.10.4. Recent Developments
- 18.2.10.5. Financials (Based on Availability)
- 18.2.1 Beckman Coulter Inc
List of Figures
- Figure 1: Global HTS Market Revenue Breakdown (Million, %) by Region 2024 & 2032
- Figure 2: Global HTS Market Volume Breakdown (K Unit, %) by Region 2024 & 2032
- Figure 3: North America HTS Market Revenue (Million), by Country 2024 & 2032
- Figure 4: North America HTS Market Volume (K Unit), by Country 2024 & 2032
- Figure 5: North America HTS Market Revenue Share (%), by Country 2024 & 2032
- Figure 6: North America HTS Market Volume Share (%), by Country 2024 & 2032
- Figure 7: Europe HTS Market Revenue (Million), by Country 2024 & 2032
- Figure 8: Europe HTS Market Volume (K Unit), by Country 2024 & 2032
- Figure 9: Europe HTS Market Revenue Share (%), by Country 2024 & 2032
- Figure 10: Europe HTS Market Volume Share (%), by Country 2024 & 2032
- Figure 11: Asia Pacific HTS Market Revenue (Million), by Country 2024 & 2032
- Figure 12: Asia Pacific HTS Market Volume (K Unit), by Country 2024 & 2032
- Figure 13: Asia Pacific HTS Market Revenue Share (%), by Country 2024 & 2032
- Figure 14: Asia Pacific HTS Market Volume Share (%), by Country 2024 & 2032
- Figure 15: Middle East HTS Market Revenue (Million), by Country 2024 & 2032
- Figure 16: Middle East HTS Market Volume (K Unit), by Country 2024 & 2032
- Figure 17: Middle East HTS Market Revenue Share (%), by Country 2024 & 2032
- Figure 18: Middle East HTS Market Volume Share (%), by Country 2024 & 2032
- Figure 19: GCC HTS Market Revenue (Million), by Country 2024 & 2032
- Figure 20: GCC HTS Market Volume (K Unit), by Country 2024 & 2032
- Figure 21: GCC HTS Market Revenue Share (%), by Country 2024 & 2032
- Figure 22: GCC HTS Market Volume Share (%), by Country 2024 & 2032
- Figure 23: South America HTS Market Revenue (Million), by Country 2024 & 2032
- Figure 24: South America HTS Market Volume (K Unit), by Country 2024 & 2032
- Figure 25: South America HTS Market Revenue Share (%), by Country 2024 & 2032
- Figure 26: South America HTS Market Volume Share (%), by Country 2024 & 2032
- Figure 27: North America HTS Market Revenue (Million), by Technology 2024 & 2032
- Figure 28: North America HTS Market Volume (K Unit), by Technology 2024 & 2032
- Figure 29: North America HTS Market Revenue Share (%), by Technology 2024 & 2032
- Figure 30: North America HTS Market Volume Share (%), by Technology 2024 & 2032
- Figure 31: North America HTS Market Revenue (Million), by Applications 2024 & 2032
- Figure 32: North America HTS Market Volume (K Unit), by Applications 2024 & 2032
- Figure 33: North America HTS Market Revenue Share (%), by Applications 2024 & 2032
- Figure 34: North America HTS Market Volume Share (%), by Applications 2024 & 2032
- Figure 35: North America HTS Market Revenue (Million), by Products and Services 2024 & 2032
- Figure 36: North America HTS Market Volume (K Unit), by Products and Services 2024 & 2032
- Figure 37: North America HTS Market Revenue Share (%), by Products and Services 2024 & 2032
- Figure 38: North America HTS Market Volume Share (%), by Products and Services 2024 & 2032
- Figure 39: North America HTS Market Revenue (Million), by End User 2024 & 2032
- Figure 40: North America HTS Market Volume (K Unit), by End User 2024 & 2032
- Figure 41: North America HTS Market Revenue Share (%), by End User 2024 & 2032
- Figure 42: North America HTS Market Volume Share (%), by End User 2024 & 2032
- Figure 43: North America HTS Market Revenue (Million), by Country 2024 & 2032
- Figure 44: North America HTS Market Volume (K Unit), by Country 2024 & 2032
- Figure 45: North America HTS Market Revenue Share (%), by Country 2024 & 2032
- Figure 46: North America HTS Market Volume Share (%), by Country 2024 & 2032
- Figure 47: Europe HTS Market Revenue (Million), by Technology 2024 & 2032
- Figure 48: Europe HTS Market Volume (K Unit), by Technology 2024 & 2032
- Figure 49: Europe HTS Market Revenue Share (%), by Technology 2024 & 2032
- Figure 50: Europe HTS Market Volume Share (%), by Technology 2024 & 2032
- Figure 51: Europe HTS Market Revenue (Million), by Applications 2024 & 2032
- Figure 52: Europe HTS Market Volume (K Unit), by Applications 2024 & 2032
- Figure 53: Europe HTS Market Revenue Share (%), by Applications 2024 & 2032
- Figure 54: Europe HTS Market Volume Share (%), by Applications 2024 & 2032
- Figure 55: Europe HTS Market Revenue (Million), by Products and Services 2024 & 2032
- Figure 56: Europe HTS Market Volume (K Unit), by Products and Services 2024 & 2032
- Figure 57: Europe HTS Market Revenue Share (%), by Products and Services 2024 & 2032
- Figure 58: Europe HTS Market Volume Share (%), by Products and Services 2024 & 2032
- Figure 59: Europe HTS Market Revenue (Million), by End User 2024 & 2032
- Figure 60: Europe HTS Market Volume (K Unit), by End User 2024 & 2032
- Figure 61: Europe HTS Market Revenue Share (%), by End User 2024 & 2032
- Figure 62: Europe HTS Market Volume Share (%), by End User 2024 & 2032
- Figure 63: Europe HTS Market Revenue (Million), by Country 2024 & 2032
- Figure 64: Europe HTS Market Volume (K Unit), by Country 2024 & 2032
- Figure 65: Europe HTS Market Revenue Share (%), by Country 2024 & 2032
- Figure 66: Europe HTS Market Volume Share (%), by Country 2024 & 2032
- Figure 67: Asia Pacific HTS Market Revenue (Million), by Technology 2024 & 2032
- Figure 68: Asia Pacific HTS Market Volume (K Unit), by Technology 2024 & 2032
- Figure 69: Asia Pacific HTS Market Revenue Share (%), by Technology 2024 & 2032
- Figure 70: Asia Pacific HTS Market Volume Share (%), by Technology 2024 & 2032
- Figure 71: Asia Pacific HTS Market Revenue (Million), by Applications 2024 & 2032
- Figure 72: Asia Pacific HTS Market Volume (K Unit), by Applications 2024 & 2032
- Figure 73: Asia Pacific HTS Market Revenue Share (%), by Applications 2024 & 2032
- Figure 74: Asia Pacific HTS Market Volume Share (%), by Applications 2024 & 2032
- Figure 75: Asia Pacific HTS Market Revenue (Million), by Products and Services 2024 & 2032
- Figure 76: Asia Pacific HTS Market Volume (K Unit), by Products and Services 2024 & 2032
- Figure 77: Asia Pacific HTS Market Revenue Share (%), by Products and Services 2024 & 2032
- Figure 78: Asia Pacific HTS Market Volume Share (%), by Products and Services 2024 & 2032
- Figure 79: Asia Pacific HTS Market Revenue (Million), by End User 2024 & 2032
- Figure 80: Asia Pacific HTS Market Volume (K Unit), by End User 2024 & 2032
- Figure 81: Asia Pacific HTS Market Revenue Share (%), by End User 2024 & 2032
- Figure 82: Asia Pacific HTS Market Volume Share (%), by End User 2024 & 2032
- Figure 83: Asia Pacific HTS Market Revenue (Million), by Country 2024 & 2032
- Figure 84: Asia Pacific HTS Market Volume (K Unit), by Country 2024 & 2032
- Figure 85: Asia Pacific HTS Market Revenue Share (%), by Country 2024 & 2032
- Figure 86: Asia Pacific HTS Market Volume Share (%), by Country 2024 & 2032
- Figure 87: Middle East HTS Market Revenue (Million), by Technology 2024 & 2032
- Figure 88: Middle East HTS Market Volume (K Unit), by Technology 2024 & 2032
- Figure 89: Middle East HTS Market Revenue Share (%), by Technology 2024 & 2032
- Figure 90: Middle East HTS Market Volume Share (%), by Technology 2024 & 2032
- Figure 91: Middle East HTS Market Revenue (Million), by Applications 2024 & 2032
- Figure 92: Middle East HTS Market Volume (K Unit), by Applications 2024 & 2032
- Figure 93: Middle East HTS Market Revenue Share (%), by Applications 2024 & 2032
- Figure 94: Middle East HTS Market Volume Share (%), by Applications 2024 & 2032
- Figure 95: Middle East HTS Market Revenue (Million), by Products and Services 2024 & 2032
- Figure 96: Middle East HTS Market Volume (K Unit), by Products and Services 2024 & 2032
- Figure 97: Middle East HTS Market Revenue Share (%), by Products and Services 2024 & 2032
- Figure 98: Middle East HTS Market Volume Share (%), by Products and Services 2024 & 2032
- Figure 99: Middle East HTS Market Revenue (Million), by End User 2024 & 2032
- Figure 100: Middle East HTS Market Volume (K Unit), by End User 2024 & 2032
- Figure 101: Middle East HTS Market Revenue Share (%), by End User 2024 & 2032
- Figure 102: Middle East HTS Market Volume Share (%), by End User 2024 & 2032
- Figure 103: Middle East HTS Market Revenue (Million), by Country 2024 & 2032
- Figure 104: Middle East HTS Market Volume (K Unit), by Country 2024 & 2032
- Figure 105: Middle East HTS Market Revenue Share (%), by Country 2024 & 2032
- Figure 106: Middle East HTS Market Volume Share (%), by Country 2024 & 2032
- Figure 107: GCC HTS Market Revenue (Million), by Technology 2024 & 2032
- Figure 108: GCC HTS Market Volume (K Unit), by Technology 2024 & 2032
- Figure 109: GCC HTS Market Revenue Share (%), by Technology 2024 & 2032
- Figure 110: GCC HTS Market Volume Share (%), by Technology 2024 & 2032
- Figure 111: GCC HTS Market Revenue (Million), by Applications 2024 & 2032
- Figure 112: GCC HTS Market Volume (K Unit), by Applications 2024 & 2032
- Figure 113: GCC HTS Market Revenue Share (%), by Applications 2024 & 2032
- Figure 114: GCC HTS Market Volume Share (%), by Applications 2024 & 2032
- Figure 115: GCC HTS Market Revenue (Million), by Products and Services 2024 & 2032
- Figure 116: GCC HTS Market Volume (K Unit), by Products and Services 2024 & 2032
- Figure 117: GCC HTS Market Revenue Share (%), by Products and Services 2024 & 2032
- Figure 118: GCC HTS Market Volume Share (%), by Products and Services 2024 & 2032
- Figure 119: GCC HTS Market Revenue (Million), by End User 2024 & 2032
- Figure 120: GCC HTS Market Volume (K Unit), by End User 2024 & 2032
- Figure 121: GCC HTS Market Revenue Share (%), by End User 2024 & 2032
- Figure 122: GCC HTS Market Volume Share (%), by End User 2024 & 2032
- Figure 123: GCC HTS Market Revenue (Million), by Country 2024 & 2032
- Figure 124: GCC HTS Market Volume (K Unit), by Country 2024 & 2032
- Figure 125: GCC HTS Market Revenue Share (%), by Country 2024 & 2032
- Figure 126: GCC HTS Market Volume Share (%), by Country 2024 & 2032
- Figure 127: South America HTS Market Revenue (Million), by Technology 2024 & 2032
- Figure 128: South America HTS Market Volume (K Unit), by Technology 2024 & 2032
- Figure 129: South America HTS Market Revenue Share (%), by Technology 2024 & 2032
- Figure 130: South America HTS Market Volume Share (%), by Technology 2024 & 2032
- Figure 131: South America HTS Market Revenue (Million), by Applications 2024 & 2032
- Figure 132: South America HTS Market Volume (K Unit), by Applications 2024 & 2032
- Figure 133: South America HTS Market Revenue Share (%), by Applications 2024 & 2032
- Figure 134: South America HTS Market Volume Share (%), by Applications 2024 & 2032
- Figure 135: South America HTS Market Revenue (Million), by Products and Services 2024 & 2032
- Figure 136: South America HTS Market Volume (K Unit), by Products and Services 2024 & 2032
- Figure 137: South America HTS Market Revenue Share (%), by Products and Services 2024 & 2032
- Figure 138: South America HTS Market Volume Share (%), by Products and Services 2024 & 2032
- Figure 139: South America HTS Market Revenue (Million), by End User 2024 & 2032
- Figure 140: South America HTS Market Volume (K Unit), by End User 2024 & 2032
- Figure 141: South America HTS Market Revenue Share (%), by End User 2024 & 2032
- Figure 142: South America HTS Market Volume Share (%), by End User 2024 & 2032
- Figure 143: South America HTS Market Revenue (Million), by Country 2024 & 2032
- Figure 144: South America HTS Market Volume (K Unit), by Country 2024 & 2032
- Figure 145: South America HTS Market Revenue Share (%), by Country 2024 & 2032
- Figure 146: South America HTS Market Volume Share (%), by Country 2024 & 2032
List of Tables
- Table 1: Global HTS Market Revenue Million Forecast, by Region 2019 & 2032
- Table 2: Global HTS Market Volume K Unit Forecast, by Region 2019 & 2032
- Table 3: Global HTS Market Revenue Million Forecast, by Technology 2019 & 2032
- Table 4: Global HTS Market Volume K Unit Forecast, by Technology 2019 & 2032
- Table 5: Global HTS Market Revenue Million Forecast, by Applications 2019 & 2032
- Table 6: Global HTS Market Volume K Unit Forecast, by Applications 2019 & 2032
- Table 7: Global HTS Market Revenue Million Forecast, by Products and Services 2019 & 2032
- Table 8: Global HTS Market Volume K Unit Forecast, by Products and Services 2019 & 2032
- Table 9: Global HTS Market Revenue Million Forecast, by End User 2019 & 2032
- Table 10: Global HTS Market Volume K Unit Forecast, by End User 2019 & 2032
- Table 11: Global HTS Market Revenue Million Forecast, by Region 2019 & 2032
- Table 12: Global HTS Market Volume K Unit Forecast, by Region 2019 & 2032
- Table 13: Global HTS Market Revenue Million Forecast, by Country 2019 & 2032
- Table 14: Global HTS Market Volume K Unit Forecast, by Country 2019 & 2032
- Table 15: United States HTS Market Revenue (Million) Forecast, by Application 2019 & 2032
- Table 16: United States HTS Market Volume (K Unit) Forecast, by Application 2019 & 2032
- Table 17: Canada HTS Market Revenue (Million) Forecast, by Application 2019 & 2032
- Table 18: Canada HTS Market Volume (K Unit) Forecast, by Application 2019 & 2032
- Table 19: Mexico HTS Market Revenue (Million) Forecast, by Application 2019 & 2032
- Table 20: Mexico HTS Market Volume (K Unit) Forecast, by Application 2019 & 2032
- Table 21: Global HTS Market Revenue Million Forecast, by Country 2019 & 2032
- Table 22: Global HTS Market Volume K Unit Forecast, by Country 2019 & 2032
- Table 23: Germany HTS Market Revenue (Million) Forecast, by Application 2019 & 2032
- Table 24: Germany HTS Market Volume (K Unit) Forecast, by Application 2019 & 2032
- Table 25: United Kingdom HTS Market Revenue (Million) Forecast, by Application 2019 & 2032
- Table 26: United Kingdom HTS Market Volume (K Unit) Forecast, by Application 2019 & 2032
- Table 27: France HTS Market Revenue (Million) Forecast, by Application 2019 & 2032
- Table 28: France HTS Market Volume (K Unit) Forecast, by Application 2019 & 2032
- Table 29: Italy HTS Market Revenue (Million) Forecast, by Application 2019 & 2032
- Table 30: Italy HTS Market Volume (K Unit) Forecast, by Application 2019 & 2032
- Table 31: Spain HTS Market Revenue (Million) Forecast, by Application 2019 & 2032
- Table 32: Spain HTS Market Volume (K Unit) Forecast, by Application 2019 & 2032
- Table 33: Rest of Europe HTS Market Revenue (Million) Forecast, by Application 2019 & 2032
- Table 34: Rest of Europe HTS Market Volume (K Unit) Forecast, by Application 2019 & 2032
- Table 35: Global HTS Market Revenue Million Forecast, by Country 2019 & 2032
- Table 36: Global HTS Market Volume K Unit Forecast, by Country 2019 & 2032
- Table 37: China HTS Market Revenue (Million) Forecast, by Application 2019 & 2032
- Table 38: China HTS Market Volume (K Unit) Forecast, by Application 2019 & 2032
- Table 39: Japan HTS Market Revenue (Million) Forecast, by Application 2019 & 2032
- Table 40: Japan HTS Market Volume (K Unit) Forecast, by Application 2019 & 2032
- Table 41: India HTS Market Revenue (Million) Forecast, by Application 2019 & 2032
- Table 42: India HTS Market Volume (K Unit) Forecast, by Application 2019 & 2032
- Table 43: Australia HTS Market Revenue (Million) Forecast, by Application 2019 & 2032
- Table 44: Australia HTS Market Volume (K Unit) Forecast, by Application 2019 & 2032
- Table 45: South Korea HTS Market Revenue (Million) Forecast, by Application 2019 & 2032
- Table 46: South Korea HTS Market Volume (K Unit) Forecast, by Application 2019 & 2032
- Table 47: Rest of Asia Pacific HTS Market Revenue (Million) Forecast, by Application 2019 & 2032
- Table 48: Rest of Asia Pacific HTS Market Volume (K Unit) Forecast, by Application 2019 & 2032
- Table 49: Global HTS Market Revenue Million Forecast, by Country 2019 & 2032
- Table 50: Global HTS Market Volume K Unit Forecast, by Country 2019 & 2032
- Table 51: Global HTS Market Revenue Million Forecast, by Country 2019 & 2032
- Table 52: Global HTS Market Volume K Unit Forecast, by Country 2019 & 2032
- Table 53: South Africa HTS Market Revenue (Million) Forecast, by Application 2019 & 2032
- Table 54: South Africa HTS Market Volume (K Unit) Forecast, by Application 2019 & 2032
- Table 55: Rest of Middle East and Africa HTS Market Revenue (Million) Forecast, by Application 2019 & 2032
- Table 56: Rest of Middle East and Africa HTS Market Volume (K Unit) Forecast, by Application 2019 & 2032
- Table 57: Global HTS Market Revenue Million Forecast, by Country 2019 & 2032
- Table 58: Global HTS Market Volume K Unit Forecast, by Country 2019 & 2032
- Table 59: Brazil HTS Market Revenue (Million) Forecast, by Application 2019 & 2032
- Table 60: Brazil HTS Market Volume (K Unit) Forecast, by Application 2019 & 2032
- Table 61: Argentina HTS Market Revenue (Million) Forecast, by Application 2019 & 2032
- Table 62: Argentina HTS Market Volume (K Unit) Forecast, by Application 2019 & 2032
- Table 63: Rest of South America HTS Market Revenue (Million) Forecast, by Application 2019 & 2032
- Table 64: Rest of South America HTS Market Volume (K Unit) Forecast, by Application 2019 & 2032
- Table 65: Global HTS Market Revenue Million Forecast, by Technology 2019 & 2032
- Table 66: Global HTS Market Volume K Unit Forecast, by Technology 2019 & 2032
- Table 67: Global HTS Market Revenue Million Forecast, by Applications 2019 & 2032
- Table 68: Global HTS Market Volume K Unit Forecast, by Applications 2019 & 2032
- Table 69: Global HTS Market Revenue Million Forecast, by Products and Services 2019 & 2032
- Table 70: Global HTS Market Volume K Unit Forecast, by Products and Services 2019 & 2032
- Table 71: Global HTS Market Revenue Million Forecast, by End User 2019 & 2032
- Table 72: Global HTS Market Volume K Unit Forecast, by End User 2019 & 2032
- Table 73: Global HTS Market Revenue Million Forecast, by Country 2019 & 2032
- Table 74: Global HTS Market Volume K Unit Forecast, by Country 2019 & 2032
- Table 75: United States HTS Market Revenue (Million) Forecast, by Application 2019 & 2032
- Table 76: United States HTS Market Volume (K Unit) Forecast, by Application 2019 & 2032
- Table 77: Canada HTS Market Revenue (Million) Forecast, by Application 2019 & 2032
- Table 78: Canada HTS Market Volume (K Unit) Forecast, by Application 2019 & 2032
- Table 79: Mexico HTS Market Revenue (Million) Forecast, by Application 2019 & 2032
- Table 80: Mexico HTS Market Volume (K Unit) Forecast, by Application 2019 & 2032
- Table 81: Global HTS Market Revenue Million Forecast, by Technology 2019 & 2032
- Table 82: Global HTS Market Volume K Unit Forecast, by Technology 2019 & 2032
- Table 83: Global HTS Market Revenue Million Forecast, by Applications 2019 & 2032
- Table 84: Global HTS Market Volume K Unit Forecast, by Applications 2019 & 2032
- Table 85: Global HTS Market Revenue Million Forecast, by Products and Services 2019 & 2032
- Table 86: Global HTS Market Volume K Unit Forecast, by Products and Services 2019 & 2032
- Table 87: Global HTS Market Revenue Million Forecast, by End User 2019 & 2032
- Table 88: Global HTS Market Volume K Unit Forecast, by End User 2019 & 2032
- Table 89: Global HTS Market Revenue Million Forecast, by Country 2019 & 2032
- Table 90: Global HTS Market Volume K Unit Forecast, by Country 2019 & 2032
- Table 91: Germany HTS Market Revenue (Million) Forecast, by Application 2019 & 2032
- Table 92: Germany HTS Market Volume (K Unit) Forecast, by Application 2019 & 2032
- Table 93: United Kingdom HTS Market Revenue (Million) Forecast, by Application 2019 & 2032
- Table 94: United Kingdom HTS Market Volume (K Unit) Forecast, by Application 2019 & 2032
- Table 95: France HTS Market Revenue (Million) Forecast, by Application 2019 & 2032
- Table 96: France HTS Market Volume (K Unit) Forecast, by Application 2019 & 2032
- Table 97: Italy HTS Market Revenue (Million) Forecast, by Application 2019 & 2032
- Table 98: Italy HTS Market Volume (K Unit) Forecast, by Application 2019 & 2032
- Table 99: Spain HTS Market Revenue (Million) Forecast, by Application 2019 & 2032
- Table 100: Spain HTS Market Volume (K Unit) Forecast, by Application 2019 & 2032
- Table 101: Rest of Europe HTS Market Revenue (Million) Forecast, by Application 2019 & 2032
- Table 102: Rest of Europe HTS Market Volume (K Unit) Forecast, by Application 2019 & 2032
- Table 103: Global HTS Market Revenue Million Forecast, by Technology 2019 & 2032
- Table 104: Global HTS Market Volume K Unit Forecast, by Technology 2019 & 2032
- Table 105: Global HTS Market Revenue Million Forecast, by Applications 2019 & 2032
- Table 106: Global HTS Market Volume K Unit Forecast, by Applications 2019 & 2032
- Table 107: Global HTS Market Revenue Million Forecast, by Products and Services 2019 & 2032
- Table 108: Global HTS Market Volume K Unit Forecast, by Products and Services 2019 & 2032
- Table 109: Global HTS Market Revenue Million Forecast, by End User 2019 & 2032
- Table 110: Global HTS Market Volume K Unit Forecast, by End User 2019 & 2032
- Table 111: Global HTS Market Revenue Million Forecast, by Country 2019 & 2032
- Table 112: Global HTS Market Volume K Unit Forecast, by Country 2019 & 2032
- Table 113: China HTS Market Revenue (Million) Forecast, by Application 2019 & 2032
- Table 114: China HTS Market Volume (K Unit) Forecast, by Application 2019 & 2032
- Table 115: Japan HTS Market Revenue (Million) Forecast, by Application 2019 & 2032
- Table 116: Japan HTS Market Volume (K Unit) Forecast, by Application 2019 & 2032
- Table 117: India HTS Market Revenue (Million) Forecast, by Application 2019 & 2032
- Table 118: India HTS Market Volume (K Unit) Forecast, by Application 2019 & 2032
- Table 119: Australia HTS Market Revenue (Million) Forecast, by Application 2019 & 2032
- Table 120: Australia HTS Market Volume (K Unit) Forecast, by Application 2019 & 2032
- Table 121: South Korea HTS Market Revenue (Million) Forecast, by Application 2019 & 2032
- Table 122: South Korea HTS Market Volume (K Unit) Forecast, by Application 2019 & 2032
- Table 123: Rest of Asia Pacific HTS Market Revenue (Million) Forecast, by Application 2019 & 2032
- Table 124: Rest of Asia Pacific HTS Market Volume (K Unit) Forecast, by Application 2019 & 2032
- Table 125: Global HTS Market Revenue Million Forecast, by Technology 2019 & 2032
- Table 126: Global HTS Market Volume K Unit Forecast, by Technology 2019 & 2032
- Table 127: Global HTS Market Revenue Million Forecast, by Applications 2019 & 2032
- Table 128: Global HTS Market Volume K Unit Forecast, by Applications 2019 & 2032
- Table 129: Global HTS Market Revenue Million Forecast, by Products and Services 2019 & 2032
- Table 130: Global HTS Market Volume K Unit Forecast, by Products and Services 2019 & 2032
- Table 131: Global HTS Market Revenue Million Forecast, by End User 2019 & 2032
- Table 132: Global HTS Market Volume K Unit Forecast, by End User 2019 & 2032
- Table 133: Global HTS Market Revenue Million Forecast, by Country 2019 & 2032
- Table 134: Global HTS Market Volume K Unit Forecast, by Country 2019 & 2032
- Table 135: Global HTS Market Revenue Million Forecast, by Technology 2019 & 2032
- Table 136: Global HTS Market Volume K Unit Forecast, by Technology 2019 & 2032
- Table 137: Global HTS Market Revenue Million Forecast, by Applications 2019 & 2032
- Table 138: Global HTS Market Volume K Unit Forecast, by Applications 2019 & 2032
- Table 139: Global HTS Market Revenue Million Forecast, by Products and Services 2019 & 2032
- Table 140: Global HTS Market Volume K Unit Forecast, by Products and Services 2019 & 2032
- Table 141: Global HTS Market Revenue Million Forecast, by End User 2019 & 2032
- Table 142: Global HTS Market Volume K Unit Forecast, by End User 2019 & 2032
- Table 143: Global HTS Market Revenue Million Forecast, by Country 2019 & 2032
- Table 144: Global HTS Market Volume K Unit Forecast, by Country 2019 & 2032
- Table 145: South Africa HTS Market Revenue (Million) Forecast, by Application 2019 & 2032
- Table 146: South Africa HTS Market Volume (K Unit) Forecast, by Application 2019 & 2032
- Table 147: Rest of Middle East and Africa HTS Market Revenue (Million) Forecast, by Application 2019 & 2032
- Table 148: Rest of Middle East and Africa HTS Market Volume (K Unit) Forecast, by Application 2019 & 2032
- Table 149: Global HTS Market Revenue Million Forecast, by Technology 2019 & 2032
- Table 150: Global HTS Market Volume K Unit Forecast, by Technology 2019 & 2032
- Table 151: Global HTS Market Revenue Million Forecast, by Applications 2019 & 2032
- Table 152: Global HTS Market Volume K Unit Forecast, by Applications 2019 & 2032
- Table 153: Global HTS Market Revenue Million Forecast, by Products and Services 2019 & 2032
- Table 154: Global HTS Market Volume K Unit Forecast, by Products and Services 2019 & 2032
- Table 155: Global HTS Market Revenue Million Forecast, by End User 2019 & 2032
- Table 156: Global HTS Market Volume K Unit Forecast, by End User 2019 & 2032
- Table 157: Global HTS Market Revenue Million Forecast, by Country 2019 & 2032
- Table 158: Global HTS Market Volume K Unit Forecast, by Country 2019 & 2032
- Table 159: Brazil HTS Market Revenue (Million) Forecast, by Application 2019 & 2032
- Table 160: Brazil HTS Market Volume (K Unit) Forecast, by Application 2019 & 2032
- Table 161: Argentina HTS Market Revenue (Million) Forecast, by Application 2019 & 2032
- Table 162: Argentina HTS Market Volume (K Unit) Forecast, by Application 2019 & 2032
- Table 163: Rest of South America HTS Market Revenue (Million) Forecast, by Application 2019 & 2032
- Table 164: Rest of South America HTS Market Volume (K Unit) Forecast, by Application 2019 & 2032
Frequently Asked Questions
1. What is the projected Compound Annual Growth Rate (CAGR) of the HTS Market?
The projected CAGR is approximately 7.80%.
2. Which companies are prominent players in the HTS Market?
Key companies in the market include Beckman Coulter Inc, Thermo Fisher Scientific Inc , Tecan Group Ltd, Bio-Rad Laboratories Inc, Merck KGaA, GE Healthcare, Danaher Corporation, Agilent Technologies Inc, PerkinElmer Inc, Axxam SpA.
3. What are the main segments of the HTS Market?
The market segments include Technology, Applications, Products and Services, End User.
4. Can you provide details about the market size?
The market size is estimated to be USD XX Million as of 2022.
5. What are some drivers contributing to market growth?
Open Access to High-throughput Screening Laboratories; Technological Advancements in HTS; Increasing Usage in Universities and Research Centers.
6. What are the notable trends driving market growth?
Pharmaceutical and Biotechnology Firms Segment Expects to Register a High CAGR Over the Forecast Period.
7. Are there any restraints impacting market growth?
High Capital Investment; Need for Extensive Automation Techniques.
8. Can you provide examples of recent developments in the market?
In August 2022, Molbio Diagnostics launched a new test for differential diagnosis of HIV 1 and HIV 2 with viral loads within 60 minutes.
9. What pricing options are available for accessing the report?
Pricing options include single-user, multi-user, and enterprise licenses priced at USD 4750, USD 5250, and USD 8750 respectively.
10. Is the market size provided in terms of value or volume?
The market size is provided in terms of value, measured in Million and volume, measured in K Unit.
11. Are there any specific market keywords associated with the report?
Yes, the market keyword associated with the report is "HTS Market," which aids in identifying and referencing the specific market segment covered.
12. How do I determine which pricing option suits my needs best?
The pricing options vary based on user requirements and access needs. Individual users may opt for single-user licenses, while businesses requiring broader access may choose multi-user or enterprise licenses for cost-effective access to the report.
13. Are there any additional resources or data provided in the HTS Market report?
While the report offers comprehensive insights, it's advisable to review the specific contents or supplementary materials provided to ascertain if additional resources or data are available.
14. How can I stay updated on further developments or reports in the HTS Market?
To stay informed about further developments, trends, and reports in the HTS Market, consider subscribing to industry newsletters, following relevant companies and organizations, or regularly checking reputable industry news sources and publications.
Methodology
Step 1 - Identification of Relevant Samples Size from Population Database


Step 2 - Approaches for Defining Global Market Size (Value, Volume* & Price*)

Note*: In applicable scenarios
Step 3 - Data Sources
Primary Research
- Web Analytics
- Survey Reports
- Research Institute
- Latest Research Reports
- Opinion Leaders
Secondary Research
- Annual Reports
- White Paper
- Latest Press Release
- Industry Association
- Paid Database
- Investor Presentations

Step 4 - Data Triangulation
Involves using different sources of information in order to increase the validity of a study
These sources are likely to be stakeholders in a program - participants, other researchers, program staff, other community members, and so on.
Then we put all data in single framework & apply various statistical tools to find out the dynamic on the market.
During the analysis stage, feedback from the stakeholder groups would be compared to determine areas of agreement as well as areas of divergence


