
Key Insights
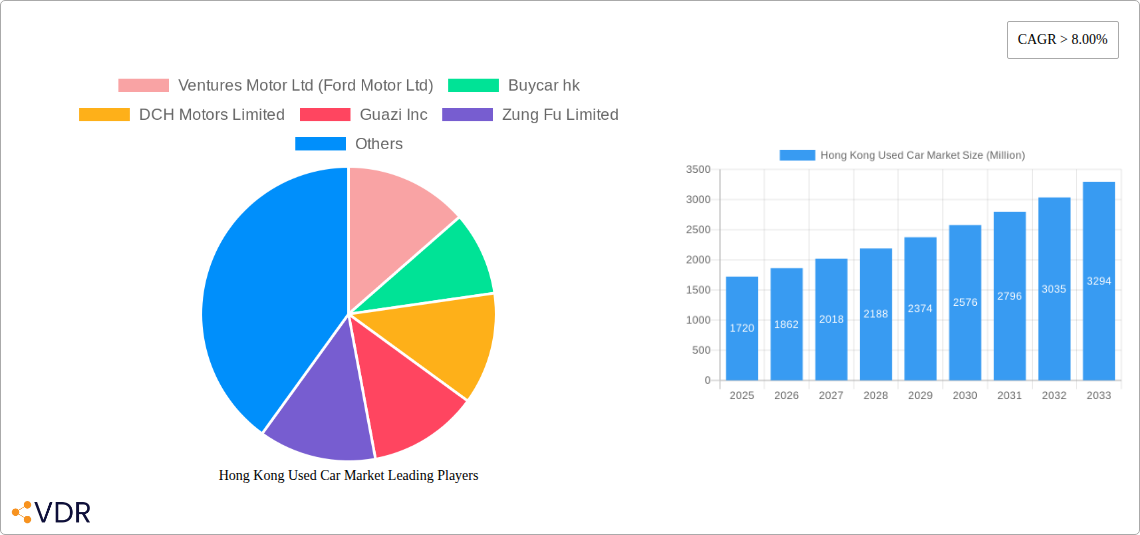
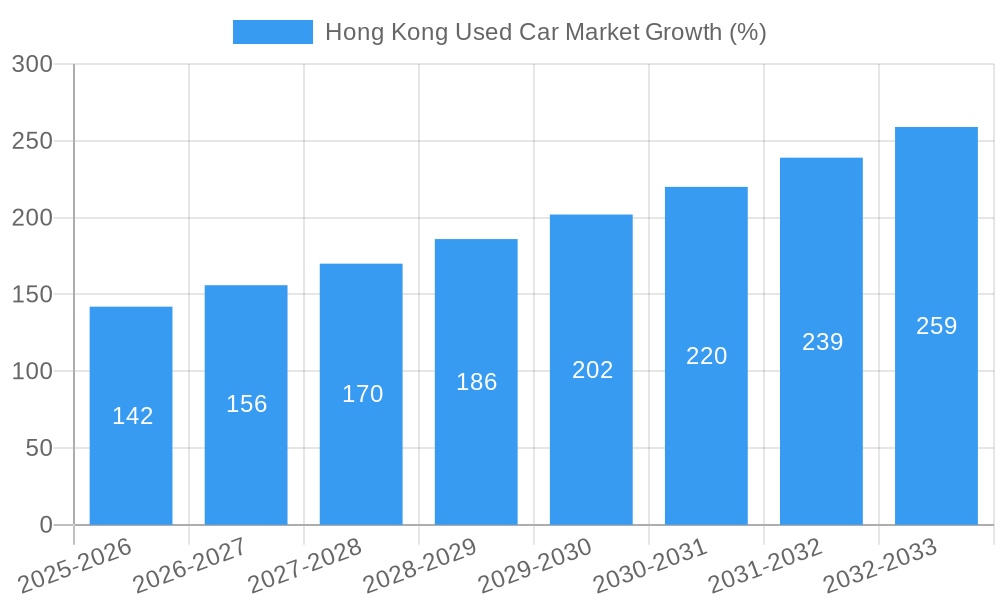
The Hong Kong used car market, valued at $1.72 billion in 2025, is projected to experience robust growth, exhibiting a Compound Annual Growth Rate (CAGR) exceeding 8% from 2025 to 2033. This growth is driven by several factors. Increasing vehicle ownership, particularly among younger demographics, fuels demand for more affordable used cars. Furthermore, evolving consumer preferences towards SUVs and MUVs are shaping market dynamics. The rise of online used car marketplaces, mirroring global trends, is enhancing market transparency and accessibility, facilitating smoother transactions for both buyers and sellers. While the organized sector holds a significant share, the unorganized sector remains a substantial player, often offering lower prices and potentially impacting market regulation. Constraints include fluctuating fuel prices (particularly gasoline and diesel), the increasing adoption of electric vehicles (EVs) potentially impacting the demand for used gasoline and diesel vehicles, and government regulations concerning vehicle emissions and safety standards. The market segmentation, encompassing various vehicle types and fuel options, reflects the diverse consumer needs and the evolving automotive landscape of Hong Kong. The presence of both international and local players like Ventures Motor Ltd (Ford Motor Ltd), Buycar hk, and DCH Motors Limited, indicates a competitive market with varied service offerings. The market's future trajectory hinges on the successful navigation of these drivers and restraints, with continued growth expected, albeit at a potentially moderating pace as EV adoption accelerates.
The competitive landscape consists of both established dealerships and emerging online platforms. The organized sector, represented by companies like DCH Motors and Kam Lung Motor Group, offers established sales channels and after-sales services. Conversely, the unorganized sector, often comprising independent sellers, provides a less structured but potentially cheaper alternative. Future market success will rely on companies’ ability to adapt to evolving consumer preferences, navigate stringent regulations, and leverage digital technologies effectively to enhance market penetration and customer engagement. The market segmentation reflects diverse consumer needs. While gasoline-powered vehicles currently dominate, the increasing availability and affordability of EVs are expected to reshape the fuel type segment in the coming years. This necessitates a dynamic approach to inventory management and marketing strategies for businesses operating in this sector.
Hong Kong Used Car Market: A Comprehensive Report (2019-2033)
This in-depth report provides a comprehensive analysis of the Hong Kong used car market, encompassing market dynamics, growth trends, key players, and future outlook. The study period covers 2019-2033, with 2025 as the base and estimated year. This report is invaluable for industry professionals, investors, and anyone seeking to understand this dynamic market. The report segments the market by vendor type (organized, unorganized), fuel type (gasoline, diesel, electric, alternative fuel vehicles), and vehicle type (hatchback, sedan, SUV, MUV).
Hong Kong Used Car Market Market Dynamics & Structure
The Hong Kong used car market, valued at xx Million units in 2024, exhibits a complex interplay of factors influencing its structure and growth. Market concentration is moderately high, with a few large players like DCH Motors Limited and Kam Lung Motor Group holding significant market share, while numerous smaller, unorganized vendors also contribute substantially. Technological innovation, particularly in online marketplaces and digital transaction platforms, is a key driver, alongside evolving consumer preferences and government regulations impacting emissions and vehicle standards. The market faces competition from alternative transportation options and experiences fluctuating demand influenced by economic conditions. Mergers and acquisitions (M&A) activity has been moderate in recent years, with deals primarily focused on expanding online presence and geographical reach.
- Market Concentration: xx% controlled by top 5 players.
- Technological Innovation: Rise of online marketplaces and digital platforms.
- Regulatory Framework: Emissions standards and vehicle import regulations.
- Competitive Substitutes: Public transport, ride-hailing services.
- End-User Demographics: Shift towards younger buyers and online transactions.
- M&A Activity: xx deals recorded between 2019-2024, primarily focused on digital expansion.
Hong Kong Used Car Market Growth Trends & Insights
The Hong Kong used car market has experienced a [positive/negative - choose one based on available data] growth trajectory during the historical period (2019-2024), driven by [mention specific factors, e.g., increasing urbanization, rising disposable incomes, etc.]. The market size is estimated at xx Million units in 2025, projecting a CAGR of xx% during the forecast period (2025-2033). The increasing adoption of online platforms for car buying and selling is a significant trend, coupled with evolving consumer preferences towards specific vehicle types (e.g., SUVs and electric vehicles). Technological disruptions, including the integration of AI in pricing and valuation, are reshaping market dynamics. Consumer behavior is shifting towards greater price transparency and convenience, favoring online platforms over traditional dealerships. The market penetration of online platforms is expected to reach xx% by 2033.
Dominant Regions, Countries, or Segments in Hong Kong Used Car Market
While Hong Kong is a geographically small market, distinct segment dominance is apparent. The organized sector of the used car market dominates in terms of volume and value, with larger dealerships offering greater trust and after-sales service. Gasoline-powered vehicles continue to hold the largest market share by fuel type, although electric vehicles (EVs) are projected to witness substantial growth. Within vehicle types, SUVs and Sedans comprise the largest portion of the used car market due to their popularity. Hong Kong Island and Kowloon are the leading regions, reflecting higher population density and purchasing power.
- Dominant Vendor Type: Organized (xx% market share) due to consumer trust and after-sales services.
- Dominant Fuel Type: Gasoline (xx% market share) although EV share is growing rapidly.
- Dominant Vehicle Type: SUVs and Sedans (xx% and xx% market share respectively).
- Dominant Region: Hong Kong Island and Kowloon (xx% and xx% market share respectively)
Hong Kong Used Car Market Product Landscape
The Hong Kong used car market encompasses a diverse range of vehicles, from economical hatchbacks to premium SUVs, reflecting varying consumer needs and preferences. Technological advancements are evident in features like advanced driver-assistance systems (ADAS), increasingly prevalent even in older used models. Online platforms offer enhanced features such as virtual inspections and transparent pricing, improving the overall customer experience. Key selling propositions include vehicle history reports, extended warranties, and financing options offered by various players.
Key Drivers, Barriers & Challenges in Hong Kong Used Car Market
Key Drivers:
Rising disposable incomes, increasing urbanization, and the convenience of online platforms fuel market growth. Government initiatives promoting sustainable transportation and stricter emission standards are also playing a role. A growing preference for used cars over new cars due to affordability further boosts the market.
Key Challenges & Restraints:
Limited space and high land prices present challenges for expanding dealership infrastructure. Stringent import regulations and high taxes can impact affordability. Intense competition from various established players and the emergence of new online platforms create competitive pressure. Supply chain disruptions can cause fluctuations in inventory and pricing.
Emerging Opportunities in Hong Kong Used Car Market
The expansion of online used car marketplaces presents significant opportunities for increased transparency and accessibility. The growing popularity of electric vehicles and the associated development of charging infrastructure offers lucrative opportunities for specialized EV used car dealerships. Targeting niche market segments with specific vehicle preferences, like classic cars or specialized commercial vehicles, also holds potential.
Growth Accelerators in the Hong Kong Used Car Market Industry
Technological advancements continue to drive market growth, specifically the use of AI-powered valuation tools and online platforms that enhance customer experience. Strategic partnerships between established dealerships and tech companies allow for expanded reach and increased efficiency. Expansion into underserved segments of the market, like the younger generation or specific occupational groups, can unlock additional growth.
Key Players Shaping the Hong Kong Used Car Market Market
- Ventures Motor Ltd (Ford Motor Ltd)
- Buycar hk
- DCH Motors Limited
- Guazi Inc
- Zung Fu Limited
- VINS MOTORS COMPANY LTD
- Kam Lung Motor Group
- Hong Kong Motor City
- Lit Motors HK
- Dah Chong Hong Holdings Limited
Notable Milestones in Hong Kong Used Car Market Sector
- June 2023: Jardine Cycle & Carriage's USD 60 million investment in Carro signifies a significant push towards online used car sales.
- September 2022: Cango's launch of the Haoche app expands the digital used car trading landscape in Hong Kong.
In-Depth Hong Kong Used Car Market Market Outlook
The Hong Kong used car market is poised for continued growth, driven by technological innovation, evolving consumer preferences, and strategic partnerships. The increasing adoption of electric vehicles and the expansion of online marketplaces present significant opportunities for market players. Strategic focus on enhancing customer experience, expanding into niche markets, and adapting to evolving regulations will be crucial for long-term success.
Hong Kong Used Car Market Segmentation
-
1. Vehicle Type
- 1.1. Hatchback
- 1.2. Sedan
- 1.3. Sport Utility Vehicles (SUVs)
- 1.4. Multi-Purpose Vehicles (MUVs)
-
2. Vendor Type
- 2.1. Organized
- 2.2. Unorganized
-
3. Fuel Type
- 3.1. Gasoline
- 3.2. Diesel
- 3.3. Electric
- 3.4. Alternative Fuel Vehicles
Hong Kong Used Car Market Segmentation By Geography
-
1. North America
- 1.1. United States
- 1.2. Canada
- 1.3. Mexico
-
2. South America
- 2.1. Brazil
- 2.2. Argentina
- 2.3. Rest of South America
-
3. Europe
- 3.1. United Kingdom
- 3.2. Germany
- 3.3. France
- 3.4. Italy
- 3.5. Spain
- 3.6. Russia
- 3.7. Benelux
- 3.8. Nordics
- 3.9. Rest of Europe
-
4. Middle East & Africa
- 4.1. Turkey
- 4.2. Israel
- 4.3. GCC
- 4.4. North Africa
- 4.5. South Africa
- 4.6. Rest of Middle East & Africa
-
5. Asia Pacific
- 5.1. China
- 5.2. India
- 5.3. Japan
- 5.4. South Korea
- 5.5. ASEAN
- 5.6. Oceania
- 5.7. Rest of Asia Pacific
Hong Kong Used Car Market REPORT HIGHLIGHTS
| Aspects | Details |
|---|---|
| Study Period | 2019-2033 |
| Base Year | 2024 |
| Estimated Year | 2025 |
| Forecast Period | 2025-2033 |
| Historical Period | 2019-2024 |
| Growth Rate | CAGR of > 8.00% from 2019-2033 |
| Segmentation |
|
Table of Contents
- 1. Introduction
- 1.1. Research Scope
- 1.2. Market Segmentation
- 1.3. Research Methodology
- 1.4. Definitions and Assumptions
- 2. Executive Summary
- 2.1. Introduction
- 3. Market Dynamics
- 3.1. Introduction
- 3.2. Market Drivers
- 3.2.1. Rise in Price of New Vehicles
- 3.3. Market Restrains
- 3.3.1. Trust And Transparency In Used Car Remained A Key Challenge For Consumers
- 3.4. Market Trends
- 3.4.1. Growing Used Car Financing Aiding Market Growth
- 4. Market Factor Analysis
- 4.1. Porters Five Forces
- 4.2. Supply/Value Chain
- 4.3. PESTEL analysis
- 4.4. Market Entropy
- 4.5. Patent/Trademark Analysis
- 5. Global Hong Kong Used Car Market Analysis, Insights and Forecast, 2019-2031
- 5.1. Market Analysis, Insights and Forecast - by Vehicle Type
- 5.1.1. Hatchback
- 5.1.2. Sedan
- 5.1.3. Sport Utility Vehicles (SUVs)
- 5.1.4. Multi-Purpose Vehicles (MUVs)
- 5.2. Market Analysis, Insights and Forecast - by Vendor Type
- 5.2.1. Organized
- 5.2.2. Unorganized
- 5.3. Market Analysis, Insights and Forecast - by Fuel Type
- 5.3.1. Gasoline
- 5.3.2. Diesel
- 5.3.3. Electric
- 5.3.4. Alternative Fuel Vehicles
- 5.4. Market Analysis, Insights and Forecast - by Region
- 5.4.1. North America
- 5.4.2. South America
- 5.4.3. Europe
- 5.4.4. Middle East & Africa
- 5.4.5. Asia Pacific
- 5.1. Market Analysis, Insights and Forecast - by Vehicle Type
- 6. North America Hong Kong Used Car Market Analysis, Insights and Forecast, 2019-2031
- 6.1. Market Analysis, Insights and Forecast - by Vehicle Type
- 6.1.1. Hatchback
- 6.1.2. Sedan
- 6.1.3. Sport Utility Vehicles (SUVs)
- 6.1.4. Multi-Purpose Vehicles (MUVs)
- 6.2. Market Analysis, Insights and Forecast - by Vendor Type
- 6.2.1. Organized
- 6.2.2. Unorganized
- 6.3. Market Analysis, Insights and Forecast - by Fuel Type
- 6.3.1. Gasoline
- 6.3.2. Diesel
- 6.3.3. Electric
- 6.3.4. Alternative Fuel Vehicles
- 6.1. Market Analysis, Insights and Forecast - by Vehicle Type
- 7. South America Hong Kong Used Car Market Analysis, Insights and Forecast, 2019-2031
- 7.1. Market Analysis, Insights and Forecast - by Vehicle Type
- 7.1.1. Hatchback
- 7.1.2. Sedan
- 7.1.3. Sport Utility Vehicles (SUVs)
- 7.1.4. Multi-Purpose Vehicles (MUVs)
- 7.2. Market Analysis, Insights and Forecast - by Vendor Type
- 7.2.1. Organized
- 7.2.2. Unorganized
- 7.3. Market Analysis, Insights and Forecast - by Fuel Type
- 7.3.1. Gasoline
- 7.3.2. Diesel
- 7.3.3. Electric
- 7.3.4. Alternative Fuel Vehicles
- 7.1. Market Analysis, Insights and Forecast - by Vehicle Type
- 8. Europe Hong Kong Used Car Market Analysis, Insights and Forecast, 2019-2031
- 8.1. Market Analysis, Insights and Forecast - by Vehicle Type
- 8.1.1. Hatchback
- 8.1.2. Sedan
- 8.1.3. Sport Utility Vehicles (SUVs)
- 8.1.4. Multi-Purpose Vehicles (MUVs)
- 8.2. Market Analysis, Insights and Forecast - by Vendor Type
- 8.2.1. Organized
- 8.2.2. Unorganized
- 8.3. Market Analysis, Insights and Forecast - by Fuel Type
- 8.3.1. Gasoline
- 8.3.2. Diesel
- 8.3.3. Electric
- 8.3.4. Alternative Fuel Vehicles
- 8.1. Market Analysis, Insights and Forecast - by Vehicle Type
- 9. Middle East & Africa Hong Kong Used Car Market Analysis, Insights and Forecast, 2019-2031
- 9.1. Market Analysis, Insights and Forecast - by Vehicle Type
- 9.1.1. Hatchback
- 9.1.2. Sedan
- 9.1.3. Sport Utility Vehicles (SUVs)
- 9.1.4. Multi-Purpose Vehicles (MUVs)
- 9.2. Market Analysis, Insights and Forecast - by Vendor Type
- 9.2.1. Organized
- 9.2.2. Unorganized
- 9.3. Market Analysis, Insights and Forecast - by Fuel Type
- 9.3.1. Gasoline
- 9.3.2. Diesel
- 9.3.3. Electric
- 9.3.4. Alternative Fuel Vehicles
- 9.1. Market Analysis, Insights and Forecast - by Vehicle Type
- 10. Asia Pacific Hong Kong Used Car Market Analysis, Insights and Forecast, 2019-2031
- 10.1. Market Analysis, Insights and Forecast - by Vehicle Type
- 10.1.1. Hatchback
- 10.1.2. Sedan
- 10.1.3. Sport Utility Vehicles (SUVs)
- 10.1.4. Multi-Purpose Vehicles (MUVs)
- 10.2. Market Analysis, Insights and Forecast - by Vendor Type
- 10.2.1. Organized
- 10.2.2. Unorganized
- 10.3. Market Analysis, Insights and Forecast - by Fuel Type
- 10.3.1. Gasoline
- 10.3.2. Diesel
- 10.3.3. Electric
- 10.3.4. Alternative Fuel Vehicles
- 10.1. Market Analysis, Insights and Forecast - by Vehicle Type
- 11. Competitive Analysis
- 11.1. Global Market Share Analysis 2024
- 11.2. Company Profiles
- 11.2.1 Ventures Motor Ltd (Ford Motor Ltd)
- 11.2.1.1. Overview
- 11.2.1.2. Products
- 11.2.1.3. SWOT Analysis
- 11.2.1.4. Recent Developments
- 11.2.1.5. Financials (Based on Availability)
- 11.2.2 Buycar hk
- 11.2.2.1. Overview
- 11.2.2.2. Products
- 11.2.2.3. SWOT Analysis
- 11.2.2.4. Recent Developments
- 11.2.2.5. Financials (Based on Availability)
- 11.2.3 DCH Motors Limited
- 11.2.3.1. Overview
- 11.2.3.2. Products
- 11.2.3.3. SWOT Analysis
- 11.2.3.4. Recent Developments
- 11.2.3.5. Financials (Based on Availability)
- 11.2.4 Guazi Inc
- 11.2.4.1. Overview
- 11.2.4.2. Products
- 11.2.4.3. SWOT Analysis
- 11.2.4.4. Recent Developments
- 11.2.4.5. Financials (Based on Availability)
- 11.2.5 Zung Fu Limited
- 11.2.5.1. Overview
- 11.2.5.2. Products
- 11.2.5.3. SWOT Analysis
- 11.2.5.4. Recent Developments
- 11.2.5.5. Financials (Based on Availability)
- 11.2.6 VINS MOTORS COMPANY LTD
- 11.2.6.1. Overview
- 11.2.6.2. Products
- 11.2.6.3. SWOT Analysis
- 11.2.6.4. Recent Developments
- 11.2.6.5. Financials (Based on Availability)
- 11.2.7 Kam Lung Motor Group
- 11.2.7.1. Overview
- 11.2.7.2. Products
- 11.2.7.3. SWOT Analysis
- 11.2.7.4. Recent Developments
- 11.2.7.5. Financials (Based on Availability)
- 11.2.8 Hong Kong Motor City
- 11.2.8.1. Overview
- 11.2.8.2. Products
- 11.2.8.3. SWOT Analysis
- 11.2.8.4. Recent Developments
- 11.2.8.5. Financials (Based on Availability)
- 11.2.9 Lit Motors HK
- 11.2.9.1. Overview
- 11.2.9.2. Products
- 11.2.9.3. SWOT Analysis
- 11.2.9.4. Recent Developments
- 11.2.9.5. Financials (Based on Availability)
- 11.2.10 Dah Chong Hong Holdings Limite
- 11.2.10.1. Overview
- 11.2.10.2. Products
- 11.2.10.3. SWOT Analysis
- 11.2.10.4. Recent Developments
- 11.2.10.5. Financials (Based on Availability)
- 11.2.1 Ventures Motor Ltd (Ford Motor Ltd)
List of Figures
- Figure 1: Global Hong Kong Used Car Market Revenue Breakdown (Million, %) by Region 2024 & 2032
- Figure 2: Hong Kong Hong Kong Used Car Market Revenue (Million), by Country 2024 & 2032
- Figure 3: Hong Kong Hong Kong Used Car Market Revenue Share (%), by Country 2024 & 2032
- Figure 4: North America Hong Kong Used Car Market Revenue (Million), by Vehicle Type 2024 & 2032
- Figure 5: North America Hong Kong Used Car Market Revenue Share (%), by Vehicle Type 2024 & 2032
- Figure 6: North America Hong Kong Used Car Market Revenue (Million), by Vendor Type 2024 & 2032
- Figure 7: North America Hong Kong Used Car Market Revenue Share (%), by Vendor Type 2024 & 2032
- Figure 8: North America Hong Kong Used Car Market Revenue (Million), by Fuel Type 2024 & 2032
- Figure 9: North America Hong Kong Used Car Market Revenue Share (%), by Fuel Type 2024 & 2032
- Figure 10: North America Hong Kong Used Car Market Revenue (Million), by Country 2024 & 2032
- Figure 11: North America Hong Kong Used Car Market Revenue Share (%), by Country 2024 & 2032
- Figure 12: South America Hong Kong Used Car Market Revenue (Million), by Vehicle Type 2024 & 2032
- Figure 13: South America Hong Kong Used Car Market Revenue Share (%), by Vehicle Type 2024 & 2032
- Figure 14: South America Hong Kong Used Car Market Revenue (Million), by Vendor Type 2024 & 2032
- Figure 15: South America Hong Kong Used Car Market Revenue Share (%), by Vendor Type 2024 & 2032
- Figure 16: South America Hong Kong Used Car Market Revenue (Million), by Fuel Type 2024 & 2032
- Figure 17: South America Hong Kong Used Car Market Revenue Share (%), by Fuel Type 2024 & 2032
- Figure 18: South America Hong Kong Used Car Market Revenue (Million), by Country 2024 & 2032
- Figure 19: South America Hong Kong Used Car Market Revenue Share (%), by Country 2024 & 2032
- Figure 20: Europe Hong Kong Used Car Market Revenue (Million), by Vehicle Type 2024 & 2032
- Figure 21: Europe Hong Kong Used Car Market Revenue Share (%), by Vehicle Type 2024 & 2032
- Figure 22: Europe Hong Kong Used Car Market Revenue (Million), by Vendor Type 2024 & 2032
- Figure 23: Europe Hong Kong Used Car Market Revenue Share (%), by Vendor Type 2024 & 2032
- Figure 24: Europe Hong Kong Used Car Market Revenue (Million), by Fuel Type 2024 & 2032
- Figure 25: Europe Hong Kong Used Car Market Revenue Share (%), by Fuel Type 2024 & 2032
- Figure 26: Europe Hong Kong Used Car Market Revenue (Million), by Country 2024 & 2032
- Figure 27: Europe Hong Kong Used Car Market Revenue Share (%), by Country 2024 & 2032
- Figure 28: Middle East & Africa Hong Kong Used Car Market Revenue (Million), by Vehicle Type 2024 & 2032
- Figure 29: Middle East & Africa Hong Kong Used Car Market Revenue Share (%), by Vehicle Type 2024 & 2032
- Figure 30: Middle East & Africa Hong Kong Used Car Market Revenue (Million), by Vendor Type 2024 & 2032
- Figure 31: Middle East & Africa Hong Kong Used Car Market Revenue Share (%), by Vendor Type 2024 & 2032
- Figure 32: Middle East & Africa Hong Kong Used Car Market Revenue (Million), by Fuel Type 2024 & 2032
- Figure 33: Middle East & Africa Hong Kong Used Car Market Revenue Share (%), by Fuel Type 2024 & 2032
- Figure 34: Middle East & Africa Hong Kong Used Car Market Revenue (Million), by Country 2024 & 2032
- Figure 35: Middle East & Africa Hong Kong Used Car Market Revenue Share (%), by Country 2024 & 2032
- Figure 36: Asia Pacific Hong Kong Used Car Market Revenue (Million), by Vehicle Type 2024 & 2032
- Figure 37: Asia Pacific Hong Kong Used Car Market Revenue Share (%), by Vehicle Type 2024 & 2032
- Figure 38: Asia Pacific Hong Kong Used Car Market Revenue (Million), by Vendor Type 2024 & 2032
- Figure 39: Asia Pacific Hong Kong Used Car Market Revenue Share (%), by Vendor Type 2024 & 2032
- Figure 40: Asia Pacific Hong Kong Used Car Market Revenue (Million), by Fuel Type 2024 & 2032
- Figure 41: Asia Pacific Hong Kong Used Car Market Revenue Share (%), by Fuel Type 2024 & 2032
- Figure 42: Asia Pacific Hong Kong Used Car Market Revenue (Million), by Country 2024 & 2032
- Figure 43: Asia Pacific Hong Kong Used Car Market Revenue Share (%), by Country 2024 & 2032
List of Tables
- Table 1: Global Hong Kong Used Car Market Revenue Million Forecast, by Region 2019 & 2032
- Table 2: Global Hong Kong Used Car Market Revenue Million Forecast, by Vehicle Type 2019 & 2032
- Table 3: Global Hong Kong Used Car Market Revenue Million Forecast, by Vendor Type 2019 & 2032
- Table 4: Global Hong Kong Used Car Market Revenue Million Forecast, by Fuel Type 2019 & 2032
- Table 5: Global Hong Kong Used Car Market Revenue Million Forecast, by Region 2019 & 2032
- Table 6: Global Hong Kong Used Car Market Revenue Million Forecast, by Country 2019 & 2032
- Table 7: Global Hong Kong Used Car Market Revenue Million Forecast, by Vehicle Type 2019 & 2032
- Table 8: Global Hong Kong Used Car Market Revenue Million Forecast, by Vendor Type 2019 & 2032
- Table 9: Global Hong Kong Used Car Market Revenue Million Forecast, by Fuel Type 2019 & 2032
- Table 10: Global Hong Kong Used Car Market Revenue Million Forecast, by Country 2019 & 2032
- Table 11: United States Hong Kong Used Car Market Revenue (Million) Forecast, by Application 2019 & 2032
- Table 12: Canada Hong Kong Used Car Market Revenue (Million) Forecast, by Application 2019 & 2032
- Table 13: Mexico Hong Kong Used Car Market Revenue (Million) Forecast, by Application 2019 & 2032
- Table 14: Global Hong Kong Used Car Market Revenue Million Forecast, by Vehicle Type 2019 & 2032
- Table 15: Global Hong Kong Used Car Market Revenue Million Forecast, by Vendor Type 2019 & 2032
- Table 16: Global Hong Kong Used Car Market Revenue Million Forecast, by Fuel Type 2019 & 2032
- Table 17: Global Hong Kong Used Car Market Revenue Million Forecast, by Country 2019 & 2032
- Table 18: Brazil Hong Kong Used Car Market Revenue (Million) Forecast, by Application 2019 & 2032
- Table 19: Argentina Hong Kong Used Car Market Revenue (Million) Forecast, by Application 2019 & 2032
- Table 20: Rest of South America Hong Kong Used Car Market Revenue (Million) Forecast, by Application 2019 & 2032
- Table 21: Global Hong Kong Used Car Market Revenue Million Forecast, by Vehicle Type 2019 & 2032
- Table 22: Global Hong Kong Used Car Market Revenue Million Forecast, by Vendor Type 2019 & 2032
- Table 23: Global Hong Kong Used Car Market Revenue Million Forecast, by Fuel Type 2019 & 2032
- Table 24: Global Hong Kong Used Car Market Revenue Million Forecast, by Country 2019 & 2032
- Table 25: United Kingdom Hong Kong Used Car Market Revenue (Million) Forecast, by Application 2019 & 2032
- Table 26: Germany Hong Kong Used Car Market Revenue (Million) Forecast, by Application 2019 & 2032
- Table 27: France Hong Kong Used Car Market Revenue (Million) Forecast, by Application 2019 & 2032
- Table 28: Italy Hong Kong Used Car Market Revenue (Million) Forecast, by Application 2019 & 2032
- Table 29: Spain Hong Kong Used Car Market Revenue (Million) Forecast, by Application 2019 & 2032
- Table 30: Russia Hong Kong Used Car Market Revenue (Million) Forecast, by Application 2019 & 2032
- Table 31: Benelux Hong Kong Used Car Market Revenue (Million) Forecast, by Application 2019 & 2032
- Table 32: Nordics Hong Kong Used Car Market Revenue (Million) Forecast, by Application 2019 & 2032
- Table 33: Rest of Europe Hong Kong Used Car Market Revenue (Million) Forecast, by Application 2019 & 2032
- Table 34: Global Hong Kong Used Car Market Revenue Million Forecast, by Vehicle Type 2019 & 2032
- Table 35: Global Hong Kong Used Car Market Revenue Million Forecast, by Vendor Type 2019 & 2032
- Table 36: Global Hong Kong Used Car Market Revenue Million Forecast, by Fuel Type 2019 & 2032
- Table 37: Global Hong Kong Used Car Market Revenue Million Forecast, by Country 2019 & 2032
- Table 38: Turkey Hong Kong Used Car Market Revenue (Million) Forecast, by Application 2019 & 2032
- Table 39: Israel Hong Kong Used Car Market Revenue (Million) Forecast, by Application 2019 & 2032
- Table 40: GCC Hong Kong Used Car Market Revenue (Million) Forecast, by Application 2019 & 2032
- Table 41: North Africa Hong Kong Used Car Market Revenue (Million) Forecast, by Application 2019 & 2032
- Table 42: South Africa Hong Kong Used Car Market Revenue (Million) Forecast, by Application 2019 & 2032
- Table 43: Rest of Middle East & Africa Hong Kong Used Car Market Revenue (Million) Forecast, by Application 2019 & 2032
- Table 44: Global Hong Kong Used Car Market Revenue Million Forecast, by Vehicle Type 2019 & 2032
- Table 45: Global Hong Kong Used Car Market Revenue Million Forecast, by Vendor Type 2019 & 2032
- Table 46: Global Hong Kong Used Car Market Revenue Million Forecast, by Fuel Type 2019 & 2032
- Table 47: Global Hong Kong Used Car Market Revenue Million Forecast, by Country 2019 & 2032
- Table 48: China Hong Kong Used Car Market Revenue (Million) Forecast, by Application 2019 & 2032
- Table 49: India Hong Kong Used Car Market Revenue (Million) Forecast, by Application 2019 & 2032
- Table 50: Japan Hong Kong Used Car Market Revenue (Million) Forecast, by Application 2019 & 2032
- Table 51: South Korea Hong Kong Used Car Market Revenue (Million) Forecast, by Application 2019 & 2032
- Table 52: ASEAN Hong Kong Used Car Market Revenue (Million) Forecast, by Application 2019 & 2032
- Table 53: Oceania Hong Kong Used Car Market Revenue (Million) Forecast, by Application 2019 & 2032
- Table 54: Rest of Asia Pacific Hong Kong Used Car Market Revenue (Million) Forecast, by Application 2019 & 2032
Frequently Asked Questions
1. What is the projected Compound Annual Growth Rate (CAGR) of the Hong Kong Used Car Market?
The projected CAGR is approximately > 8.00%.
2. Which companies are prominent players in the Hong Kong Used Car Market?
Key companies in the market include Ventures Motor Ltd (Ford Motor Ltd), Buycar hk, DCH Motors Limited, Guazi Inc, Zung Fu Limited, VINS MOTORS COMPANY LTD, Kam Lung Motor Group, Hong Kong Motor City, Lit Motors HK, Dah Chong Hong Holdings Limite.
3. What are the main segments of the Hong Kong Used Car Market?
The market segments include Vehicle Type, Vendor Type, Fuel Type.
4. Can you provide details about the market size?
The market size is estimated to be USD 1.72 Million as of 2022.
5. What are some drivers contributing to market growth?
Rise in Price of New Vehicles.
6. What are the notable trends driving market growth?
Growing Used Car Financing Aiding Market Growth.
7. Are there any restraints impacting market growth?
Trust And Transparency In Used Car Remained A Key Challenge For Consumers.
8. Can you provide examples of recent developments in the market?
June 2023: Jardine Cycle & Carriage, the investment arm of Hong Kong-based conglomerate Jardine Matheson, collaborated with Carro, Singapore's online automotive marketplace. The company signed a deal for USD 60 million to enhance used car sales in Hing Kong.
9. What pricing options are available for accessing the report?
Pricing options include single-user, multi-user, and enterprise licenses priced at USD 3800, USD 4500, and USD 5800 respectively.
10. Is the market size provided in terms of value or volume?
The market size is provided in terms of value, measured in Million.
11. Are there any specific market keywords associated with the report?
Yes, the market keyword associated with the report is "Hong Kong Used Car Market," which aids in identifying and referencing the specific market segment covered.
12. How do I determine which pricing option suits my needs best?
The pricing options vary based on user requirements and access needs. Individual users may opt for single-user licenses, while businesses requiring broader access may choose multi-user or enterprise licenses for cost-effective access to the report.
13. Are there any additional resources or data provided in the Hong Kong Used Car Market report?
While the report offers comprehensive insights, it's advisable to review the specific contents or supplementary materials provided to ascertain if additional resources or data are available.
14. How can I stay updated on further developments or reports in the Hong Kong Used Car Market?
To stay informed about further developments, trends, and reports in the Hong Kong Used Car Market, consider subscribing to industry newsletters, following relevant companies and organizations, or regularly checking reputable industry news sources and publications.
Methodology
Step 1 - Identification of Relevant Samples Size from Population Database


Step 2 - Approaches for Defining Global Market Size (Value, Volume* & Price*)

Note*: In applicable scenarios
Step 3 - Data Sources
Primary Research
- Web Analytics
- Survey Reports
- Research Institute
- Latest Research Reports
- Opinion Leaders
Secondary Research
- Annual Reports
- White Paper
- Latest Press Release
- Industry Association
- Paid Database
- Investor Presentations

Step 4 - Data Triangulation
Involves using different sources of information in order to increase the validity of a study
These sources are likely to be stakeholders in a program - participants, other researchers, program staff, other community members, and so on.
Then we put all data in single framework & apply various statistical tools to find out the dynamic on the market.
During the analysis stage, feedback from the stakeholder groups would be compared to determine areas of agreement as well as areas of divergence


