

Key Insights
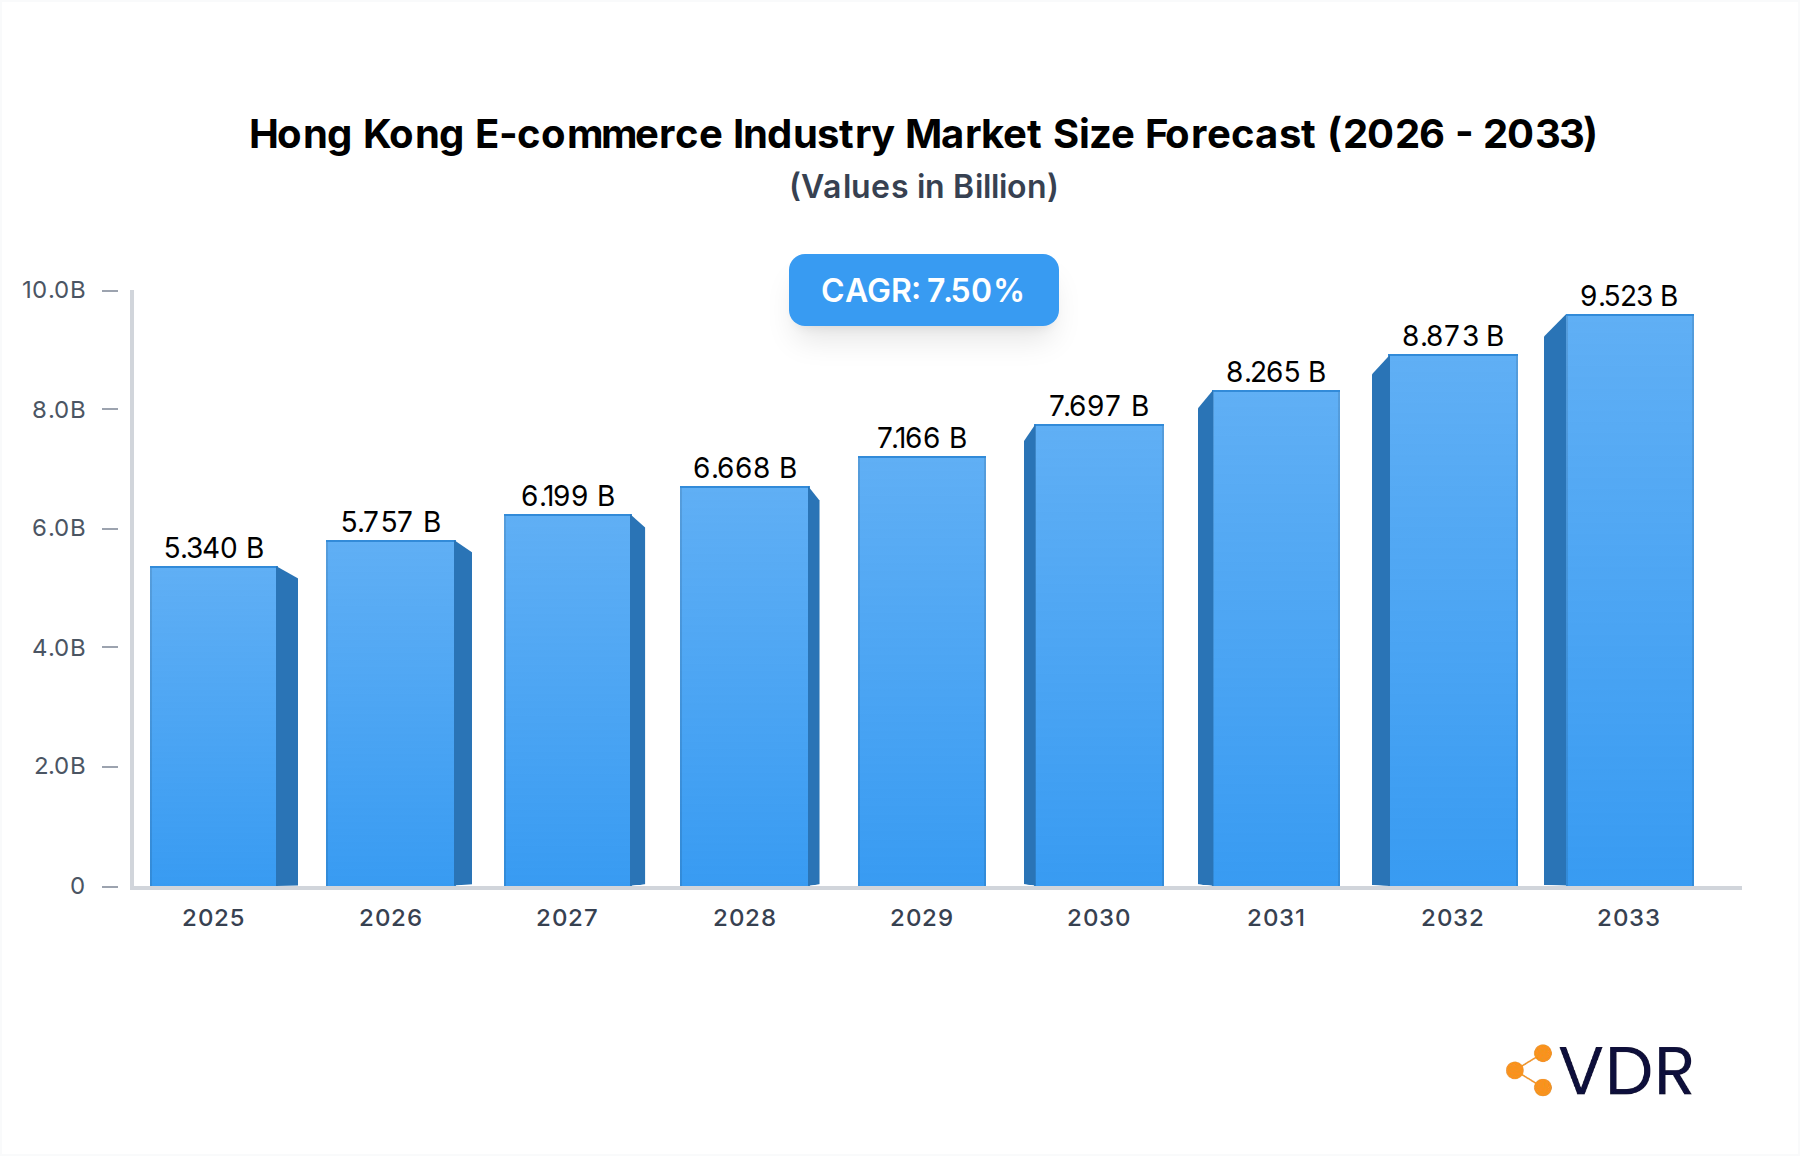
The Hong Kong e-commerce industry is poised for robust expansion, projected to reach $5.34 billion in 2025, driven by a compelling CAGR of 7.87% through 2033. This growth trajectory is fueled by increasing internet penetration, widespread smartphone adoption, and evolving consumer preferences for convenient online shopping. The B2C segment, in particular, demonstrates significant potential, with substantial market sizes anticipated across diverse application categories. Fashion and Apparel, alongside Beauty and Personal Care, are expected to lead the charge, capitalizing on impulse purchases and trend-driven demand. Consumer Electronics also remains a strong contender, supported by a continuous influx of new technologies and competitive pricing. The Food and Beverage sector is steadily gaining traction, benefiting from the convenience of grocery delivery services, while Furniture and Home goods are witnessing a gradual shift online as consumers become more comfortable with purchasing larger items remotely. The "Others" category, encompassing toys, DIY products, and media, will also contribute to the overall market expansion, reflecting a broadening of online purchase habits.

Hong Kong E-commerce Industry Market Size (In Billion)
The B2B e-commerce segment, though not explicitly detailed with market size figures in the provided data, is a critical component of the broader digital commerce ecosystem. Its growth is intrinsically linked to the efficiency gains and supply chain optimizations it offers to businesses. Key drivers for both B2C and B2B e-commerce in Hong Kong include enhanced digital payment infrastructure, sophisticated logistics and delivery networks, and the growing influence of social commerce. Emerging trends like the integration of augmented reality for product visualization, personalized shopping experiences, and the rise of livestream shopping are expected to further invigorate market activity. While the market is largely favorable, potential restraints could include increasing competition, evolving data privacy regulations, and the need for continuous investment in cybersecurity to maintain consumer trust. Nevertheless, with established players like Alibaba Group and Amazon vying for market share alongside local contenders, the competitive landscape promises innovation and enhanced consumer offerings, solidifying Hong Kong's position as a vibrant e-commerce hub.
Hong Kong E-commerce Industry Company Market Share
Unlocking the Potential: A Comprehensive Report on the Hong Kong E-commerce Industry (2019-2033)
This in-depth report provides a definitive analysis of the dynamic Hong Kong e-commerce landscape, offering critical insights for industry professionals, investors, and strategists. Spanning the historical period of 2019-2024 and extending to a detailed forecast from 2025-2033, this report leverages extensive data to illuminate market size, segmentation, growth drivers, emerging opportunities, and the competitive forces shaping the future of online retail in Hong Kong. We meticulously examine both B2C and B2B e-commerce, presenting values in billions of USD to ensure clarity and comparability. Explore the intricate dynamics of this thriving market, from established giants to nascent disruptors, and gain a strategic advantage in navigating the evolving digital commerce ecosystem.
Hong Kong E-commerce Industry Market Dynamics & Structure
The Hong Kong e-commerce market is characterized by a moderately concentrated structure, with key players like Alibaba Group, JD.com Inc., and Amazon.com Inc. holding significant influence. However, the rise of specialized platforms and niche players like Carousell Group and PARKnSHOP (HK) Limited fosters healthy competition and innovation. Technological innovation is a primary driver, with advancements in AI-powered personalization, same-day delivery logistics, and secure payment gateways (e.g., WeChat Pay Hong Kong Limited) continuously pushing the boundaries of the customer experience. Regulatory frameworks, while generally supportive of digital commerce, focus on data privacy and consumer protection, creating a stable yet evolving operating environment. Competitive product substitutes are abundant across all categories, from fashion and electronics to groceries, necessitating constant adaptation and differentiation. End-user demographics are increasingly tech-savvy, with a significant portion of the population actively engaging in online shopping for convenience and value. Mergers and acquisitions (M&A) trends, while not as pronounced as in some larger markets, are strategic, focusing on acquiring innovative technologies or expanding market reach within specific segments.
- Market Concentration: Dominated by a few large players, but with increasing fragmentation due to specialized platforms.
- Technological Innovation: Driven by AI, logistics automation, and advanced payment solutions.
- Regulatory Landscape: Supportive of e-commerce with a focus on consumer protection and data privacy.
- Competitive Substitutes: High availability across all product categories.
- End-User Demographics: Tech-savvy, convenience-seeking population.
- M&A Trends: Strategic, focused on technology acquisition and niche market expansion.
Hong Kong E-commerce Industry Growth Trends & Insights
The Hong Kong e-commerce industry is poised for substantial growth, projected to achieve a Compound Annual Growth Rate (CAGR) of xx% during the forecast period of 2025-2033. This robust expansion is underpinned by a confluence of factors, including increasing internet penetration, a high smartphone adoption rate, and a growing consumer preference for online shopping convenience. The market size for Business-to-Consumer (B2C) e-commerce is expected to reach an impressive \$XX billion in 2025, with steady growth anticipated across all sub-segments. Technological disruptions are continuously reshaping the landscape, with innovations in artificial intelligence for personalized recommendations, augmented reality for virtual try-ons, and sophisticated supply chain management systems enhancing efficiency and customer satisfaction. Consumer behavior is shifting rapidly, with a greater emphasis on value-driven purchases, a willingness to explore new brands online, and an increasing demand for sustainable and ethically sourced products. The adoption rates for online grocery shopping and subscription services are also on an upward trajectory, reflecting evolving lifestyle patterns. The integration of social commerce and live streaming further amplifies engagement and drives impulse purchases, creating new avenues for sales and brand building.
Dominant Regions, Countries, or Segments in Hong Kong E-commerce Industry
The B2C e-commerce segment is the undisputed leader in the Hong Kong e-commerce industry, driven by its substantial market size and broad consumer appeal. Within B2C, Fashion and Apparel and Consumer Electronics consistently emerge as the dominant application segments, exhibiting strong year-on-year growth. The market size for B2C e-commerce is projected to reach \$XX billion by 2027, with Fashion and Apparel accounting for approximately \$XX billion and Consumer Electronics for \$XX billion. The increasing disposable income and a strong appetite for the latest trends among Hong Kong's population fuel the demand in these categories. Furthermore, the Food and Beverage segment is witnessing accelerated growth, particularly post-pandemic, with consumers increasingly embracing online grocery and meal delivery services, estimated to reach \$XX billion by 2027.
- B2C E-commerce Dominance: The primary engine of growth due to wide consumer adoption.
- Leading Application Segments:
- Fashion and Apparel: Driven by trend-conscious consumers and a vast array of online retailers.
- Consumer Electronics: Fueled by demand for the latest gadgets and competitive online pricing.
- Fastest Growing Segment:
- Food and Beverage: Benefiting from convenience, wider product availability, and rapid delivery solutions.
- Market Size Projections (2027):
- B2C E-commerce: \$XX billion
- Fashion and Apparel: \$XX billion
- Consumer Electronics: \$XX billion
- Food and Beverage: \$XX billion
The B2B e-commerce market, while currently smaller, is also experiencing significant expansion, projected to reach \$XX billion by 2027. This growth is attributed to businesses adopting digital procurement platforms for greater efficiency, cost savings, and access to a wider supplier network. Key drivers include the robust economic policies supporting digitalization and the continuous development of robust digital infrastructure.
Hong Kong E-commerce Industry Product Landscape
The Hong Kong e-commerce product landscape is characterized by rapid innovation and a diverse range of offerings. From cutting-edge consumer electronics and the latest fashion trends to an expanding array of gourmet food products and essential home goods, online platforms cater to every consumer need. Unique selling propositions often revolve around competitive pricing, exclusive online-only deals, and personalized product recommendations driven by AI algorithms. Technological advancements, such as augmented reality for product visualization in furniture and home goods, are enhancing the online shopping experience, blurring the lines between online and offline retail. The "Others" category, encompassing toys, DIY supplies, and media, also shows resilience, driven by niche communities and specialized e-tailers.
Key Drivers, Barriers & Challenges in Hong Kong E-commerce Industry
Key Drivers:
- Technological Advancements: The widespread adoption of smartphones, high-speed internet, and mobile payment solutions are fundamental drivers.
- Evolving Consumer Behavior: A growing preference for convenience, wider product selection, and competitive pricing.
- Government Support: Favorable policies promoting digital transformation and e-commerce infrastructure development.
- Logistics and Fulfillment Innovation: Advancements in last-mile delivery and warehouse automation.
Barriers & Challenges:
- Intense Competition: A saturated market with numerous local and international players vying for market share.
- Supply Chain Disruptions: Global events can impact inventory availability and delivery times, affecting customer satisfaction.
- Regulatory Compliance: Navigating data privacy laws and consumer protection regulations can be complex.
- Customer Trust and Security Concerns: While improving, some consumers still harbor reservations about online transactions.
Emerging Opportunities in Hong Kong E-commerce Industry
Emerging opportunities in the Hong Kong e-commerce industry lie in the continued expansion of cross-border e-commerce, particularly with mainland China and Southeast Asian markets. The growing demand for sustainable and ethically sourced products presents a significant untapped market for eco-conscious brands. Furthermore, the integration of hyper-personalization through AI and the exploration of Web3 technologies for enhanced customer loyalty and immersive shopping experiences offer exciting new avenues for growth. The "Others" category, including niche hobbies and specialized services, also holds untapped potential for dedicated e-commerce platforms.
Growth Accelerators in the Hong Kong E-commerce Industry Industry
Catalysts driving long-term growth include strategic partnerships between e-commerce platforms and logistics providers to optimize delivery networks, leading to faster and more cost-effective fulfillment. Technological breakthroughs in areas like blockchain for supply chain transparency and AI-powered customer service bots will further enhance operational efficiency and customer satisfaction. Market expansion strategies, such as targeting expatriate communities and developing localized offerings for specific demographics, will also contribute significantly to sustained growth. The continuous evolution of payment solutions, including the integration of digital currencies and buy-now-pay-later options, will also fuel market expansion.
Key Players Shaping the Hong Kong E-commerce Industry Market
- JD.com Inc.
- PARKnSHOP (HK) Limited
- Carousell Group
- MUJI (Hong Kong) Co Ltd
- Price Guide Sdn Bhd
- Amazon.com Inc.
- Alibaba Group
- Hong Kong TV Shopping Network Limited
- eBay Inc.
- WeChat Pay Hong Kong Limited
Notable Milestones in Hong Kong E-commerce Industry Sector
- May 2022: YesAsia, a global online retailer, announced a partnership with Geek+, an autonomous robots company, to build YesAsia's first smart warehouse at Goodman Interlink, located in Tsing Yi, Hong Kong.
- April 2022: Beauty retailer Sa Sa International partnered with Foodpanda to provide on-demand delivery services in Hong Kong. This service was initially started as a pilot project with 20 stores offering approximately 700 products on Foodpanda Mall.
In-Depth Hong Kong E-commerce Industry Market Outlook
The future market outlook for the Hong Kong e-commerce industry is exceptionally promising, driven by a synergistic combination of technological innovation and evolving consumer preferences. Expect continued growth in established segments like Fashion and Apparel and Consumer Electronics, alongside rapid expansion in Food and Beverage and niche categories. Strategic investments in AI-driven personalization, sustainable logistics solutions, and cross-border e-commerce initiatives will be crucial for capturing future market share. The ongoing digital transformation of businesses further solidifies the B2B e-commerce sector's growth trajectory. Hong Kong's position as a regional hub, coupled with its sophisticated digital infrastructure, positions it for sustained leadership in the evolving global e-commerce landscape.
Hong Kong E-commerce Industry Segmentation
-
1. B2C ecommerce
- 1.1. Market size (GMV) for the period of 2017-2027
-
1.2. Market Segmentation - by Application
- 1.2.1. Beauty and Personal Care
- 1.2.2. Consumer Electronics
- 1.2.3. Fashion and Apparel
- 1.2.4. Food and Beverage
- 1.2.5. Furniture and Home
- 1.2.6. Others (Toys, DIY, Media, etc.)
- 2. Market size (GMV) for the period of 2017-2027
-
3. Application
- 3.1. Beauty and Personal Care
- 3.2. Consumer Electronics
- 3.3. Fashion and Apparel
- 3.4. Food and Beverage
- 3.5. Furniture and Home
- 3.6. Others (Toys, DIY, Media, etc.)
- 4. Beauty and Personal Care
- 5. Consumer Electronics
- 6. Fashion and Apparel
- 7. Food and Beverage
- 8. Furniture and Home
- 9. Others (Toys, DIY, Media, etc.)
-
10. B2B ecommerce
- 10.1. Market size for the period of 2017-2027
Hong Kong E-commerce Industry Segmentation By Geography
-
1. North America
- 1.1. United States
- 1.2. Canada
- 1.3. Mexico
-
2. South America
- 2.1. Brazil
- 2.2. Argentina
- 2.3. Rest of South America
-
3. Europe
- 3.1. United Kingdom
- 3.2. Germany
- 3.3. France
- 3.4. Italy
- 3.5. Spain
- 3.6. Russia
- 3.7. Benelux
- 3.8. Nordics
- 3.9. Rest of Europe
-
4. Middle East & Africa
- 4.1. Turkey
- 4.2. Israel
- 4.3. GCC
- 4.4. North Africa
- 4.5. South Africa
- 4.6. Rest of Middle East & Africa
-
5. Asia Pacific
- 5.1. China
- 5.2. India
- 5.3. Japan
- 5.4. South Korea
- 5.5. ASEAN
- 5.6. Oceania
- 5.7. Rest of Asia Pacific
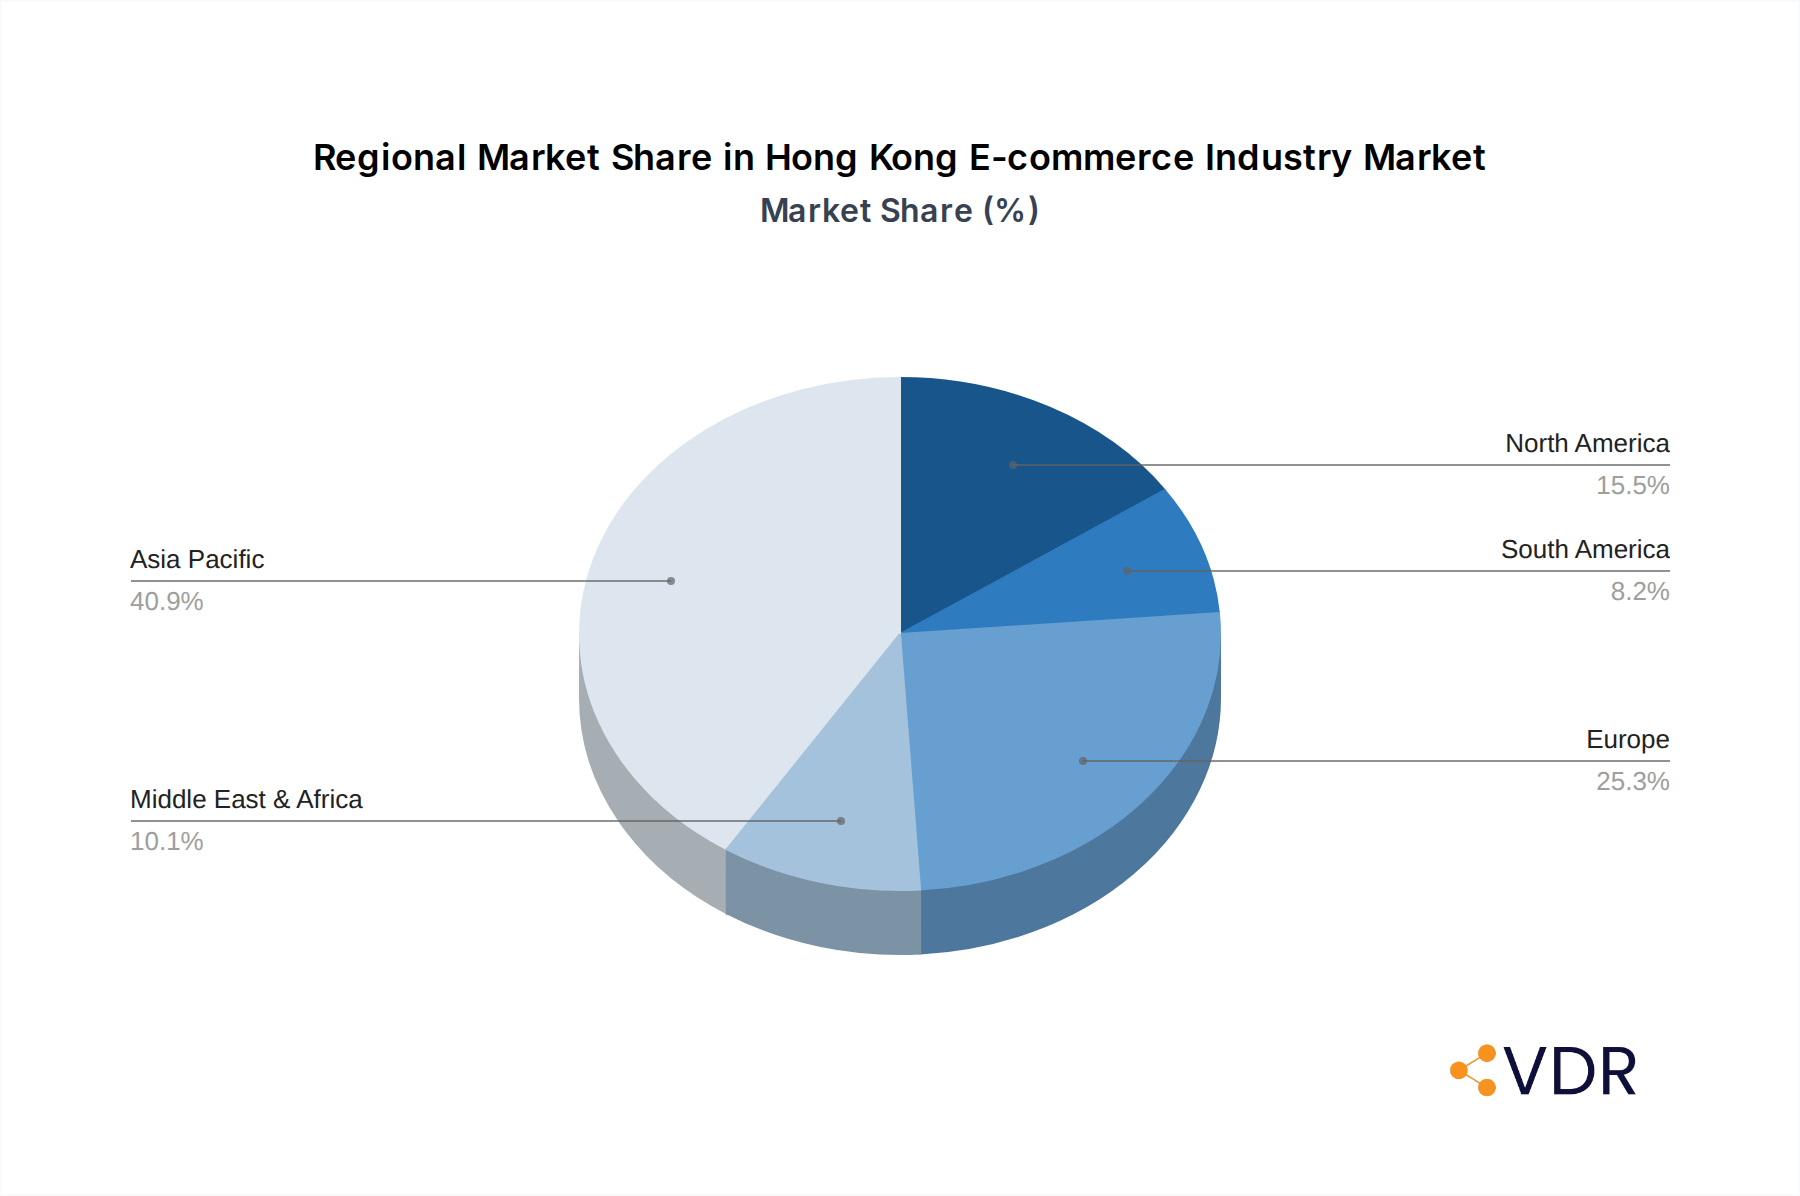
Hong Kong E-commerce Industry Regional Market Share
Geographic Coverage of Hong Kong E-commerce Industry
Hong Kong E-commerce Industry REPORT HIGHLIGHTS
| Aspects | Details |
|---|---|
| Study Period | 2020-2034 |
| Base Year | 2025 |
| Estimated Year | 2026 |
| Forecast Period | 2026-2034 |
| Historical Period | 2020-2025 |
| Growth Rate | CAGR of 7.87% from 2020-2034 |
| Segmentation |
|
Table of Contents
- 1. Introduction
- 1.1. Research Scope
- 1.2. Market Segmentation
- 1.3. Research Objective
- 1.4. Definitions and Assumptions
- 2. Executive Summary
- 2.1. Market Snapshot
- 3. Market Dynamics
- 3.1. Market Drivers
- 3.2. Market Restrains
- 3.3. Market Trends
- 3.4. Market Opportunities
- 4. Market Factor Analysis
- 4.1. Porters Five Forces
- 4.1.1. Bargaining Power of Suppliers
- 4.1.2. Bargaining Power of Buyers
- 4.1.3. Threat of New Entrants
- 4.1.4. Threat of Substitutes
- 4.1.5. Competitive Rivalry
- 4.2. PESTEL analysis
- 4.3. BCG Analysis
- 4.3.1. Stars (High Growth, High Market Share)
- 4.3.2. Cash Cows (Low Growth, High Market Share)
- 4.3.3. Question Mark (High Growth, Low Market Share)
- 4.3.4. Dogs (Low Growth, Low Market Share)
- 4.4. Ansoff Matrix Analysis
- 4.5. Supply Chain Analysis
- 4.6. Regulatory Landscape
- 4.7. Current Market Potential and Opportunity Assessment (TAM–SAM–SOM Framework)
- 4.8. VDR Analyst Note
- 4.1. Porters Five Forces
- 5. Market Analysis, Insights and Forecast 2021-2033
- 5.1. Market Analysis, Insights and Forecast - by B2C ecommerce
- 5.1.1. Market size (GMV) for the period of 2017-2027
- 5.1.2. Market Segmentation - by Application
- 5.1.2.1. Beauty and Personal Care
- 5.1.2.2. Consumer Electronics
- 5.1.2.3. Fashion and Apparel
- 5.1.2.4. Food and Beverage
- 5.1.2.5. Furniture and Home
- 5.1.2.6. Others (Toys, DIY, Media, etc.)
- 5.2. Market Analysis, Insights and Forecast - by Market size (GMV) for the period of 2017-2027
- 5.3. Market Analysis, Insights and Forecast - by Application
- 5.3.1. Beauty and Personal Care
- 5.3.2. Consumer Electronics
- 5.3.3. Fashion and Apparel
- 5.3.4. Food and Beverage
- 5.3.5. Furniture and Home
- 5.3.6. Others (Toys, DIY, Media, etc.)
- 5.4. Market Analysis, Insights and Forecast - by Beauty and Personal Care
- 5.5. Market Analysis, Insights and Forecast - by Consumer Electronics
- 5.6. Market Analysis, Insights and Forecast - by Fashion and Apparel
- 5.7. Market Analysis, Insights and Forecast - by Food and Beverage
- 5.8. Market Analysis, Insights and Forecast - by Furniture and Home
- 5.9. Market Analysis, Insights and Forecast - by Others (Toys, DIY, Media, etc.)
- 5.10. Market Analysis, Insights and Forecast - by B2B ecommerce
- 5.10.1. Market size for the period of 2017-2027
- 5.11. Market Analysis, Insights and Forecast - by Region
- 5.11.1. North America
- 5.11.2. South America
- 5.11.3. Europe
- 5.11.4. Middle East & Africa
- 5.11.5. Asia Pacific
- 5.1. Market Analysis, Insights and Forecast - by B2C ecommerce
- 6. Global Hong Kong E-commerce Industry Analysis, Insights and Forecast, 2021-2033
- 6.1. Market Analysis, Insights and Forecast - by B2C ecommerce
- 6.1.1. Market size (GMV) for the period of 2017-2027
- 6.1.2. Market Segmentation - by Application
- 6.1.2.1. Beauty and Personal Care
- 6.1.2.2. Consumer Electronics
- 6.1.2.3. Fashion and Apparel
- 6.1.2.4. Food and Beverage
- 6.1.2.5. Furniture and Home
- 6.1.2.6. Others (Toys, DIY, Media, etc.)
- 6.2. Market Analysis, Insights and Forecast - by Market size (GMV) for the period of 2017-2027
- 6.3. Market Analysis, Insights and Forecast - by Application
- 6.3.1. Beauty and Personal Care
- 6.3.2. Consumer Electronics
- 6.3.3. Fashion and Apparel
- 6.3.4. Food and Beverage
- 6.3.5. Furniture and Home
- 6.3.6. Others (Toys, DIY, Media, etc.)
- 6.4. Market Analysis, Insights and Forecast - by Beauty and Personal Care
- 6.5. Market Analysis, Insights and Forecast - by Consumer Electronics
- 6.6. Market Analysis, Insights and Forecast - by Fashion and Apparel
- 6.7. Market Analysis, Insights and Forecast - by Food and Beverage
- 6.8. Market Analysis, Insights and Forecast - by Furniture and Home
- 6.9. Market Analysis, Insights and Forecast - by Others (Toys, DIY, Media, etc.)
- 6.10. Market Analysis, Insights and Forecast - by B2B ecommerce
- 6.10.1. Market size for the period of 2017-2027
- 6.1. Market Analysis, Insights and Forecast - by B2C ecommerce
- 7. North America Hong Kong E-commerce Industry Analysis, Insights and Forecast, 2021-2033
- 7.1. Market Analysis, Insights and Forecast - by B2C ecommerce
- 7.1.1. Market size (GMV) for the period of 2017-2027
- 7.1.2. Market Segmentation - by Application
- 7.1.2.1. Beauty and Personal Care
- 7.1.2.2. Consumer Electronics
- 7.1.2.3. Fashion and Apparel
- 7.1.2.4. Food and Beverage
- 7.1.2.5. Furniture and Home
- 7.1.2.6. Others (Toys, DIY, Media, etc.)
- 7.2. Market Analysis, Insights and Forecast - by Market size (GMV) for the period of 2017-2027
- 7.3. Market Analysis, Insights and Forecast - by Application
- 7.3.1. Beauty and Personal Care
- 7.3.2. Consumer Electronics
- 7.3.3. Fashion and Apparel
- 7.3.4. Food and Beverage
- 7.3.5. Furniture and Home
- 7.3.6. Others (Toys, DIY, Media, etc.)
- 7.4. Market Analysis, Insights and Forecast - by Beauty and Personal Care
- 7.5. Market Analysis, Insights and Forecast - by Consumer Electronics
- 7.6. Market Analysis, Insights and Forecast - by Fashion and Apparel
- 7.7. Market Analysis, Insights and Forecast - by Food and Beverage
- 7.8. Market Analysis, Insights and Forecast - by Furniture and Home
- 7.9. Market Analysis, Insights and Forecast - by Others (Toys, DIY, Media, etc.)
- 7.10. Market Analysis, Insights and Forecast - by B2B ecommerce
- 7.10.1. Market size for the period of 2017-2027
- 7.1. Market Analysis, Insights and Forecast - by B2C ecommerce
- 8. South America Hong Kong E-commerce Industry Analysis, Insights and Forecast, 2021-2033
- 8.1. Market Analysis, Insights and Forecast - by B2C ecommerce
- 8.1.1. Market size (GMV) for the period of 2017-2027
- 8.1.2. Market Segmentation - by Application
- 8.1.2.1. Beauty and Personal Care
- 8.1.2.2. Consumer Electronics
- 8.1.2.3. Fashion and Apparel
- 8.1.2.4. Food and Beverage
- 8.1.2.5. Furniture and Home
- 8.1.2.6. Others (Toys, DIY, Media, etc.)
- 8.2. Market Analysis, Insights and Forecast - by Market size (GMV) for the period of 2017-2027
- 8.3. Market Analysis, Insights and Forecast - by Application
- 8.3.1. Beauty and Personal Care
- 8.3.2. Consumer Electronics
- 8.3.3. Fashion and Apparel
- 8.3.4. Food and Beverage
- 8.3.5. Furniture and Home
- 8.3.6. Others (Toys, DIY, Media, etc.)
- 8.4. Market Analysis, Insights and Forecast - by Beauty and Personal Care
- 8.5. Market Analysis, Insights and Forecast - by Consumer Electronics
- 8.6. Market Analysis, Insights and Forecast - by Fashion and Apparel
- 8.7. Market Analysis, Insights and Forecast - by Food and Beverage
- 8.8. Market Analysis, Insights and Forecast - by Furniture and Home
- 8.9. Market Analysis, Insights and Forecast - by Others (Toys, DIY, Media, etc.)
- 8.10. Market Analysis, Insights and Forecast - by B2B ecommerce
- 8.10.1. Market size for the period of 2017-2027
- 8.1. Market Analysis, Insights and Forecast - by B2C ecommerce
- 9. Europe Hong Kong E-commerce Industry Analysis, Insights and Forecast, 2021-2033
- 9.1. Market Analysis, Insights and Forecast - by B2C ecommerce
- 9.1.1. Market size (GMV) for the period of 2017-2027
- 9.1.2. Market Segmentation - by Application
- 9.1.2.1. Beauty and Personal Care
- 9.1.2.2. Consumer Electronics
- 9.1.2.3. Fashion and Apparel
- 9.1.2.4. Food and Beverage
- 9.1.2.5. Furniture and Home
- 9.1.2.6. Others (Toys, DIY, Media, etc.)
- 9.2. Market Analysis, Insights and Forecast - by Market size (GMV) for the period of 2017-2027
- 9.3. Market Analysis, Insights and Forecast - by Application
- 9.3.1. Beauty and Personal Care
- 9.3.2. Consumer Electronics
- 9.3.3. Fashion and Apparel
- 9.3.4. Food and Beverage
- 9.3.5. Furniture and Home
- 9.3.6. Others (Toys, DIY, Media, etc.)
- 9.4. Market Analysis, Insights and Forecast - by Beauty and Personal Care
- 9.5. Market Analysis, Insights and Forecast - by Consumer Electronics
- 9.6. Market Analysis, Insights and Forecast - by Fashion and Apparel
- 9.7. Market Analysis, Insights and Forecast - by Food and Beverage
- 9.8. Market Analysis, Insights and Forecast - by Furniture and Home
- 9.9. Market Analysis, Insights and Forecast - by Others (Toys, DIY, Media, etc.)
- 9.10. Market Analysis, Insights and Forecast - by B2B ecommerce
- 9.10.1. Market size for the period of 2017-2027
- 9.1. Market Analysis, Insights and Forecast - by B2C ecommerce
- 10. Middle East & Africa Hong Kong E-commerce Industry Analysis, Insights and Forecast, 2021-2033
- 10.1. Market Analysis, Insights and Forecast - by B2C ecommerce
- 10.1.1. Market size (GMV) for the period of 2017-2027
- 10.1.2. Market Segmentation - by Application
- 10.1.2.1. Beauty and Personal Care
- 10.1.2.2. Consumer Electronics
- 10.1.2.3. Fashion and Apparel
- 10.1.2.4. Food and Beverage
- 10.1.2.5. Furniture and Home
- 10.1.2.6. Others (Toys, DIY, Media, etc.)
- 10.2. Market Analysis, Insights and Forecast - by Market size (GMV) for the period of 2017-2027
- 10.3. Market Analysis, Insights and Forecast - by Application
- 10.3.1. Beauty and Personal Care
- 10.3.2. Consumer Electronics
- 10.3.3. Fashion and Apparel
- 10.3.4. Food and Beverage
- 10.3.5. Furniture and Home
- 10.3.6. Others (Toys, DIY, Media, etc.)
- 10.4. Market Analysis, Insights and Forecast - by Beauty and Personal Care
- 10.5. Market Analysis, Insights and Forecast - by Consumer Electronics
- 10.6. Market Analysis, Insights and Forecast - by Fashion and Apparel
- 10.7. Market Analysis, Insights and Forecast - by Food and Beverage
- 10.8. Market Analysis, Insights and Forecast - by Furniture and Home
- 10.9. Market Analysis, Insights and Forecast - by Others (Toys, DIY, Media, etc.)
- 10.10. Market Analysis, Insights and Forecast - by B2B ecommerce
- 10.10.1. Market size for the period of 2017-2027
- 10.1. Market Analysis, Insights and Forecast - by B2C ecommerce
- 11. Asia Pacific Hong Kong E-commerce Industry Analysis, Insights and Forecast, 2021-2033
- 11.1. Market Analysis, Insights and Forecast - by B2C ecommerce
- 11.1.1. Market size (GMV) for the period of 2017-2027
- 11.1.2. Market Segmentation - by Application
- 11.1.2.1. Beauty and Personal Care
- 11.1.2.2. Consumer Electronics
- 11.1.2.3. Fashion and Apparel
- 11.1.2.4. Food and Beverage
- 11.1.2.5. Furniture and Home
- 11.1.2.6. Others (Toys, DIY, Media, etc.)
- 11.2. Market Analysis, Insights and Forecast - by Market size (GMV) for the period of 2017-2027
- 11.3. Market Analysis, Insights and Forecast - by Application
- 11.3.1. Beauty and Personal Care
- 11.3.2. Consumer Electronics
- 11.3.3. Fashion and Apparel
- 11.3.4. Food and Beverage
- 11.3.5. Furniture and Home
- 11.3.6. Others (Toys, DIY, Media, etc.)
- 11.4. Market Analysis, Insights and Forecast - by Beauty and Personal Care
- 11.5. Market Analysis, Insights and Forecast - by Consumer Electronics
- 11.6. Market Analysis, Insights and Forecast - by Fashion and Apparel
- 11.7. Market Analysis, Insights and Forecast - by Food and Beverage
- 11.8. Market Analysis, Insights and Forecast - by Furniture and Home
- 11.9. Market Analysis, Insights and Forecast - by Others (Toys, DIY, Media, etc.)
- 11.10. Market Analysis, Insights and Forecast - by B2B ecommerce
- 11.10.1. Market size for the period of 2017-2027
- 11.1. Market Analysis, Insights and Forecast - by B2C ecommerce
- 12. Competitive Analysis
- 12.1. Company Profiles
- 12.1.1 JD com Inc
- 12.1.1.1. Company Overview
- 12.1.1.2. Products
- 12.1.1.3. Company Financials
- 12.1.1.4. SWOT Analysis
- 12.1.2 PARKnSHOP (HK) Limited
- 12.1.2.1. Company Overview
- 12.1.2.2. Products
- 12.1.2.3. Company Financials
- 12.1.2.4. SWOT Analysis
- 12.1.3 Carousell Group*List Not Exhaustive
- 12.1.3.1. Company Overview
- 12.1.3.2. Products
- 12.1.3.3. Company Financials
- 12.1.3.4. SWOT Analysis
- 12.1.4 MUJI (Hong Kong) Co Ltd
- 12.1.4.1. Company Overview
- 12.1.4.2. Products
- 12.1.4.3. Company Financials
- 12.1.4.4. SWOT Analysis
- 12.1.5 Price Guide Sdn Bhd
- 12.1.5.1. Company Overview
- 12.1.5.2. Products
- 12.1.5.3. Company Financials
- 12.1.5.4. SWOT Analysis
- 12.1.6 Amazon com Inc
- 12.1.6.1. Company Overview
- 12.1.6.2. Products
- 12.1.6.3. Company Financials
- 12.1.6.4. SWOT Analysis
- 12.1.7 Alibaba Group
- 12.1.7.1. Company Overview
- 12.1.7.2. Products
- 12.1.7.3. Company Financials
- 12.1.7.4. SWOT Analysis
- 12.1.8 Hong Kong TV Shopping Network Limited
- 12.1.8.1. Company Overview
- 12.1.8.2. Products
- 12.1.8.3. Company Financials
- 12.1.8.4. SWOT Analysis
- 12.1.9 eBay Inc
- 12.1.9.1. Company Overview
- 12.1.9.2. Products
- 12.1.9.3. Company Financials
- 12.1.9.4. SWOT Analysis
- 12.1.10 WeChat Pay Hong Kong Limited
- 12.1.10.1. Company Overview
- 12.1.10.2. Products
- 12.1.10.3. Company Financials
- 12.1.10.4. SWOT Analysis
- 12.1.1 JD com Inc
- 12.2. Market Entropy
- 12.2.1 Company's Key Areas Served
- 12.2.2 Recent Developments
- 12.3. Company Market Share Analysis 2025
- 12.3.1 Top 5 Companies Market Share Analysis
- 12.3.2 Top 3 Companies Market Share Analysis
- 12.4. List of Potential Customers
- 13. Research Methodology
List of Figures
- Figure 1: Global Hong Kong E-commerce Industry Revenue Breakdown (billion, %) by Region 2025 & 2033
- Figure 2: North America Hong Kong E-commerce Industry Revenue (billion), by B2C ecommerce 2025 & 2033
- Figure 3: North America Hong Kong E-commerce Industry Revenue Share (%), by B2C ecommerce 2025 & 2033
- Figure 4: North America Hong Kong E-commerce Industry Revenue (billion), by Market size (GMV) for the period of 2017-2027 2025 & 2033
- Figure 5: North America Hong Kong E-commerce Industry Revenue Share (%), by Market size (GMV) for the period of 2017-2027 2025 & 2033
- Figure 6: North America Hong Kong E-commerce Industry Revenue (billion), by Application 2025 & 2033
- Figure 7: North America Hong Kong E-commerce Industry Revenue Share (%), by Application 2025 & 2033
- Figure 8: North America Hong Kong E-commerce Industry Revenue (billion), by Beauty and Personal Care 2025 & 2033
- Figure 9: North America Hong Kong E-commerce Industry Revenue Share (%), by Beauty and Personal Care 2025 & 2033
- Figure 10: North America Hong Kong E-commerce Industry Revenue (billion), by Consumer Electronics 2025 & 2033
- Figure 11: North America Hong Kong E-commerce Industry Revenue Share (%), by Consumer Electronics 2025 & 2033
- Figure 12: North America Hong Kong E-commerce Industry Revenue (billion), by Fashion and Apparel 2025 & 2033
- Figure 13: North America Hong Kong E-commerce Industry Revenue Share (%), by Fashion and Apparel 2025 & 2033
- Figure 14: North America Hong Kong E-commerce Industry Revenue (billion), by Food and Beverage 2025 & 2033
- Figure 15: North America Hong Kong E-commerce Industry Revenue Share (%), by Food and Beverage 2025 & 2033
- Figure 16: North America Hong Kong E-commerce Industry Revenue (billion), by Furniture and Home 2025 & 2033
- Figure 17: North America Hong Kong E-commerce Industry Revenue Share (%), by Furniture and Home 2025 & 2033
- Figure 18: North America Hong Kong E-commerce Industry Revenue (billion), by Others (Toys, DIY, Media, etc.) 2025 & 2033
- Figure 19: North America Hong Kong E-commerce Industry Revenue Share (%), by Others (Toys, DIY, Media, etc.) 2025 & 2033
- Figure 20: North America Hong Kong E-commerce Industry Revenue (billion), by B2B ecommerce 2025 & 2033
- Figure 21: North America Hong Kong E-commerce Industry Revenue Share (%), by B2B ecommerce 2025 & 2033
- Figure 22: North America Hong Kong E-commerce Industry Revenue (billion), by Country 2025 & 2033
- Figure 23: North America Hong Kong E-commerce Industry Revenue Share (%), by Country 2025 & 2033
- Figure 24: South America Hong Kong E-commerce Industry Revenue (billion), by B2C ecommerce 2025 & 2033
- Figure 25: South America Hong Kong E-commerce Industry Revenue Share (%), by B2C ecommerce 2025 & 2033
- Figure 26: South America Hong Kong E-commerce Industry Revenue (billion), by Market size (GMV) for the period of 2017-2027 2025 & 2033
- Figure 27: South America Hong Kong E-commerce Industry Revenue Share (%), by Market size (GMV) for the period of 2017-2027 2025 & 2033
- Figure 28: South America Hong Kong E-commerce Industry Revenue (billion), by Application 2025 & 2033
- Figure 29: South America Hong Kong E-commerce Industry Revenue Share (%), by Application 2025 & 2033
- Figure 30: South America Hong Kong E-commerce Industry Revenue (billion), by Beauty and Personal Care 2025 & 2033
- Figure 31: South America Hong Kong E-commerce Industry Revenue Share (%), by Beauty and Personal Care 2025 & 2033
- Figure 32: South America Hong Kong E-commerce Industry Revenue (billion), by Consumer Electronics 2025 & 2033
- Figure 33: South America Hong Kong E-commerce Industry Revenue Share (%), by Consumer Electronics 2025 & 2033
- Figure 34: South America Hong Kong E-commerce Industry Revenue (billion), by Fashion and Apparel 2025 & 2033
- Figure 35: South America Hong Kong E-commerce Industry Revenue Share (%), by Fashion and Apparel 2025 & 2033
- Figure 36: South America Hong Kong E-commerce Industry Revenue (billion), by Food and Beverage 2025 & 2033
- Figure 37: South America Hong Kong E-commerce Industry Revenue Share (%), by Food and Beverage 2025 & 2033
- Figure 38: South America Hong Kong E-commerce Industry Revenue (billion), by Furniture and Home 2025 & 2033
- Figure 39: South America Hong Kong E-commerce Industry Revenue Share (%), by Furniture and Home 2025 & 2033
- Figure 40: South America Hong Kong E-commerce Industry Revenue (billion), by Others (Toys, DIY, Media, etc.) 2025 & 2033
- Figure 41: South America Hong Kong E-commerce Industry Revenue Share (%), by Others (Toys, DIY, Media, etc.) 2025 & 2033
- Figure 42: South America Hong Kong E-commerce Industry Revenue (billion), by B2B ecommerce 2025 & 2033
- Figure 43: South America Hong Kong E-commerce Industry Revenue Share (%), by B2B ecommerce 2025 & 2033
- Figure 44: South America Hong Kong E-commerce Industry Revenue (billion), by Country 2025 & 2033
- Figure 45: South America Hong Kong E-commerce Industry Revenue Share (%), by Country 2025 & 2033
- Figure 46: Europe Hong Kong E-commerce Industry Revenue (billion), by B2C ecommerce 2025 & 2033
- Figure 47: Europe Hong Kong E-commerce Industry Revenue Share (%), by B2C ecommerce 2025 & 2033
- Figure 48: Europe Hong Kong E-commerce Industry Revenue (billion), by Market size (GMV) for the period of 2017-2027 2025 & 2033
- Figure 49: Europe Hong Kong E-commerce Industry Revenue Share (%), by Market size (GMV) for the period of 2017-2027 2025 & 2033
- Figure 50: Europe Hong Kong E-commerce Industry Revenue (billion), by Application 2025 & 2033
- Figure 51: Europe Hong Kong E-commerce Industry Revenue Share (%), by Application 2025 & 2033
- Figure 52: Europe Hong Kong E-commerce Industry Revenue (billion), by Beauty and Personal Care 2025 & 2033
- Figure 53: Europe Hong Kong E-commerce Industry Revenue Share (%), by Beauty and Personal Care 2025 & 2033
- Figure 54: Europe Hong Kong E-commerce Industry Revenue (billion), by Consumer Electronics 2025 & 2033
- Figure 55: Europe Hong Kong E-commerce Industry Revenue Share (%), by Consumer Electronics 2025 & 2033
- Figure 56: Europe Hong Kong E-commerce Industry Revenue (billion), by Fashion and Apparel 2025 & 2033
- Figure 57: Europe Hong Kong E-commerce Industry Revenue Share (%), by Fashion and Apparel 2025 & 2033
- Figure 58: Europe Hong Kong E-commerce Industry Revenue (billion), by Food and Beverage 2025 & 2033
- Figure 59: Europe Hong Kong E-commerce Industry Revenue Share (%), by Food and Beverage 2025 & 2033
- Figure 60: Europe Hong Kong E-commerce Industry Revenue (billion), by Furniture and Home 2025 & 2033
- Figure 61: Europe Hong Kong E-commerce Industry Revenue Share (%), by Furniture and Home 2025 & 2033
- Figure 62: Europe Hong Kong E-commerce Industry Revenue (billion), by Others (Toys, DIY, Media, etc.) 2025 & 2033
- Figure 63: Europe Hong Kong E-commerce Industry Revenue Share (%), by Others (Toys, DIY, Media, etc.) 2025 & 2033
- Figure 64: Europe Hong Kong E-commerce Industry Revenue (billion), by B2B ecommerce 2025 & 2033
- Figure 65: Europe Hong Kong E-commerce Industry Revenue Share (%), by B2B ecommerce 2025 & 2033
- Figure 66: Europe Hong Kong E-commerce Industry Revenue (billion), by Country 2025 & 2033
- Figure 67: Europe Hong Kong E-commerce Industry Revenue Share (%), by Country 2025 & 2033
- Figure 68: Middle East & Africa Hong Kong E-commerce Industry Revenue (billion), by B2C ecommerce 2025 & 2033
- Figure 69: Middle East & Africa Hong Kong E-commerce Industry Revenue Share (%), by B2C ecommerce 2025 & 2033
- Figure 70: Middle East & Africa Hong Kong E-commerce Industry Revenue (billion), by Market size (GMV) for the period of 2017-2027 2025 & 2033
- Figure 71: Middle East & Africa Hong Kong E-commerce Industry Revenue Share (%), by Market size (GMV) for the period of 2017-2027 2025 & 2033
- Figure 72: Middle East & Africa Hong Kong E-commerce Industry Revenue (billion), by Application 2025 & 2033
- Figure 73: Middle East & Africa Hong Kong E-commerce Industry Revenue Share (%), by Application 2025 & 2033
- Figure 74: Middle East & Africa Hong Kong E-commerce Industry Revenue (billion), by Beauty and Personal Care 2025 & 2033
- Figure 75: Middle East & Africa Hong Kong E-commerce Industry Revenue Share (%), by Beauty and Personal Care 2025 & 2033
- Figure 76: Middle East & Africa Hong Kong E-commerce Industry Revenue (billion), by Consumer Electronics 2025 & 2033
- Figure 77: Middle East & Africa Hong Kong E-commerce Industry Revenue Share (%), by Consumer Electronics 2025 & 2033
- Figure 78: Middle East & Africa Hong Kong E-commerce Industry Revenue (billion), by Fashion and Apparel 2025 & 2033
- Figure 79: Middle East & Africa Hong Kong E-commerce Industry Revenue Share (%), by Fashion and Apparel 2025 & 2033
- Figure 80: Middle East & Africa Hong Kong E-commerce Industry Revenue (billion), by Food and Beverage 2025 & 2033
- Figure 81: Middle East & Africa Hong Kong E-commerce Industry Revenue Share (%), by Food and Beverage 2025 & 2033
- Figure 82: Middle East & Africa Hong Kong E-commerce Industry Revenue (billion), by Furniture and Home 2025 & 2033
- Figure 83: Middle East & Africa Hong Kong E-commerce Industry Revenue Share (%), by Furniture and Home 2025 & 2033
- Figure 84: Middle East & Africa Hong Kong E-commerce Industry Revenue (billion), by Others (Toys, DIY, Media, etc.) 2025 & 2033
- Figure 85: Middle East & Africa Hong Kong E-commerce Industry Revenue Share (%), by Others (Toys, DIY, Media, etc.) 2025 & 2033
- Figure 86: Middle East & Africa Hong Kong E-commerce Industry Revenue (billion), by B2B ecommerce 2025 & 2033
- Figure 87: Middle East & Africa Hong Kong E-commerce Industry Revenue Share (%), by B2B ecommerce 2025 & 2033
- Figure 88: Middle East & Africa Hong Kong E-commerce Industry Revenue (billion), by Country 2025 & 2033
- Figure 89: Middle East & Africa Hong Kong E-commerce Industry Revenue Share (%), by Country 2025 & 2033
- Figure 90: Asia Pacific Hong Kong E-commerce Industry Revenue (billion), by B2C ecommerce 2025 & 2033
- Figure 91: Asia Pacific Hong Kong E-commerce Industry Revenue Share (%), by B2C ecommerce 2025 & 2033
- Figure 92: Asia Pacific Hong Kong E-commerce Industry Revenue (billion), by Market size (GMV) for the period of 2017-2027 2025 & 2033
- Figure 93: Asia Pacific Hong Kong E-commerce Industry Revenue Share (%), by Market size (GMV) for the period of 2017-2027 2025 & 2033
- Figure 94: Asia Pacific Hong Kong E-commerce Industry Revenue (billion), by Application 2025 & 2033
- Figure 95: Asia Pacific Hong Kong E-commerce Industry Revenue Share (%), by Application 2025 & 2033
- Figure 96: Asia Pacific Hong Kong E-commerce Industry Revenue (billion), by Beauty and Personal Care 2025 & 2033
- Figure 97: Asia Pacific Hong Kong E-commerce Industry Revenue Share (%), by Beauty and Personal Care 2025 & 2033
- Figure 98: Asia Pacific Hong Kong E-commerce Industry Revenue (billion), by Consumer Electronics 2025 & 2033
- Figure 99: Asia Pacific Hong Kong E-commerce Industry Revenue Share (%), by Consumer Electronics 2025 & 2033
- Figure 100: Asia Pacific Hong Kong E-commerce Industry Revenue (billion), by Fashion and Apparel 2025 & 2033
- Figure 101: Asia Pacific Hong Kong E-commerce Industry Revenue Share (%), by Fashion and Apparel 2025 & 2033
- Figure 102: Asia Pacific Hong Kong E-commerce Industry Revenue (billion), by Food and Beverage 2025 & 2033
- Figure 103: Asia Pacific Hong Kong E-commerce Industry Revenue Share (%), by Food and Beverage 2025 & 2033
- Figure 104: Asia Pacific Hong Kong E-commerce Industry Revenue (billion), by Furniture and Home 2025 & 2033
- Figure 105: Asia Pacific Hong Kong E-commerce Industry Revenue Share (%), by Furniture and Home 2025 & 2033
- Figure 106: Asia Pacific Hong Kong E-commerce Industry Revenue (billion), by Others (Toys, DIY, Media, etc.) 2025 & 2033
- Figure 107: Asia Pacific Hong Kong E-commerce Industry Revenue Share (%), by Others (Toys, DIY, Media, etc.) 2025 & 2033
- Figure 108: Asia Pacific Hong Kong E-commerce Industry Revenue (billion), by B2B ecommerce 2025 & 2033
- Figure 109: Asia Pacific Hong Kong E-commerce Industry Revenue Share (%), by B2B ecommerce 2025 & 2033
- Figure 110: Asia Pacific Hong Kong E-commerce Industry Revenue (billion), by Country 2025 & 2033
- Figure 111: Asia Pacific Hong Kong E-commerce Industry Revenue Share (%), by Country 2025 & 2033
List of Tables
- Table 1: Global Hong Kong E-commerce Industry Revenue billion Forecast, by B2C ecommerce 2020 & 2033
- Table 2: Global Hong Kong E-commerce Industry Revenue billion Forecast, by Market size (GMV) for the period of 2017-2027 2020 & 2033
- Table 3: Global Hong Kong E-commerce Industry Revenue billion Forecast, by Application 2020 & 2033
- Table 4: Global Hong Kong E-commerce Industry Revenue billion Forecast, by Beauty and Personal Care 2020 & 2033
- Table 5: Global Hong Kong E-commerce Industry Revenue billion Forecast, by Consumer Electronics 2020 & 2033
- Table 6: Global Hong Kong E-commerce Industry Revenue billion Forecast, by Fashion and Apparel 2020 & 2033
- Table 7: Global Hong Kong E-commerce Industry Revenue billion Forecast, by Food and Beverage 2020 & 2033
- Table 8: Global Hong Kong E-commerce Industry Revenue billion Forecast, by Furniture and Home 2020 & 2033
- Table 9: Global Hong Kong E-commerce Industry Revenue billion Forecast, by Others (Toys, DIY, Media, etc.) 2020 & 2033
- Table 10: Global Hong Kong E-commerce Industry Revenue billion Forecast, by B2B ecommerce 2020 & 2033
- Table 11: Global Hong Kong E-commerce Industry Revenue billion Forecast, by Region 2020 & 2033
- Table 12: Global Hong Kong E-commerce Industry Revenue billion Forecast, by B2C ecommerce 2020 & 2033
- Table 13: Global Hong Kong E-commerce Industry Revenue billion Forecast, by Market size (GMV) for the period of 2017-2027 2020 & 2033
- Table 14: Global Hong Kong E-commerce Industry Revenue billion Forecast, by Application 2020 & 2033
- Table 15: Global Hong Kong E-commerce Industry Revenue billion Forecast, by Beauty and Personal Care 2020 & 2033
- Table 16: Global Hong Kong E-commerce Industry Revenue billion Forecast, by Consumer Electronics 2020 & 2033
- Table 17: Global Hong Kong E-commerce Industry Revenue billion Forecast, by Fashion and Apparel 2020 & 2033
- Table 18: Global Hong Kong E-commerce Industry Revenue billion Forecast, by Food and Beverage 2020 & 2033
- Table 19: Global Hong Kong E-commerce Industry Revenue billion Forecast, by Furniture and Home 2020 & 2033
- Table 20: Global Hong Kong E-commerce Industry Revenue billion Forecast, by Others (Toys, DIY, Media, etc.) 2020 & 2033
- Table 21: Global Hong Kong E-commerce Industry Revenue billion Forecast, by B2B ecommerce 2020 & 2033
- Table 22: Global Hong Kong E-commerce Industry Revenue billion Forecast, by Country 2020 & 2033
- Table 23: United States Hong Kong E-commerce Industry Revenue (billion) Forecast, by Application 2020 & 2033
- Table 24: Canada Hong Kong E-commerce Industry Revenue (billion) Forecast, by Application 2020 & 2033
- Table 25: Mexico Hong Kong E-commerce Industry Revenue (billion) Forecast, by Application 2020 & 2033
- Table 26: Global Hong Kong E-commerce Industry Revenue billion Forecast, by B2C ecommerce 2020 & 2033
- Table 27: Global Hong Kong E-commerce Industry Revenue billion Forecast, by Market size (GMV) for the period of 2017-2027 2020 & 2033
- Table 28: Global Hong Kong E-commerce Industry Revenue billion Forecast, by Application 2020 & 2033
- Table 29: Global Hong Kong E-commerce Industry Revenue billion Forecast, by Beauty and Personal Care 2020 & 2033
- Table 30: Global Hong Kong E-commerce Industry Revenue billion Forecast, by Consumer Electronics 2020 & 2033
- Table 31: Global Hong Kong E-commerce Industry Revenue billion Forecast, by Fashion and Apparel 2020 & 2033
- Table 32: Global Hong Kong E-commerce Industry Revenue billion Forecast, by Food and Beverage 2020 & 2033
- Table 33: Global Hong Kong E-commerce Industry Revenue billion Forecast, by Furniture and Home 2020 & 2033
- Table 34: Global Hong Kong E-commerce Industry Revenue billion Forecast, by Others (Toys, DIY, Media, etc.) 2020 & 2033
- Table 35: Global Hong Kong E-commerce Industry Revenue billion Forecast, by B2B ecommerce 2020 & 2033
- Table 36: Global Hong Kong E-commerce Industry Revenue billion Forecast, by Country 2020 & 2033
- Table 37: Brazil Hong Kong E-commerce Industry Revenue (billion) Forecast, by Application 2020 & 2033
- Table 38: Argentina Hong Kong E-commerce Industry Revenue (billion) Forecast, by Application 2020 & 2033
- Table 39: Rest of South America Hong Kong E-commerce Industry Revenue (billion) Forecast, by Application 2020 & 2033
- Table 40: Global Hong Kong E-commerce Industry Revenue billion Forecast, by B2C ecommerce 2020 & 2033
- Table 41: Global Hong Kong E-commerce Industry Revenue billion Forecast, by Market size (GMV) for the period of 2017-2027 2020 & 2033
- Table 42: Global Hong Kong E-commerce Industry Revenue billion Forecast, by Application 2020 & 2033
- Table 43: Global Hong Kong E-commerce Industry Revenue billion Forecast, by Beauty and Personal Care 2020 & 2033
- Table 44: Global Hong Kong E-commerce Industry Revenue billion Forecast, by Consumer Electronics 2020 & 2033
- Table 45: Global Hong Kong E-commerce Industry Revenue billion Forecast, by Fashion and Apparel 2020 & 2033
- Table 46: Global Hong Kong E-commerce Industry Revenue billion Forecast, by Food and Beverage 2020 & 2033
- Table 47: Global Hong Kong E-commerce Industry Revenue billion Forecast, by Furniture and Home 2020 & 2033
- Table 48: Global Hong Kong E-commerce Industry Revenue billion Forecast, by Others (Toys, DIY, Media, etc.) 2020 & 2033
- Table 49: Global Hong Kong E-commerce Industry Revenue billion Forecast, by B2B ecommerce 2020 & 2033
- Table 50: Global Hong Kong E-commerce Industry Revenue billion Forecast, by Country 2020 & 2033
- Table 51: United Kingdom Hong Kong E-commerce Industry Revenue (billion) Forecast, by Application 2020 & 2033
- Table 52: Germany Hong Kong E-commerce Industry Revenue (billion) Forecast, by Application 2020 & 2033
- Table 53: France Hong Kong E-commerce Industry Revenue (billion) Forecast, by Application 2020 & 2033
- Table 54: Italy Hong Kong E-commerce Industry Revenue (billion) Forecast, by Application 2020 & 2033
- Table 55: Spain Hong Kong E-commerce Industry Revenue (billion) Forecast, by Application 2020 & 2033
- Table 56: Russia Hong Kong E-commerce Industry Revenue (billion) Forecast, by Application 2020 & 2033
- Table 57: Benelux Hong Kong E-commerce Industry Revenue (billion) Forecast, by Application 2020 & 2033
- Table 58: Nordics Hong Kong E-commerce Industry Revenue (billion) Forecast, by Application 2020 & 2033
- Table 59: Rest of Europe Hong Kong E-commerce Industry Revenue (billion) Forecast, by Application 2020 & 2033
- Table 60: Global Hong Kong E-commerce Industry Revenue billion Forecast, by B2C ecommerce 2020 & 2033
- Table 61: Global Hong Kong E-commerce Industry Revenue billion Forecast, by Market size (GMV) for the period of 2017-2027 2020 & 2033
- Table 62: Global Hong Kong E-commerce Industry Revenue billion Forecast, by Application 2020 & 2033
- Table 63: Global Hong Kong E-commerce Industry Revenue billion Forecast, by Beauty and Personal Care 2020 & 2033
- Table 64: Global Hong Kong E-commerce Industry Revenue billion Forecast, by Consumer Electronics 2020 & 2033
- Table 65: Global Hong Kong E-commerce Industry Revenue billion Forecast, by Fashion and Apparel 2020 & 2033
- Table 66: Global Hong Kong E-commerce Industry Revenue billion Forecast, by Food and Beverage 2020 & 2033
- Table 67: Global Hong Kong E-commerce Industry Revenue billion Forecast, by Furniture and Home 2020 & 2033
- Table 68: Global Hong Kong E-commerce Industry Revenue billion Forecast, by Others (Toys, DIY, Media, etc.) 2020 & 2033
- Table 69: Global Hong Kong E-commerce Industry Revenue billion Forecast, by B2B ecommerce 2020 & 2033
- Table 70: Global Hong Kong E-commerce Industry Revenue billion Forecast, by Country 2020 & 2033
- Table 71: Turkey Hong Kong E-commerce Industry Revenue (billion) Forecast, by Application 2020 & 2033
- Table 72: Israel Hong Kong E-commerce Industry Revenue (billion) Forecast, by Application 2020 & 2033
- Table 73: GCC Hong Kong E-commerce Industry Revenue (billion) Forecast, by Application 2020 & 2033
- Table 74: North Africa Hong Kong E-commerce Industry Revenue (billion) Forecast, by Application 2020 & 2033
- Table 75: South Africa Hong Kong E-commerce Industry Revenue (billion) Forecast, by Application 2020 & 2033
- Table 76: Rest of Middle East & Africa Hong Kong E-commerce Industry Revenue (billion) Forecast, by Application 2020 & 2033
- Table 77: Global Hong Kong E-commerce Industry Revenue billion Forecast, by B2C ecommerce 2020 & 2033
- Table 78: Global Hong Kong E-commerce Industry Revenue billion Forecast, by Market size (GMV) for the period of 2017-2027 2020 & 2033
- Table 79: Global Hong Kong E-commerce Industry Revenue billion Forecast, by Application 2020 & 2033
- Table 80: Global Hong Kong E-commerce Industry Revenue billion Forecast, by Beauty and Personal Care 2020 & 2033
- Table 81: Global Hong Kong E-commerce Industry Revenue billion Forecast, by Consumer Electronics 2020 & 2033
- Table 82: Global Hong Kong E-commerce Industry Revenue billion Forecast, by Fashion and Apparel 2020 & 2033
- Table 83: Global Hong Kong E-commerce Industry Revenue billion Forecast, by Food and Beverage 2020 & 2033
- Table 84: Global Hong Kong E-commerce Industry Revenue billion Forecast, by Furniture and Home 2020 & 2033
- Table 85: Global Hong Kong E-commerce Industry Revenue billion Forecast, by Others (Toys, DIY, Media, etc.) 2020 & 2033
- Table 86: Global Hong Kong E-commerce Industry Revenue billion Forecast, by B2B ecommerce 2020 & 2033
- Table 87: Global Hong Kong E-commerce Industry Revenue billion Forecast, by Country 2020 & 2033
- Table 88: China Hong Kong E-commerce Industry Revenue (billion) Forecast, by Application 2020 & 2033
- Table 89: India Hong Kong E-commerce Industry Revenue (billion) Forecast, by Application 2020 & 2033
- Table 90: Japan Hong Kong E-commerce Industry Revenue (billion) Forecast, by Application 2020 & 2033
- Table 91: South Korea Hong Kong E-commerce Industry Revenue (billion) Forecast, by Application 2020 & 2033
- Table 92: ASEAN Hong Kong E-commerce Industry Revenue (billion) Forecast, by Application 2020 & 2033
- Table 93: Oceania Hong Kong E-commerce Industry Revenue (billion) Forecast, by Application 2020 & 2033
- Table 94: Rest of Asia Pacific Hong Kong E-commerce Industry Revenue (billion) Forecast, by Application 2020 & 2033
Frequently Asked Questions
1. What is the projected Compound Annual Growth Rate (CAGR) of the Hong Kong E-commerce Industry?
The projected CAGR is approximately 7.87%.
2. Which companies are prominent players in the Hong Kong E-commerce Industry?
Key companies in the market include JD com Inc, PARKnSHOP (HK) Limited, Carousell Group*List Not Exhaustive, MUJI (Hong Kong) Co Ltd, Price Guide Sdn Bhd, Amazon com Inc, Alibaba Group, Hong Kong TV Shopping Network Limited, eBay Inc, WeChat Pay Hong Kong Limited.
3. What are the main segments of the Hong Kong E-commerce Industry?
The market segments include B2C ecommerce, Market size (GMV) for the period of 2017-2027, Application, Beauty and Personal Care, Consumer Electronics, Fashion and Apparel, Food and Beverage, Furniture and Home, Others (Toys, DIY, Media, etc.), B2B ecommerce.
4. Can you provide details about the market size?
The market size is estimated to be USD 5.34 billion as of 2022.
5. What are some drivers contributing to market growth?
Increase in adoption of digitalization; Adoption of Omnichannel Innovative Solutions.
6. What are the notable trends driving market growth?
Increase in Internet Penetration Across the Country is Fueling the Growth of the Market.
7. Are there any restraints impacting market growth?
High Initial Cost of Installation.
8. Can you provide examples of recent developments in the market?
May 2022 - YesAsia, a global online retailer, announced a partnership with Geek+, an autonomous robots company, to build YesAsia's first smart warehouse at Goodman Interlink, located in Tsing Yi, Hong Kong.
9. What pricing options are available for accessing the report?
Pricing options include single-user, multi-user, and enterprise licenses priced at USD 3800, USD 4500, and USD 5800 respectively.
10. Is the market size provided in terms of value or volume?
The market size is provided in terms of value, measured in billion.
11. Are there any specific market keywords associated with the report?
Yes, the market keyword associated with the report is "Hong Kong E-commerce Industry," which aids in identifying and referencing the specific market segment covered.
12. How do I determine which pricing option suits my needs best?
The pricing options vary based on user requirements and access needs. Individual users may opt for single-user licenses, while businesses requiring broader access may choose multi-user or enterprise licenses for cost-effective access to the report.
13. Are there any additional resources or data provided in the Hong Kong E-commerce Industry report?
While the report offers comprehensive insights, it's advisable to review the specific contents or supplementary materials provided to ascertain if additional resources or data are available.
14. How can I stay updated on further developments or reports in the Hong Kong E-commerce Industry?
To stay informed about further developments, trends, and reports in the Hong Kong E-commerce Industry, consider subscribing to industry newsletters, following relevant companies and organizations, or regularly checking reputable industry news sources and publications.
Methodology
Step 1 - Identification of Relevant Samples Size from Population Database


Step 2 - Approaches for Defining Global Market Size (Value, Volume* & Price*)

Note*: In applicable scenarios
Step 3 - Data Sources
Primary Research
- Web Analytics
- Survey Reports
- Research Institute
- Latest Research Reports
- Opinion Leaders
Secondary Research
- Annual Reports
- White Paper
- Latest Press Release
- Industry Association
- Paid Database
- Investor Presentations

Step 4 - Data Triangulation
Involves using different sources of information in order to increase the validity of a study
These sources are likely to be stakeholders in a program - participants, other researchers, program staff, other community members, and so on.
Then we put all data in single framework & apply various statistical tools to find out the dynamic on the market.
During the analysis stage, feedback from the stakeholder groups would be compared to determine areas of agreement as well as areas of divergence