
Key Insights
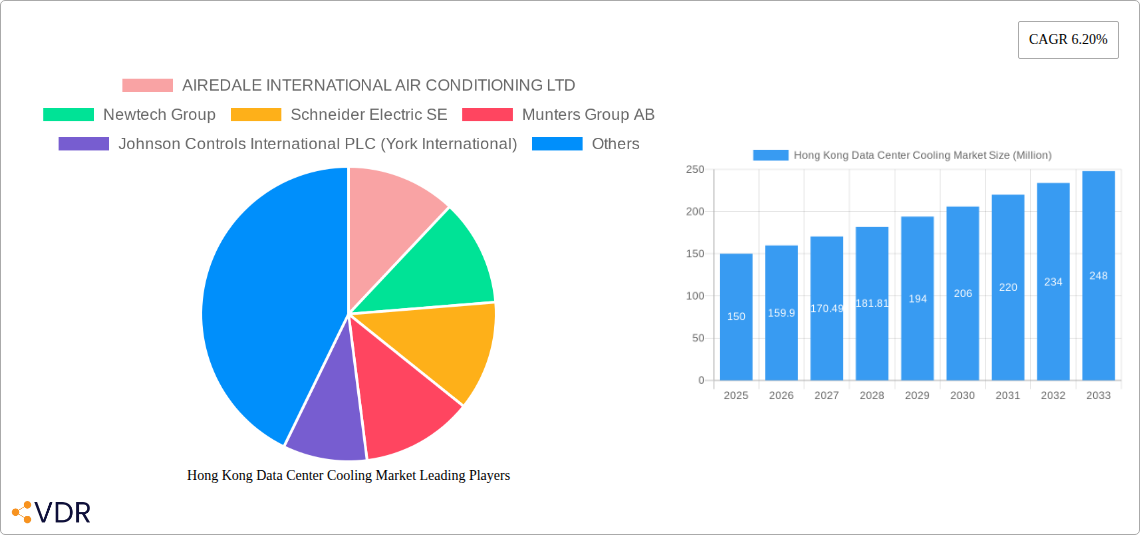
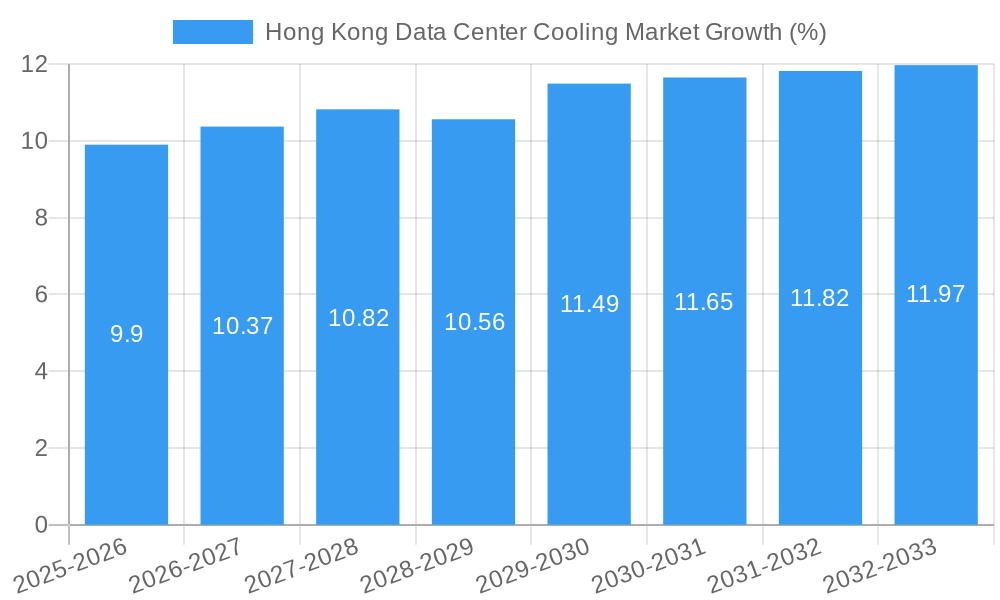
The Hong Kong data center cooling market, valued at approximately $150 million in 2025, is experiencing robust growth, projected to expand at a Compound Annual Growth Rate (CAGR) of 6.20% from 2025 to 2033. This expansion is fueled by the increasing demand for data storage and processing capabilities, driven by the burgeoning fintech sector, the growing adoption of cloud computing, and the expansion of 5G networks within Hong Kong. Key market trends include the rising adoption of energy-efficient cooling technologies like liquid-based cooling and evaporative cooling, aiming to reduce operational costs and environmental impact. The IT & Telecommunication sector is the largest end-user, followed by the BFSI (Banking, Financial Services, and Insurance) and Government sectors, which are increasingly investing in robust and reliable data center infrastructure. However, the market faces constraints such as high initial investment costs for advanced cooling systems and the limited availability of skilled labor for installation and maintenance. Major players such as Airedale, Schneider Electric, and Munters are competing through technological innovation and strategic partnerships to capture market share. The dominance of air-based cooling is gradually shifting towards more efficient alternatives, driven by increasing energy prices and sustainability concerns. The forecast period (2025-2033) anticipates significant growth across all segments, particularly within liquid-based cooling and the expanding BFSI sector.
The competitive landscape is marked by both international giants and local players. International companies bring advanced technologies and global expertise, while local firms benefit from strong regional market understanding and established partnerships. The market's future trajectory hinges on effective policy support for sustainable data center infrastructure, technological advancements in cooling solutions, and the continued growth of data-intensive industries in Hong Kong. This will drive further investment in data center expansion and propel the demand for efficient and reliable cooling systems. Addressing the constraints through skilled workforce development and incentivizing greener technologies will be pivotal in maximizing market potential over the forecast period.
Hong Kong Data Center Cooling Market: A Comprehensive Report (2019-2033)
This in-depth report provides a comprehensive analysis of the Hong Kong data center cooling market, encompassing market dynamics, growth trends, key players, and future outlook. The study period covers 2019-2033, with a base year of 2025 and a forecast period of 2025-2033. The report offers invaluable insights for industry professionals, investors, and stakeholders seeking to understand and capitalize on the opportunities within this rapidly evolving sector. Market values are presented in Million units.
Hong Kong Data Center Cooling Market Market Dynamics & Structure
The Hong Kong data center cooling market is characterized by a moderately concentrated landscape, with a few major players dominating alongside several smaller, specialized firms. Technological innovation, driven by the increasing demand for energy-efficient and sustainable cooling solutions, is a primary growth driver. Stringent environmental regulations in Hong Kong are pushing the adoption of greener technologies, influencing market dynamics. The market witnesses significant competition from established players and new entrants, particularly those offering advanced liquid cooling solutions. Furthermore, mergers and acquisitions (M&A) activity is relatively moderate, with xx deals recorded between 2019 and 2024, representing a xx% market share change.
- Market Concentration: Moderately concentrated, with top 5 players holding approximately xx% market share.
- Technological Innovation: Strong focus on liquid cooling, AI-driven optimization, and sustainable solutions.
- Regulatory Framework: Stringent environmental regulations promoting energy-efficient cooling technologies.
- Competitive Substitutes: Limited direct substitutes, but indirect competition from alternative cooling methods.
- End-User Demographics: Primarily driven by IT & Telecommunication, BFSI, and Government sectors.
- M&A Trends: Moderate activity, with xx major deals in the historical period (2019-2024).
Hong Kong Data Center Cooling Market Growth Trends & Insights
The Hong Kong data center cooling market experienced a Compound Annual Growth Rate (CAGR) of xx% during the historical period (2019-2024), reaching a market size of xx Million in 2024. This growth is attributed to the burgeoning data center infrastructure development, increasing data consumption, and rising adoption of cloud computing services. Technological disruptions, particularly the emergence of advanced liquid cooling technologies, are driving market transformation. The shift towards energy-efficient solutions is also influencing consumer behavior, leading to increased demand for sustainable cooling options. The market is expected to maintain a robust CAGR of xx% during the forecast period (2025-2033), reaching an estimated xx Million by 2033. Market penetration of liquid cooling solutions is projected to increase from xx% in 2024 to xx% by 2033.
Dominant Regions, Countries, or Segments in Hong Kong Data Center Cooling Market
The IT & Telecommunication sector is the dominant end-user segment, accounting for approximately xx% of the market share in 2024, driven by the rapid expansion of data centers and cloud infrastructure. Within cooling technologies, air-based cooling currently holds the largest market share (approximately xx%), but liquid-based cooling is witnessing the fastest growth, projected to capture a significant portion of the market by 2033. Hong Kong Island and Kowloon are the leading regions for data center development, benefiting from robust infrastructure and connectivity.
- Key Drivers for IT & Telecommunication: High data traffic, cloud computing expansion, and increasing demand for high-performance computing.
- Key Drivers for Liquid-based Cooling Growth: Energy efficiency, enhanced cooling capacity for high-density servers, and reduced carbon footprint.
- Geographic Dominance: Hong Kong Island and Kowloon, due to established infrastructure and connectivity.
Hong Kong Data Center Cooling Market Product Landscape
The market offers a diverse range of cooling solutions, including air-based, liquid-based, and evaporative cooling systems. Recent product innovations focus on improving energy efficiency, reducing water consumption, and enhancing cooling capacity for high-density server deployments. Key advancements include AI-powered cooling management systems, precision cooling technologies, and hybrid cooling solutions combining different approaches for optimal performance. Unique selling propositions frequently highlight features such as reduced PUE (Power Usage Effectiveness), improved reliability, and lower operational costs.
Key Drivers, Barriers & Challenges in Hong Kong Data Center Cooling Market
Key Drivers: Increasing data center density, stringent environmental regulations promoting energy-efficient solutions, and the growing adoption of cloud computing and AI.
Key Challenges: High initial investment costs for advanced cooling technologies, limited skilled labor for installation and maintenance, and competition from established players and new entrants. Supply chain disruptions, potentially impacting availability and cost of components, pose a further challenge.
Emerging Opportunities in Hong Kong Data Center Cooling Market
Emerging opportunities lie in the adoption of sustainable cooling solutions, the integration of AI and machine learning for optimized cooling management, and the expansion of cooling solutions into emerging sectors such as edge computing and IoT. Untapped markets exist in smaller data centers and colocation facilities. The rising demand for high-performance computing creates opportunities for specialized liquid cooling systems designed for high-density server environments.
Growth Accelerators in the Hong Kong Data Center Cooling Market Industry
Technological breakthroughs, particularly in liquid cooling and AI-driven optimization, are major growth accelerators. Strategic partnerships between data center operators and cooling technology providers are fostering innovation and market expansion. Government initiatives promoting sustainable infrastructure and digital transformation are creating a favorable environment for market growth.
Key Players Shaping the Hong Kong Data Center Cooling Market Market
- AIREDALE INTERNATIONAL AIR CONDITIONING LTD
- Newtech Group
- Schneider Electric SE
- Munters Group AB
- Johnson Controls International PLC (York International)
- Fujitsu General Limited
- Huawei Technologies Co Ltd
- OneAsia Network Limited
- Rittal GMBH & Co KG
- LiquidStack Holding B V
Notable Milestones in Hong Kong Data Center Cooling Market Sector
- December 2022: OVHcloud launched a hybrid liquid cooling technology, driving cost savings and sustainability.
- August 2022: OneAsia adopted Submer's Smartpod immersion cooling for AI and machine learning applications.
In-Depth Hong Kong Data Center Cooling Market Market Outlook
The Hong Kong data center cooling market is poised for continued strong growth, driven by increasing data center deployments, the adoption of advanced cooling technologies, and the emphasis on sustainability. Strategic opportunities exist for companies offering innovative, energy-efficient, and environmentally friendly cooling solutions. The market's future will be shaped by technological advancements, strategic collaborations, and government policies promoting sustainable development.
Hong Kong Data Center Cooling Market Segmentation
-
1. Cooling Technology
-
1.1. Air-based Cooling
- 1.1.1. Chiller and Economizer
- 1.1.2. CRAH
- 1.1.3. Cooling
- 1.1.4. Other Air-based Cooling Technologies
-
1.2. Liquid-based Cooling
- 1.2.1. Immersion Cooling
- 1.2.2. Direct-to-Chip Cooling
- 1.2.3. Rear-Door Heat Exchanger
-
1.1. Air-based Cooling
-
2. Type of Data Center
- 2.1. Hyperscale (Owned and Leased)
- 2.2. Enterprise (On-premise)
- 2.3. Colocation
-
3. End-user Industry
- 3.1. IT and Telecom
- 3.2. Retail and Consumer Goods
- 3.3. Healthcare
- 3.4. Media and Entertainment
- 3.5. Federal and Institutional Agencies
- 3.6. Other End-user Industries
Hong Kong Data Center Cooling Market Segmentation By Geography
-
1. North America
- 1.1. United States
- 1.2. Canada
- 1.3. Mexico
-
2. South America
- 2.1. Brazil
- 2.2. Argentina
- 2.3. Rest of South America
-
3. Europe
- 3.1. United Kingdom
- 3.2. Germany
- 3.3. France
- 3.4. Italy
- 3.5. Spain
- 3.6. Russia
- 3.7. Benelux
- 3.8. Nordics
- 3.9. Rest of Europe
-
4. Middle East & Africa
- 4.1. Turkey
- 4.2. Israel
- 4.3. GCC
- 4.4. North Africa
- 4.5. South Africa
- 4.6. Rest of Middle East & Africa
-
5. Asia Pacific
- 5.1. China
- 5.2. India
- 5.3. Japan
- 5.4. South Korea
- 5.5. ASEAN
- 5.6. Oceania
- 5.7. Rest of Asia Pacific
Hong Kong Data Center Cooling Market REPORT HIGHLIGHTS
| Aspects | Details |
|---|---|
| Study Period | 2019-2033 |
| Base Year | 2024 |
| Estimated Year | 2025 |
| Forecast Period | 2025-2033 |
| Historical Period | 2019-2024 |
| Growth Rate | CAGR of 6.20% from 2019-2033 |
| Segmentation |
|
Table of Contents
- 1. Introduction
- 1.1. Research Scope
- 1.2. Market Segmentation
- 1.3. Research Methodology
- 1.4. Definitions and Assumptions
- 2. Executive Summary
- 2.1. Introduction
- 3. Market Dynamics
- 3.1. Introduction
- 3.2. Market Drivers
- 3.2.1. Increasing Volume of Digital Data and Fiber Deployment; Emergence of Green Data Centers
- 3.3. Market Restrains
- 3.3.1. Adaptability Requirements and Power Outages
- 3.4. Market Trends
- 3.4.1. IT and Telecom to Hold Significant Share
- 4. Market Factor Analysis
- 4.1. Porters Five Forces
- 4.2. Supply/Value Chain
- 4.3. PESTEL analysis
- 4.4. Market Entropy
- 4.5. Patent/Trademark Analysis
- 5. Global Hong Kong Data Center Cooling Market Analysis, Insights and Forecast, 2019-2031
- 5.1. Market Analysis, Insights and Forecast - by Cooling Technology
- 5.1.1. Air-based Cooling
- 5.1.1.1. Chiller and Economizer
- 5.1.1.2. CRAH
- 5.1.1.3. Cooling
- 5.1.1.4. Other Air-based Cooling Technologies
- 5.1.2. Liquid-based Cooling
- 5.1.2.1. Immersion Cooling
- 5.1.2.2. Direct-to-Chip Cooling
- 5.1.2.3. Rear-Door Heat Exchanger
- 5.1.1. Air-based Cooling
- 5.2. Market Analysis, Insights and Forecast - by Type of Data Center
- 5.2.1. Hyperscale (Owned and Leased)
- 5.2.2. Enterprise (On-premise)
- 5.2.3. Colocation
- 5.3. Market Analysis, Insights and Forecast - by End-user Industry
- 5.3.1. IT and Telecom
- 5.3.2. Retail and Consumer Goods
- 5.3.3. Healthcare
- 5.3.4. Media and Entertainment
- 5.3.5. Federal and Institutional Agencies
- 5.3.6. Other End-user Industries
- 5.4. Market Analysis, Insights and Forecast - by Region
- 5.4.1. North America
- 5.4.2. South America
- 5.4.3. Europe
- 5.4.4. Middle East & Africa
- 5.4.5. Asia Pacific
- 5.1. Market Analysis, Insights and Forecast - by Cooling Technology
- 6. North America Hong Kong Data Center Cooling Market Analysis, Insights and Forecast, 2019-2031
- 6.1. Market Analysis, Insights and Forecast - by Cooling Technology
- 6.1.1. Air-based Cooling
- 6.1.1.1. Chiller and Economizer
- 6.1.1.2. CRAH
- 6.1.1.3. Cooling
- 6.1.1.4. Other Air-based Cooling Technologies
- 6.1.2. Liquid-based Cooling
- 6.1.2.1. Immersion Cooling
- 6.1.2.2. Direct-to-Chip Cooling
- 6.1.2.3. Rear-Door Heat Exchanger
- 6.1.1. Air-based Cooling
- 6.2. Market Analysis, Insights and Forecast - by Type of Data Center
- 6.2.1. Hyperscale (Owned and Leased)
- 6.2.2. Enterprise (On-premise)
- 6.2.3. Colocation
- 6.3. Market Analysis, Insights and Forecast - by End-user Industry
- 6.3.1. IT and Telecom
- 6.3.2. Retail and Consumer Goods
- 6.3.3. Healthcare
- 6.3.4. Media and Entertainment
- 6.3.5. Federal and Institutional Agencies
- 6.3.6. Other End-user Industries
- 6.1. Market Analysis, Insights and Forecast - by Cooling Technology
- 7. South America Hong Kong Data Center Cooling Market Analysis, Insights and Forecast, 2019-2031
- 7.1. Market Analysis, Insights and Forecast - by Cooling Technology
- 7.1.1. Air-based Cooling
- 7.1.1.1. Chiller and Economizer
- 7.1.1.2. CRAH
- 7.1.1.3. Cooling
- 7.1.1.4. Other Air-based Cooling Technologies
- 7.1.2. Liquid-based Cooling
- 7.1.2.1. Immersion Cooling
- 7.1.2.2. Direct-to-Chip Cooling
- 7.1.2.3. Rear-Door Heat Exchanger
- 7.1.1. Air-based Cooling
- 7.2. Market Analysis, Insights and Forecast - by Type of Data Center
- 7.2.1. Hyperscale (Owned and Leased)
- 7.2.2. Enterprise (On-premise)
- 7.2.3. Colocation
- 7.3. Market Analysis, Insights and Forecast - by End-user Industry
- 7.3.1. IT and Telecom
- 7.3.2. Retail and Consumer Goods
- 7.3.3. Healthcare
- 7.3.4. Media and Entertainment
- 7.3.5. Federal and Institutional Agencies
- 7.3.6. Other End-user Industries
- 7.1. Market Analysis, Insights and Forecast - by Cooling Technology
- 8. Europe Hong Kong Data Center Cooling Market Analysis, Insights and Forecast, 2019-2031
- 8.1. Market Analysis, Insights and Forecast - by Cooling Technology
- 8.1.1. Air-based Cooling
- 8.1.1.1. Chiller and Economizer
- 8.1.1.2. CRAH
- 8.1.1.3. Cooling
- 8.1.1.4. Other Air-based Cooling Technologies
- 8.1.2. Liquid-based Cooling
- 8.1.2.1. Immersion Cooling
- 8.1.2.2. Direct-to-Chip Cooling
- 8.1.2.3. Rear-Door Heat Exchanger
- 8.1.1. Air-based Cooling
- 8.2. Market Analysis, Insights and Forecast - by Type of Data Center
- 8.2.1. Hyperscale (Owned and Leased)
- 8.2.2. Enterprise (On-premise)
- 8.2.3. Colocation
- 8.3. Market Analysis, Insights and Forecast - by End-user Industry
- 8.3.1. IT and Telecom
- 8.3.2. Retail and Consumer Goods
- 8.3.3. Healthcare
- 8.3.4. Media and Entertainment
- 8.3.5. Federal and Institutional Agencies
- 8.3.6. Other End-user Industries
- 8.1. Market Analysis, Insights and Forecast - by Cooling Technology
- 9. Middle East & Africa Hong Kong Data Center Cooling Market Analysis, Insights and Forecast, 2019-2031
- 9.1. Market Analysis, Insights and Forecast - by Cooling Technology
- 9.1.1. Air-based Cooling
- 9.1.1.1. Chiller and Economizer
- 9.1.1.2. CRAH
- 9.1.1.3. Cooling
- 9.1.1.4. Other Air-based Cooling Technologies
- 9.1.2. Liquid-based Cooling
- 9.1.2.1. Immersion Cooling
- 9.1.2.2. Direct-to-Chip Cooling
- 9.1.2.3. Rear-Door Heat Exchanger
- 9.1.1. Air-based Cooling
- 9.2. Market Analysis, Insights and Forecast - by Type of Data Center
- 9.2.1. Hyperscale (Owned and Leased)
- 9.2.2. Enterprise (On-premise)
- 9.2.3. Colocation
- 9.3. Market Analysis, Insights and Forecast - by End-user Industry
- 9.3.1. IT and Telecom
- 9.3.2. Retail and Consumer Goods
- 9.3.3. Healthcare
- 9.3.4. Media and Entertainment
- 9.3.5. Federal and Institutional Agencies
- 9.3.6. Other End-user Industries
- 9.1. Market Analysis, Insights and Forecast - by Cooling Technology
- 10. Asia Pacific Hong Kong Data Center Cooling Market Analysis, Insights and Forecast, 2019-2031
- 10.1. Market Analysis, Insights and Forecast - by Cooling Technology
- 10.1.1. Air-based Cooling
- 10.1.1.1. Chiller and Economizer
- 10.1.1.2. CRAH
- 10.1.1.3. Cooling
- 10.1.1.4. Other Air-based Cooling Technologies
- 10.1.2. Liquid-based Cooling
- 10.1.2.1. Immersion Cooling
- 10.1.2.2. Direct-to-Chip Cooling
- 10.1.2.3. Rear-Door Heat Exchanger
- 10.1.1. Air-based Cooling
- 10.2. Market Analysis, Insights and Forecast - by Type of Data Center
- 10.2.1. Hyperscale (Owned and Leased)
- 10.2.2. Enterprise (On-premise)
- 10.2.3. Colocation
- 10.3. Market Analysis, Insights and Forecast - by End-user Industry
- 10.3.1. IT and Telecom
- 10.3.2. Retail and Consumer Goods
- 10.3.3. Healthcare
- 10.3.4. Media and Entertainment
- 10.3.5. Federal and Institutional Agencies
- 10.3.6. Other End-user Industries
- 10.1. Market Analysis, Insights and Forecast - by Cooling Technology
- 11. Competitive Analysis
- 11.1. Global Market Share Analysis 2024
- 11.2. Company Profiles
- 11.2.1 AIREDALE INTERNATIONAL AIR CONDITIONING LTD
- 11.2.1.1. Overview
- 11.2.1.2. Products
- 11.2.1.3. SWOT Analysis
- 11.2.1.4. Recent Developments
- 11.2.1.5. Financials (Based on Availability)
- 11.2.2 Newtech Group
- 11.2.2.1. Overview
- 11.2.2.2. Products
- 11.2.2.3. SWOT Analysis
- 11.2.2.4. Recent Developments
- 11.2.2.5. Financials (Based on Availability)
- 11.2.3 Schneider Electric SE
- 11.2.3.1. Overview
- 11.2.3.2. Products
- 11.2.3.3. SWOT Analysis
- 11.2.3.4. Recent Developments
- 11.2.3.5. Financials (Based on Availability)
- 11.2.4 Munters Group AB
- 11.2.4.1. Overview
- 11.2.4.2. Products
- 11.2.4.3. SWOT Analysis
- 11.2.4.4. Recent Developments
- 11.2.4.5. Financials (Based on Availability)
- 11.2.5 Johnson Controls International PLC (York International)
- 11.2.5.1. Overview
- 11.2.5.2. Products
- 11.2.5.3. SWOT Analysis
- 11.2.5.4. Recent Developments
- 11.2.5.5. Financials (Based on Availability)
- 11.2.6 Fujitsu General Limited
- 11.2.6.1. Overview
- 11.2.6.2. Products
- 11.2.6.3. SWOT Analysis
- 11.2.6.4. Recent Developments
- 11.2.6.5. Financials (Based on Availability)
- 11.2.7 Huawei Technologies Co Ltd
- 11.2.7.1. Overview
- 11.2.7.2. Products
- 11.2.7.3. SWOT Analysis
- 11.2.7.4. Recent Developments
- 11.2.7.5. Financials (Based on Availability)
- 11.2.8 OneAsia Network Limited
- 11.2.8.1. Overview
- 11.2.8.2. Products
- 11.2.8.3. SWOT Analysis
- 11.2.8.4. Recent Developments
- 11.2.8.5. Financials (Based on Availability)
- 11.2.9 Rittal GMBH & Co KG*List Not Exhaustive
- 11.2.9.1. Overview
- 11.2.9.2. Products
- 11.2.9.3. SWOT Analysis
- 11.2.9.4. Recent Developments
- 11.2.9.5. Financials (Based on Availability)
- 11.2.10 LiquidStack Holding B V
- 11.2.10.1. Overview
- 11.2.10.2. Products
- 11.2.10.3. SWOT Analysis
- 11.2.10.4. Recent Developments
- 11.2.10.5. Financials (Based on Availability)
- 11.2.1 AIREDALE INTERNATIONAL AIR CONDITIONING LTD
List of Figures
- Figure 1: Global Hong Kong Data Center Cooling Market Revenue Breakdown (Million, %) by Region 2024 & 2032
- Figure 2: Hong Kong Hong Kong Data Center Cooling Market Revenue (Million), by Country 2024 & 2032
- Figure 3: Hong Kong Hong Kong Data Center Cooling Market Revenue Share (%), by Country 2024 & 2032
- Figure 4: North America Hong Kong Data Center Cooling Market Revenue (Million), by Cooling Technology 2024 & 2032
- Figure 5: North America Hong Kong Data Center Cooling Market Revenue Share (%), by Cooling Technology 2024 & 2032
- Figure 6: North America Hong Kong Data Center Cooling Market Revenue (Million), by Type of Data Center 2024 & 2032
- Figure 7: North America Hong Kong Data Center Cooling Market Revenue Share (%), by Type of Data Center 2024 & 2032
- Figure 8: North America Hong Kong Data Center Cooling Market Revenue (Million), by End-user Industry 2024 & 2032
- Figure 9: North America Hong Kong Data Center Cooling Market Revenue Share (%), by End-user Industry 2024 & 2032
- Figure 10: North America Hong Kong Data Center Cooling Market Revenue (Million), by Country 2024 & 2032
- Figure 11: North America Hong Kong Data Center Cooling Market Revenue Share (%), by Country 2024 & 2032
- Figure 12: South America Hong Kong Data Center Cooling Market Revenue (Million), by Cooling Technology 2024 & 2032
- Figure 13: South America Hong Kong Data Center Cooling Market Revenue Share (%), by Cooling Technology 2024 & 2032
- Figure 14: South America Hong Kong Data Center Cooling Market Revenue (Million), by Type of Data Center 2024 & 2032
- Figure 15: South America Hong Kong Data Center Cooling Market Revenue Share (%), by Type of Data Center 2024 & 2032
- Figure 16: South America Hong Kong Data Center Cooling Market Revenue (Million), by End-user Industry 2024 & 2032
- Figure 17: South America Hong Kong Data Center Cooling Market Revenue Share (%), by End-user Industry 2024 & 2032
- Figure 18: South America Hong Kong Data Center Cooling Market Revenue (Million), by Country 2024 & 2032
- Figure 19: South America Hong Kong Data Center Cooling Market Revenue Share (%), by Country 2024 & 2032
- Figure 20: Europe Hong Kong Data Center Cooling Market Revenue (Million), by Cooling Technology 2024 & 2032
- Figure 21: Europe Hong Kong Data Center Cooling Market Revenue Share (%), by Cooling Technology 2024 & 2032
- Figure 22: Europe Hong Kong Data Center Cooling Market Revenue (Million), by Type of Data Center 2024 & 2032
- Figure 23: Europe Hong Kong Data Center Cooling Market Revenue Share (%), by Type of Data Center 2024 & 2032
- Figure 24: Europe Hong Kong Data Center Cooling Market Revenue (Million), by End-user Industry 2024 & 2032
- Figure 25: Europe Hong Kong Data Center Cooling Market Revenue Share (%), by End-user Industry 2024 & 2032
- Figure 26: Europe Hong Kong Data Center Cooling Market Revenue (Million), by Country 2024 & 2032
- Figure 27: Europe Hong Kong Data Center Cooling Market Revenue Share (%), by Country 2024 & 2032
- Figure 28: Middle East & Africa Hong Kong Data Center Cooling Market Revenue (Million), by Cooling Technology 2024 & 2032
- Figure 29: Middle East & Africa Hong Kong Data Center Cooling Market Revenue Share (%), by Cooling Technology 2024 & 2032
- Figure 30: Middle East & Africa Hong Kong Data Center Cooling Market Revenue (Million), by Type of Data Center 2024 & 2032
- Figure 31: Middle East & Africa Hong Kong Data Center Cooling Market Revenue Share (%), by Type of Data Center 2024 & 2032
- Figure 32: Middle East & Africa Hong Kong Data Center Cooling Market Revenue (Million), by End-user Industry 2024 & 2032
- Figure 33: Middle East & Africa Hong Kong Data Center Cooling Market Revenue Share (%), by End-user Industry 2024 & 2032
- Figure 34: Middle East & Africa Hong Kong Data Center Cooling Market Revenue (Million), by Country 2024 & 2032
- Figure 35: Middle East & Africa Hong Kong Data Center Cooling Market Revenue Share (%), by Country 2024 & 2032
- Figure 36: Asia Pacific Hong Kong Data Center Cooling Market Revenue (Million), by Cooling Technology 2024 & 2032
- Figure 37: Asia Pacific Hong Kong Data Center Cooling Market Revenue Share (%), by Cooling Technology 2024 & 2032
- Figure 38: Asia Pacific Hong Kong Data Center Cooling Market Revenue (Million), by Type of Data Center 2024 & 2032
- Figure 39: Asia Pacific Hong Kong Data Center Cooling Market Revenue Share (%), by Type of Data Center 2024 & 2032
- Figure 40: Asia Pacific Hong Kong Data Center Cooling Market Revenue (Million), by End-user Industry 2024 & 2032
- Figure 41: Asia Pacific Hong Kong Data Center Cooling Market Revenue Share (%), by End-user Industry 2024 & 2032
- Figure 42: Asia Pacific Hong Kong Data Center Cooling Market Revenue (Million), by Country 2024 & 2032
- Figure 43: Asia Pacific Hong Kong Data Center Cooling Market Revenue Share (%), by Country 2024 & 2032
List of Tables
- Table 1: Global Hong Kong Data Center Cooling Market Revenue Million Forecast, by Region 2019 & 2032
- Table 2: Global Hong Kong Data Center Cooling Market Revenue Million Forecast, by Cooling Technology 2019 & 2032
- Table 3: Global Hong Kong Data Center Cooling Market Revenue Million Forecast, by Type of Data Center 2019 & 2032
- Table 4: Global Hong Kong Data Center Cooling Market Revenue Million Forecast, by End-user Industry 2019 & 2032
- Table 5: Global Hong Kong Data Center Cooling Market Revenue Million Forecast, by Region 2019 & 2032
- Table 6: Global Hong Kong Data Center Cooling Market Revenue Million Forecast, by Country 2019 & 2032
- Table 7: Global Hong Kong Data Center Cooling Market Revenue Million Forecast, by Cooling Technology 2019 & 2032
- Table 8: Global Hong Kong Data Center Cooling Market Revenue Million Forecast, by Type of Data Center 2019 & 2032
- Table 9: Global Hong Kong Data Center Cooling Market Revenue Million Forecast, by End-user Industry 2019 & 2032
- Table 10: Global Hong Kong Data Center Cooling Market Revenue Million Forecast, by Country 2019 & 2032
- Table 11: United States Hong Kong Data Center Cooling Market Revenue (Million) Forecast, by Application 2019 & 2032
- Table 12: Canada Hong Kong Data Center Cooling Market Revenue (Million) Forecast, by Application 2019 & 2032
- Table 13: Mexico Hong Kong Data Center Cooling Market Revenue (Million) Forecast, by Application 2019 & 2032
- Table 14: Global Hong Kong Data Center Cooling Market Revenue Million Forecast, by Cooling Technology 2019 & 2032
- Table 15: Global Hong Kong Data Center Cooling Market Revenue Million Forecast, by Type of Data Center 2019 & 2032
- Table 16: Global Hong Kong Data Center Cooling Market Revenue Million Forecast, by End-user Industry 2019 & 2032
- Table 17: Global Hong Kong Data Center Cooling Market Revenue Million Forecast, by Country 2019 & 2032
- Table 18: Brazil Hong Kong Data Center Cooling Market Revenue (Million) Forecast, by Application 2019 & 2032
- Table 19: Argentina Hong Kong Data Center Cooling Market Revenue (Million) Forecast, by Application 2019 & 2032
- Table 20: Rest of South America Hong Kong Data Center Cooling Market Revenue (Million) Forecast, by Application 2019 & 2032
- Table 21: Global Hong Kong Data Center Cooling Market Revenue Million Forecast, by Cooling Technology 2019 & 2032
- Table 22: Global Hong Kong Data Center Cooling Market Revenue Million Forecast, by Type of Data Center 2019 & 2032
- Table 23: Global Hong Kong Data Center Cooling Market Revenue Million Forecast, by End-user Industry 2019 & 2032
- Table 24: Global Hong Kong Data Center Cooling Market Revenue Million Forecast, by Country 2019 & 2032
- Table 25: United Kingdom Hong Kong Data Center Cooling Market Revenue (Million) Forecast, by Application 2019 & 2032
- Table 26: Germany Hong Kong Data Center Cooling Market Revenue (Million) Forecast, by Application 2019 & 2032
- Table 27: France Hong Kong Data Center Cooling Market Revenue (Million) Forecast, by Application 2019 & 2032
- Table 28: Italy Hong Kong Data Center Cooling Market Revenue (Million) Forecast, by Application 2019 & 2032
- Table 29: Spain Hong Kong Data Center Cooling Market Revenue (Million) Forecast, by Application 2019 & 2032
- Table 30: Russia Hong Kong Data Center Cooling Market Revenue (Million) Forecast, by Application 2019 & 2032
- Table 31: Benelux Hong Kong Data Center Cooling Market Revenue (Million) Forecast, by Application 2019 & 2032
- Table 32: Nordics Hong Kong Data Center Cooling Market Revenue (Million) Forecast, by Application 2019 & 2032
- Table 33: Rest of Europe Hong Kong Data Center Cooling Market Revenue (Million) Forecast, by Application 2019 & 2032
- Table 34: Global Hong Kong Data Center Cooling Market Revenue Million Forecast, by Cooling Technology 2019 & 2032
- Table 35: Global Hong Kong Data Center Cooling Market Revenue Million Forecast, by Type of Data Center 2019 & 2032
- Table 36: Global Hong Kong Data Center Cooling Market Revenue Million Forecast, by End-user Industry 2019 & 2032
- Table 37: Global Hong Kong Data Center Cooling Market Revenue Million Forecast, by Country 2019 & 2032
- Table 38: Turkey Hong Kong Data Center Cooling Market Revenue (Million) Forecast, by Application 2019 & 2032
- Table 39: Israel Hong Kong Data Center Cooling Market Revenue (Million) Forecast, by Application 2019 & 2032
- Table 40: GCC Hong Kong Data Center Cooling Market Revenue (Million) Forecast, by Application 2019 & 2032
- Table 41: North Africa Hong Kong Data Center Cooling Market Revenue (Million) Forecast, by Application 2019 & 2032
- Table 42: South Africa Hong Kong Data Center Cooling Market Revenue (Million) Forecast, by Application 2019 & 2032
- Table 43: Rest of Middle East & Africa Hong Kong Data Center Cooling Market Revenue (Million) Forecast, by Application 2019 & 2032
- Table 44: Global Hong Kong Data Center Cooling Market Revenue Million Forecast, by Cooling Technology 2019 & 2032
- Table 45: Global Hong Kong Data Center Cooling Market Revenue Million Forecast, by Type of Data Center 2019 & 2032
- Table 46: Global Hong Kong Data Center Cooling Market Revenue Million Forecast, by End-user Industry 2019 & 2032
- Table 47: Global Hong Kong Data Center Cooling Market Revenue Million Forecast, by Country 2019 & 2032
- Table 48: China Hong Kong Data Center Cooling Market Revenue (Million) Forecast, by Application 2019 & 2032
- Table 49: India Hong Kong Data Center Cooling Market Revenue (Million) Forecast, by Application 2019 & 2032
- Table 50: Japan Hong Kong Data Center Cooling Market Revenue (Million) Forecast, by Application 2019 & 2032
- Table 51: South Korea Hong Kong Data Center Cooling Market Revenue (Million) Forecast, by Application 2019 & 2032
- Table 52: ASEAN Hong Kong Data Center Cooling Market Revenue (Million) Forecast, by Application 2019 & 2032
- Table 53: Oceania Hong Kong Data Center Cooling Market Revenue (Million) Forecast, by Application 2019 & 2032
- Table 54: Rest of Asia Pacific Hong Kong Data Center Cooling Market Revenue (Million) Forecast, by Application 2019 & 2032
Frequently Asked Questions
1. What is the projected Compound Annual Growth Rate (CAGR) of the Hong Kong Data Center Cooling Market?
The projected CAGR is approximately 6.20%.
2. Which companies are prominent players in the Hong Kong Data Center Cooling Market?
Key companies in the market include AIREDALE INTERNATIONAL AIR CONDITIONING LTD, Newtech Group, Schneider Electric SE, Munters Group AB, Johnson Controls International PLC (York International), Fujitsu General Limited, Huawei Technologies Co Ltd, OneAsia Network Limited, Rittal GMBH & Co KG*List Not Exhaustive, LiquidStack Holding B V.
3. What are the main segments of the Hong Kong Data Center Cooling Market?
The market segments include Cooling Technology, Type of Data Center, End-user Industry.
4. Can you provide details about the market size?
The market size is estimated to be USD XX Million as of 2022.
5. What are some drivers contributing to market growth?
Increasing Volume of Digital Data and Fiber Deployment; Emergence of Green Data Centers.
6. What are the notable trends driving market growth?
IT and Telecom to Hold Significant Share.
7. Are there any restraints impacting market growth?
Adaptability Requirements and Power Outages.
8. Can you provide examples of recent developments in the market?
December 2022: OVHcloud introduced an innovative hybrid liquid cooling technology for its data centers. This groundbreaking approach not only contributes to cost savings for businesses but also promotes responsible data management while reducing their carbon footprint. OVHcloud's hybrid immersion liquid cooling technology seamlessly combines two cooling systems: a direct-to-chip water cooling system and a passive natural single-phase immersion cooling system.
9. What pricing options are available for accessing the report?
Pricing options include single-user, multi-user, and enterprise licenses priced at USD 3800, USD 4500, and USD 5800 respectively.
10. Is the market size provided in terms of value or volume?
The market size is provided in terms of value, measured in Million.
11. Are there any specific market keywords associated with the report?
Yes, the market keyword associated with the report is "Hong Kong Data Center Cooling Market," which aids in identifying and referencing the specific market segment covered.
12. How do I determine which pricing option suits my needs best?
The pricing options vary based on user requirements and access needs. Individual users may opt for single-user licenses, while businesses requiring broader access may choose multi-user or enterprise licenses for cost-effective access to the report.
13. Are there any additional resources or data provided in the Hong Kong Data Center Cooling Market report?
While the report offers comprehensive insights, it's advisable to review the specific contents or supplementary materials provided to ascertain if additional resources or data are available.
14. How can I stay updated on further developments or reports in the Hong Kong Data Center Cooling Market?
To stay informed about further developments, trends, and reports in the Hong Kong Data Center Cooling Market, consider subscribing to industry newsletters, following relevant companies and organizations, or regularly checking reputable industry news sources and publications.
Methodology
Step 1 - Identification of Relevant Samples Size from Population Database


Step 2 - Approaches for Defining Global Market Size (Value, Volume* & Price*)

Note*: In applicable scenarios
Step 3 - Data Sources
Primary Research
- Web Analytics
- Survey Reports
- Research Institute
- Latest Research Reports
- Opinion Leaders
Secondary Research
- Annual Reports
- White Paper
- Latest Press Release
- Industry Association
- Paid Database
- Investor Presentations

Step 4 - Data Triangulation
Involves using different sources of information in order to increase the validity of a study
These sources are likely to be stakeholders in a program - participants, other researchers, program staff, other community members, and so on.
Then we put all data in single framework & apply various statistical tools to find out the dynamic on the market.
During the analysis stage, feedback from the stakeholder groups would be compared to determine areas of agreement as well as areas of divergence


