
Key Insights
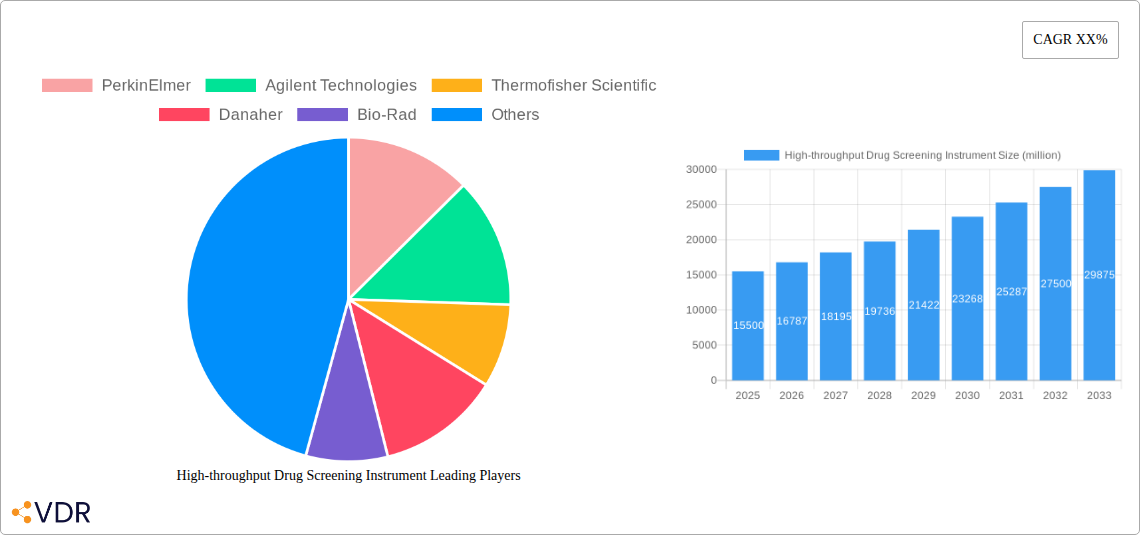
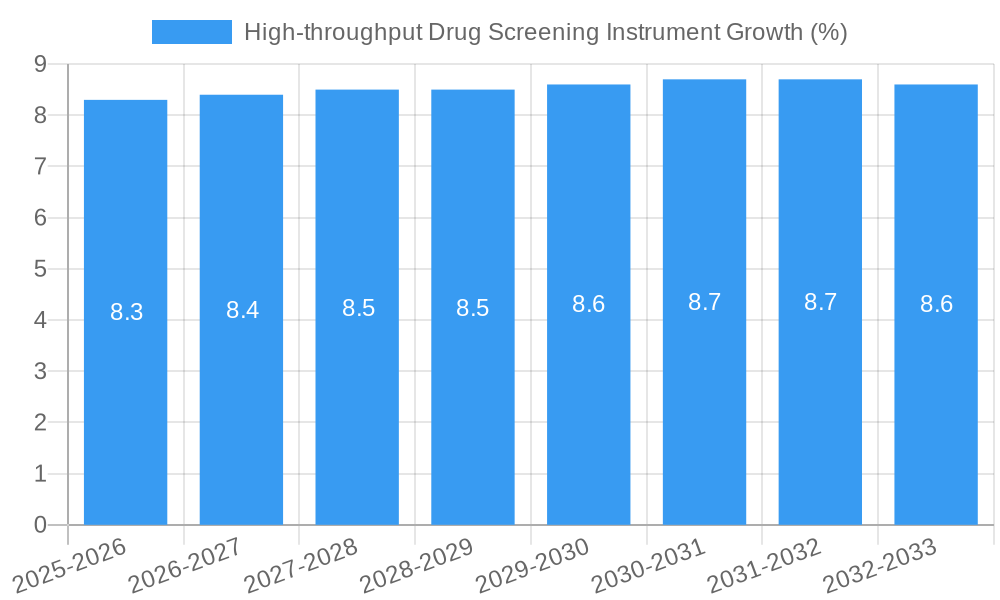
The global High-throughput Drug Screening Instrument market is poised for significant expansion, projected to reach a market size of approximately $15,500 million by 2025 and grow at a Compound Annual Growth Rate (CAGR) of around 8.5% through 2033. This robust growth is fueled by the escalating demand for novel therapeutics across various disease areas and the continuous need for accelerated drug discovery processes. Key drivers include the increasing prevalence of chronic diseases, the burgeoning biopharmaceutical industry, and substantial investments in research and development activities worldwide. Furthermore, advancements in automation, miniaturization, and data analytics are enabling more efficient and cost-effective screening of vast compound libraries, further propelling market adoption. The sector is witnessing a surge in the development of sophisticated instrumentation capable of handling complex biological assays and generating high-quality data for downstream analysis.
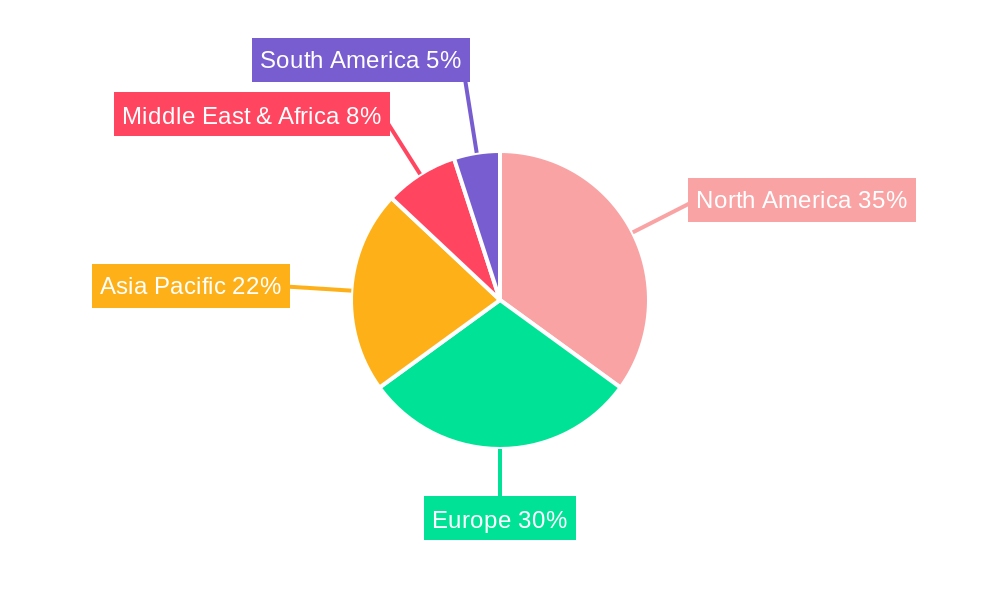
The market segmentation reveals a dynamic landscape across different applications and instrument types. The "Drug Discovery" application segment is expected to dominate, driven by pharmaceutical companies' relentless pursuit of new drug candidates. Within "Types," the "Chemical Library" segment is likely to hold a substantial share, owing to its widespread use in early-stage drug discovery. Emerging trends include the integration of artificial intelligence and machine learning for predictive screening, the rise of phenotypic screening platforms, and the increasing adoption of lab-on-a-chip technologies for miniaturized and parallelized assays. However, the market faces certain restraints, such as the high initial cost of advanced instrumentation and the stringent regulatory requirements for drug development. Despite these challenges, strategic collaborations, technological innovations, and the expanding global footprint of leading players like Thermo Fisher Scientific, PerkinElmer, and Agilent Technologies are expected to sustain the market's upward trajectory. North America currently leads the market, with Asia Pacific showing the fastest growth potential due to increasing R&D investments and a growing biopharmaceutical ecosystem.
This report offers an in-depth analysis of the global High-throughput Drug Screening Instrument market, exploring its dynamics, growth trajectory, and key players. With a focus on drug discovery, biological research, and genetic engineering applications, and covering chemical libraries, genomics libraries, protein libraries, and peptide libraries, this study provides critical insights for stakeholders navigating this rapidly evolving sector. The study period spans 2019–2033, with a base year of 2025 and a forecast period of 2025–2033, building upon the historical period of 2019–2024. We project the global high-throughput drug screening instrument market size to reach an estimated $5,800 million in 2025, with a projected compound annual growth rate (CAGR) of 8.5% during the forecast period, reaching approximately $9,200 million by 2033. The parent market for laboratory automation and drug discovery tools is estimated to be valued at $50,000 million in 2025, with the child market for high-throughput screening assay development anticipated at $7,500 million in the same year.
High-throughput Drug Screening Instrument Market Dynamics & Structure
The high-throughput drug screening instrument market exhibits a moderately concentrated structure, with key players like PerkinElmer, Agilent Technologies, Thermo Fisher Scientific, and Danaher holding significant market share. Technological innovation is the primary driver, fueled by advancements in automation, miniaturization, and data analysis capabilities. Regulatory frameworks, such as those established by the FDA and EMA for drug approval processes, indirectly influence the adoption and design of these instruments by setting standards for efficacy and safety. Competitive product substitutes, including manual screening methods and lower-throughput automated systems, exist but are increasingly being outpaced by the efficiency and scalability of HTS. End-user demographics are dominated by pharmaceutical and biotechnology companies, academic research institutions, and contract research organizations (CROs). Mergers and acquisitions (M&A) trends are notable, with larger companies acquiring smaller innovators to expand their product portfolios and market reach. For instance, in the historical period, there were an estimated 25 M&A deals valued at over $50 million annually, primarily focused on acquiring companies with novel assay technologies or AI-driven data analysis platforms. Innovation barriers include the high cost of sophisticated instrumentation and the complexity of integrating new technologies into existing laboratory workflows.
- Market Concentration: Moderately concentrated with significant influence from top players.
- Technological Innovation Drivers: Automation, miniaturization, AI in data analysis, novel assay development.
- Regulatory Frameworks: FDA and EMA guidelines on drug development and quality control.
- Competitive Product Substitutes: Manual screening, lower-throughput automation.
- End-User Demographics: Pharmaceutical companies (approximately 45% market share), biotechnology firms (30%), academic institutions (15%), CROs (10%).
- M&A Trends: Acquisitions of niche technology providers and companies with advanced data analytics capabilities.
- Innovation Barriers: High capital investment, integration complexity, need for specialized personnel.
High-throughput Drug Screening Instrument Growth Trends & Insights
The global high-throughput drug screening instrument market is experiencing robust growth, driven by an escalating demand for novel therapeutics and a more efficient drug discovery pipeline. The market size has witnessed a significant evolution, growing from an estimated $3,500 million in 2019 to a projected $5,800 million in 2025, reflecting a compelling CAGR of 8.5% over the historical and immediate forecast period. Adoption rates are accelerating, particularly among mid-sized biotech firms and academic research centers, who are increasingly investing in these advanced systems to remain competitive. Technological disruptions, such as the integration of artificial intelligence (AI) and machine learning (ML) for predictive analytics and assay optimization, are revolutionizing screening processes. These technologies enable researchers to identify promising drug candidates more rapidly and with higher accuracy. Furthermore, shifts in consumer behavior, characterized by a growing preference for personalized medicine and therapies for rare diseases, are creating a demand for more sophisticated and diverse screening capabilities. The increasing prevalence of chronic diseases and the continuous need for new treatments for infectious diseases are also significant contributors to market expansion. The market penetration of automated HTS systems in large pharmaceutical companies is already high (estimated at 90%), but there is substantial room for growth in smaller organizations and emerging markets, with current penetration rates in these segments estimated at 40%. The increasing investment in R&D by pharmaceutical and biotechnology companies, projected to exceed $200,000 million globally by 2027, directly fuels the demand for high-throughput drug screening instruments. The development of microfluidic-based HTS platforms, offering reduced reagent consumption and enhanced assay sensitivity, represents another key growth trend.
Dominant Regions, Countries, or Segments in High-throughput Drug Screening Instrument
North America, specifically the United States, currently dominates the global high-throughput drug screening instrument market, driven by a strong pharmaceutical and biotechnology industry, substantial R&D investments, and a well-established academic research ecosystem. The region's market share is estimated at 38% in 2025. Key drivers in this dominance include supportive government initiatives, a robust venture capital landscape for biotech startups, and the presence of leading pharmaceutical companies with extensive drug discovery programs. The Application: Drug Discovery segment is the most significant contributor to market growth, accounting for an estimated 65% of the total market revenue in 2025. This is due to the inherent need for rapid and efficient screening of vast compound libraries to identify potential drug candidates. Within the Types segment, the Chemical Library segment holds the largest market share, estimated at 55%, as it forms the foundational component for identifying novel small-molecule therapeutics.
Key Drivers in North America:
- High R&D Expenditure: Pharmaceutical and biotech companies invest heavily in drug discovery.
- Government Funding & Initiatives: Significant federal and state funding for life sciences research.
- Presence of Major Pharma & Biotech Hubs: Concentration of leading companies and research institutions.
- Venture Capital Investment: Strong support for emerging biotechnology companies.
- Advanced Technological Adoption: Early and widespread adoption of cutting-edge screening technologies.
Dominance Factors in Drug Discovery Application:
- Pipeline Advancement: Continuous need to discover and develop new drugs for unmet medical needs.
- Cost-Effectiveness: HTS significantly reduces the time and cost associated with early-stage drug development.
- Discovery of Novel Targets: Enables exploration of a wide range of biological targets.
Dominance Factors in Chemical Library Type:
- Vastness of Chemical Space: The sheer number of synthesizable chemical compounds available for screening.
- Established Infrastructure: Well-developed libraries and synthesis capabilities.
- Versatility: Applicable across a broad spectrum of therapeutic areas.
Europe, particularly Germany, the UK, and Switzerland, represents the second-largest market, with an estimated 28% share, driven by a strong pharmaceutical industry and academic research. Asia-Pacific is the fastest-growing region, with an estimated CAGR of 10.2%, fueled by increasing R&D investments in countries like China and India, and a growing focus on biopharmaceutical development.
High-throughput Drug Screening Instrument Product Landscape
The product landscape of high-throughput drug screening instruments is characterized by continuous innovation aimed at enhancing speed, sensitivity, and data analytics. Leading manufacturers are offering integrated platforms that combine liquid handling, detection systems, and sophisticated software for data interpretation. These instruments are designed for diverse applications, from small molecule screening to cell-based assays and phenotypic screening. Notable advancements include the development of miniaturized systems that reduce reagent consumption and increase throughput, as well as intelligent software solutions powered by AI/ML to optimize experimental design and accelerate candidate identification. PerkinElmer's EnVision platform, Agilent's automated liquid handling solutions, and Thermo Fisher Scientific's ArrayScan are prominent examples showcasing the industry's commitment to providing comprehensive and efficient screening solutions.
Key Drivers, Barriers & Challenges in High-throughput Drug Screening Instrument
Key Drivers:
- Rising R&D Spending in Pharma/Biotech: Increased investment fuels demand for efficient screening tools.
- Prevalence of Chronic Diseases: Growing need for novel therapeutics to address global health challenges.
- Advancements in Automation and AI: Technologies enabling faster, more accurate screening.
- Growing Outsourcing to CROs: Increased reliance on specialized service providers driving instrument demand.
- Technological Sophistication: Development of highly sensitive and multiplexed assays.
Barriers & Challenges:
- High Capital Investment: The substantial cost of advanced HTS instrumentation.
- Data Management Complexity: Handling and analyzing massive datasets generated by HTS.
- Skilled Workforce Shortage: Need for trained personnel to operate and maintain sophisticated systems.
- Regulatory Hurdles: Evolving regulations for drug development and data integrity.
- Supply Chain Disruptions: Potential for delays in component sourcing and instrument delivery.
- Competitive Pressure: Intense competition among instrument manufacturers.
- Integration Challenges: Integrating new HTS systems with existing laboratory infrastructure.
Emerging Opportunities in High-throughput Drug Screening Instrument
Emerging opportunities lie in the development of more specialized HTS platforms for areas like personalized medicine, rare disease research, and the screening of biologics and gene therapies. The integration of real-time data analytics and predictive modeling with HTS is a significant growth area. Furthermore, the expansion of HTS capabilities into emerging economies, particularly in Asia, presents a substantial untapped market. The development of cost-effective, modular HTS solutions for smaller research institutions and academic labs also represents a promising avenue for growth. The increasing focus on sustainable laboratory practices is also driving opportunities for instruments that minimize reagent waste and energy consumption.
Growth Accelerators in the High-throughput Drug Screening Instrument Industry
Growth accelerators include continuous technological innovation in automation, miniaturization, and data analysis, particularly the integration of AI and ML for predictive drug discovery. Strategic partnerships between instrument manufacturers, pharmaceutical companies, and research institutions are crucial for co-developing and validating new screening technologies. Market expansion strategies, such as entering underserved geographic regions and catering to specialized therapeutic areas, will also fuel long-term growth. The increasing adoption of open-source software and data-sharing initiatives can further accelerate innovation and adoption.
Key Players Shaping the High-throughput Drug Screening Instrument Market
- PerkinElmer
- Agilent Technologies
- Thermo Fisher Scientific
- Danaher
- Bio-Rad
- Merck Millipore
- Aurora Biomed
- Tecan Group
- Hamilton
- Cybio
- Fritz Gyger AG
- Beckman Coulter
- Eppendorf
- LabCyte
Notable Milestones in High-throughput Drug Screening Instrument Sector
- 2019: Launch of AI-powered data analysis platforms for HTS by several key players, enhancing candidate prioritization.
- 2020: Increased adoption of microfluidic HTS systems, leading to significant reductions in reagent consumption.
- 2021: Major pharmaceutical companies invest in advanced phenotypic screening platforms to discover novel mechanisms of action.
- 2022: Acquisitions of companies specializing in label-free detection technologies by larger instrument manufacturers.
- 2023: Development of integrated HTS solutions incorporating CRISPR-based screening capabilities.
- 2024: Emergence of cloud-based data management and analysis solutions for HTS, facilitating collaborative research.
In-Depth High-throughput Drug Screening Instrument Market Outlook
The future of the high-throughput drug screening instrument market is exceptionally bright, driven by ongoing technological breakthroughs and an insatiable demand for novel therapeutics. Growth accelerators such as advanced automation, AI-driven predictive analytics, and the expanding application in personalized medicine will continue to shape the market. Strategic partnerships and the development of innovative, cost-effective solutions will unlock new market segments. The increasing focus on biologics and cell-based therapies presents significant opportunities for specialized screening platforms. The market is poised for sustained expansion, offering considerable strategic opportunities for companies that can adapt to evolving research needs and technological advancements.
High-throughput Drug Screening Instrument Segmentation
-
1. Application
- 1.1. Drug Discovery
- 1.2. Biological Research
- 1.3. Genetic Engineering
- 1.4. Others
-
2. Types
- 2.1. Chemical Library
- 2.2. Genomics Library
- 2.3. Protein Library and Peptide Library
High-throughput Drug Screening Instrument Segmentation By Geography
-
1. North America
- 1.1. United States
- 1.2. Canada
- 1.3. Mexico
-
2. South America
- 2.1. Brazil
- 2.2. Argentina
- 2.3. Rest of South America
-
3. Europe
- 3.1. United Kingdom
- 3.2. Germany
- 3.3. France
- 3.4. Italy
- 3.5. Spain
- 3.6. Russia
- 3.7. Benelux
- 3.8. Nordics
- 3.9. Rest of Europe
-
4. Middle East & Africa
- 4.1. Turkey
- 4.2. Israel
- 4.3. GCC
- 4.4. North Africa
- 4.5. South Africa
- 4.6. Rest of Middle East & Africa
-
5. Asia Pacific
- 5.1. China
- 5.2. India
- 5.3. Japan
- 5.4. South Korea
- 5.5. ASEAN
- 5.6. Oceania
- 5.7. Rest of Asia Pacific
High-throughput Drug Screening Instrument REPORT HIGHLIGHTS
| Aspects | Details |
|---|---|
| Study Period | 2019-2033 |
| Base Year | 2024 |
| Estimated Year | 2025 |
| Forecast Period | 2025-2033 |
| Historical Period | 2019-2024 |
| Growth Rate | CAGR of XX% from 2019-2033 |
| Segmentation |
|
Table of Contents
- 1. Introduction
- 1.1. Research Scope
- 1.2. Market Segmentation
- 1.3. Research Methodology
- 1.4. Definitions and Assumptions
- 2. Executive Summary
- 2.1. Introduction
- 3. Market Dynamics
- 3.1. Introduction
- 3.2. Market Drivers
- 3.3. Market Restrains
- 3.4. Market Trends
- 4. Market Factor Analysis
- 4.1. Porters Five Forces
- 4.2. Supply/Value Chain
- 4.3. PESTEL analysis
- 4.4. Market Entropy
- 4.5. Patent/Trademark Analysis
- 5. Global High-throughput Drug Screening Instrument Analysis, Insights and Forecast, 2019-2031
- 5.1. Market Analysis, Insights and Forecast - by Application
- 5.1.1. Drug Discovery
- 5.1.2. Biological Research
- 5.1.3. Genetic Engineering
- 5.1.4. Others
- 5.2. Market Analysis, Insights and Forecast - by Types
- 5.2.1. Chemical Library
- 5.2.2. Genomics Library
- 5.2.3. Protein Library and Peptide Library
- 5.3. Market Analysis, Insights and Forecast - by Region
- 5.3.1. North America
- 5.3.2. South America
- 5.3.3. Europe
- 5.3.4. Middle East & Africa
- 5.3.5. Asia Pacific
- 5.1. Market Analysis, Insights and Forecast - by Application
- 6. North America High-throughput Drug Screening Instrument Analysis, Insights and Forecast, 2019-2031
- 6.1. Market Analysis, Insights and Forecast - by Application
- 6.1.1. Drug Discovery
- 6.1.2. Biological Research
- 6.1.3. Genetic Engineering
- 6.1.4. Others
- 6.2. Market Analysis, Insights and Forecast - by Types
- 6.2.1. Chemical Library
- 6.2.2. Genomics Library
- 6.2.3. Protein Library and Peptide Library
- 6.1. Market Analysis, Insights and Forecast - by Application
- 7. South America High-throughput Drug Screening Instrument Analysis, Insights and Forecast, 2019-2031
- 7.1. Market Analysis, Insights and Forecast - by Application
- 7.1.1. Drug Discovery
- 7.1.2. Biological Research
- 7.1.3. Genetic Engineering
- 7.1.4. Others
- 7.2. Market Analysis, Insights and Forecast - by Types
- 7.2.1. Chemical Library
- 7.2.2. Genomics Library
- 7.2.3. Protein Library and Peptide Library
- 7.1. Market Analysis, Insights and Forecast - by Application
- 8. Europe High-throughput Drug Screening Instrument Analysis, Insights and Forecast, 2019-2031
- 8.1. Market Analysis, Insights and Forecast - by Application
- 8.1.1. Drug Discovery
- 8.1.2. Biological Research
- 8.1.3. Genetic Engineering
- 8.1.4. Others
- 8.2. Market Analysis, Insights and Forecast - by Types
- 8.2.1. Chemical Library
- 8.2.2. Genomics Library
- 8.2.3. Protein Library and Peptide Library
- 8.1. Market Analysis, Insights and Forecast - by Application
- 9. Middle East & Africa High-throughput Drug Screening Instrument Analysis, Insights and Forecast, 2019-2031
- 9.1. Market Analysis, Insights and Forecast - by Application
- 9.1.1. Drug Discovery
- 9.1.2. Biological Research
- 9.1.3. Genetic Engineering
- 9.1.4. Others
- 9.2. Market Analysis, Insights and Forecast - by Types
- 9.2.1. Chemical Library
- 9.2.2. Genomics Library
- 9.2.3. Protein Library and Peptide Library
- 9.1. Market Analysis, Insights and Forecast - by Application
- 10. Asia Pacific High-throughput Drug Screening Instrument Analysis, Insights and Forecast, 2019-2031
- 10.1. Market Analysis, Insights and Forecast - by Application
- 10.1.1. Drug Discovery
- 10.1.2. Biological Research
- 10.1.3. Genetic Engineering
- 10.1.4. Others
- 10.2. Market Analysis, Insights and Forecast - by Types
- 10.2.1. Chemical Library
- 10.2.2. Genomics Library
- 10.2.3. Protein Library and Peptide Library
- 10.1. Market Analysis, Insights and Forecast - by Application
- 11. Competitive Analysis
- 11.1. Global Market Share Analysis 2024
- 11.2. Company Profiles
- 11.2.1 PerkinElmer
- 11.2.1.1. Overview
- 11.2.1.2. Products
- 11.2.1.3. SWOT Analysis
- 11.2.1.4. Recent Developments
- 11.2.1.5. Financials (Based on Availability)
- 11.2.2 Agilent Technologies
- 11.2.2.1. Overview
- 11.2.2.2. Products
- 11.2.2.3. SWOT Analysis
- 11.2.2.4. Recent Developments
- 11.2.2.5. Financials (Based on Availability)
- 11.2.3 Thermofisher Scientific
- 11.2.3.1. Overview
- 11.2.3.2. Products
- 11.2.3.3. SWOT Analysis
- 11.2.3.4. Recent Developments
- 11.2.3.5. Financials (Based on Availability)
- 11.2.4 Danaher
- 11.2.4.1. Overview
- 11.2.4.2. Products
- 11.2.4.3. SWOT Analysis
- 11.2.4.4. Recent Developments
- 11.2.4.5. Financials (Based on Availability)
- 11.2.5 Bio-Rad
- 11.2.5.1. Overview
- 11.2.5.2. Products
- 11.2.5.3. SWOT Analysis
- 11.2.5.4. Recent Developments
- 11.2.5.5. Financials (Based on Availability)
- 11.2.6 Merck Millipore
- 11.2.6.1. Overview
- 11.2.6.2. Products
- 11.2.6.3. SWOT Analysis
- 11.2.6.4. Recent Developments
- 11.2.6.5. Financials (Based on Availability)
- 11.2.7 Aurora Biomed
- 11.2.7.1. Overview
- 11.2.7.2. Products
- 11.2.7.3. SWOT Analysis
- 11.2.7.4. Recent Developments
- 11.2.7.5. Financials (Based on Availability)
- 11.2.8 Tecan Group
- 11.2.8.1. Overview
- 11.2.8.2. Products
- 11.2.8.3. SWOT Analysis
- 11.2.8.4. Recent Developments
- 11.2.8.5. Financials (Based on Availability)
- 11.2.9 Hamilton
- 11.2.9.1. Overview
- 11.2.9.2. Products
- 11.2.9.3. SWOT Analysis
- 11.2.9.4. Recent Developments
- 11.2.9.5. Financials (Based on Availability)
- 11.2.10 Cybio
- 11.2.10.1. Overview
- 11.2.10.2. Products
- 11.2.10.3. SWOT Analysis
- 11.2.10.4. Recent Developments
- 11.2.10.5. Financials (Based on Availability)
- 11.2.11 Fritz Gyger AG
- 11.2.11.1. Overview
- 11.2.11.2. Products
- 11.2.11.3. SWOT Analysis
- 11.2.11.4. Recent Developments
- 11.2.11.5. Financials (Based on Availability)
- 11.2.12 Beckman Coulter
- 11.2.12.1. Overview
- 11.2.12.2. Products
- 11.2.12.3. SWOT Analysis
- 11.2.12.4. Recent Developments
- 11.2.12.5. Financials (Based on Availability)
- 11.2.13 Eppendorf
- 11.2.13.1. Overview
- 11.2.13.2. Products
- 11.2.13.3. SWOT Analysis
- 11.2.13.4. Recent Developments
- 11.2.13.5. Financials (Based on Availability)
- 11.2.14 LabCyte
- 11.2.14.1. Overview
- 11.2.14.2. Products
- 11.2.14.3. SWOT Analysis
- 11.2.14.4. Recent Developments
- 11.2.14.5. Financials (Based on Availability)
- 11.2.1 PerkinElmer
List of Figures
- Figure 1: Global High-throughput Drug Screening Instrument Revenue Breakdown (million, %) by Region 2024 & 2032
- Figure 2: North America High-throughput Drug Screening Instrument Revenue (million), by Application 2024 & 2032
- Figure 3: North America High-throughput Drug Screening Instrument Revenue Share (%), by Application 2024 & 2032
- Figure 4: North America High-throughput Drug Screening Instrument Revenue (million), by Types 2024 & 2032
- Figure 5: North America High-throughput Drug Screening Instrument Revenue Share (%), by Types 2024 & 2032
- Figure 6: North America High-throughput Drug Screening Instrument Revenue (million), by Country 2024 & 2032
- Figure 7: North America High-throughput Drug Screening Instrument Revenue Share (%), by Country 2024 & 2032
- Figure 8: South America High-throughput Drug Screening Instrument Revenue (million), by Application 2024 & 2032
- Figure 9: South America High-throughput Drug Screening Instrument Revenue Share (%), by Application 2024 & 2032
- Figure 10: South America High-throughput Drug Screening Instrument Revenue (million), by Types 2024 & 2032
- Figure 11: South America High-throughput Drug Screening Instrument Revenue Share (%), by Types 2024 & 2032
- Figure 12: South America High-throughput Drug Screening Instrument Revenue (million), by Country 2024 & 2032
- Figure 13: South America High-throughput Drug Screening Instrument Revenue Share (%), by Country 2024 & 2032
- Figure 14: Europe High-throughput Drug Screening Instrument Revenue (million), by Application 2024 & 2032
- Figure 15: Europe High-throughput Drug Screening Instrument Revenue Share (%), by Application 2024 & 2032
- Figure 16: Europe High-throughput Drug Screening Instrument Revenue (million), by Types 2024 & 2032
- Figure 17: Europe High-throughput Drug Screening Instrument Revenue Share (%), by Types 2024 & 2032
- Figure 18: Europe High-throughput Drug Screening Instrument Revenue (million), by Country 2024 & 2032
- Figure 19: Europe High-throughput Drug Screening Instrument Revenue Share (%), by Country 2024 & 2032
- Figure 20: Middle East & Africa High-throughput Drug Screening Instrument Revenue (million), by Application 2024 & 2032
- Figure 21: Middle East & Africa High-throughput Drug Screening Instrument Revenue Share (%), by Application 2024 & 2032
- Figure 22: Middle East & Africa High-throughput Drug Screening Instrument Revenue (million), by Types 2024 & 2032
- Figure 23: Middle East & Africa High-throughput Drug Screening Instrument Revenue Share (%), by Types 2024 & 2032
- Figure 24: Middle East & Africa High-throughput Drug Screening Instrument Revenue (million), by Country 2024 & 2032
- Figure 25: Middle East & Africa High-throughput Drug Screening Instrument Revenue Share (%), by Country 2024 & 2032
- Figure 26: Asia Pacific High-throughput Drug Screening Instrument Revenue (million), by Application 2024 & 2032
- Figure 27: Asia Pacific High-throughput Drug Screening Instrument Revenue Share (%), by Application 2024 & 2032
- Figure 28: Asia Pacific High-throughput Drug Screening Instrument Revenue (million), by Types 2024 & 2032
- Figure 29: Asia Pacific High-throughput Drug Screening Instrument Revenue Share (%), by Types 2024 & 2032
- Figure 30: Asia Pacific High-throughput Drug Screening Instrument Revenue (million), by Country 2024 & 2032
- Figure 31: Asia Pacific High-throughput Drug Screening Instrument Revenue Share (%), by Country 2024 & 2032
List of Tables
- Table 1: Global High-throughput Drug Screening Instrument Revenue million Forecast, by Region 2019 & 2032
- Table 2: Global High-throughput Drug Screening Instrument Revenue million Forecast, by Application 2019 & 2032
- Table 3: Global High-throughput Drug Screening Instrument Revenue million Forecast, by Types 2019 & 2032
- Table 4: Global High-throughput Drug Screening Instrument Revenue million Forecast, by Region 2019 & 2032
- Table 5: Global High-throughput Drug Screening Instrument Revenue million Forecast, by Application 2019 & 2032
- Table 6: Global High-throughput Drug Screening Instrument Revenue million Forecast, by Types 2019 & 2032
- Table 7: Global High-throughput Drug Screening Instrument Revenue million Forecast, by Country 2019 & 2032
- Table 8: United States High-throughput Drug Screening Instrument Revenue (million) Forecast, by Application 2019 & 2032
- Table 9: Canada High-throughput Drug Screening Instrument Revenue (million) Forecast, by Application 2019 & 2032
- Table 10: Mexico High-throughput Drug Screening Instrument Revenue (million) Forecast, by Application 2019 & 2032
- Table 11: Global High-throughput Drug Screening Instrument Revenue million Forecast, by Application 2019 & 2032
- Table 12: Global High-throughput Drug Screening Instrument Revenue million Forecast, by Types 2019 & 2032
- Table 13: Global High-throughput Drug Screening Instrument Revenue million Forecast, by Country 2019 & 2032
- Table 14: Brazil High-throughput Drug Screening Instrument Revenue (million) Forecast, by Application 2019 & 2032
- Table 15: Argentina High-throughput Drug Screening Instrument Revenue (million) Forecast, by Application 2019 & 2032
- Table 16: Rest of South America High-throughput Drug Screening Instrument Revenue (million) Forecast, by Application 2019 & 2032
- Table 17: Global High-throughput Drug Screening Instrument Revenue million Forecast, by Application 2019 & 2032
- Table 18: Global High-throughput Drug Screening Instrument Revenue million Forecast, by Types 2019 & 2032
- Table 19: Global High-throughput Drug Screening Instrument Revenue million Forecast, by Country 2019 & 2032
- Table 20: United Kingdom High-throughput Drug Screening Instrument Revenue (million) Forecast, by Application 2019 & 2032
- Table 21: Germany High-throughput Drug Screening Instrument Revenue (million) Forecast, by Application 2019 & 2032
- Table 22: France High-throughput Drug Screening Instrument Revenue (million) Forecast, by Application 2019 & 2032
- Table 23: Italy High-throughput Drug Screening Instrument Revenue (million) Forecast, by Application 2019 & 2032
- Table 24: Spain High-throughput Drug Screening Instrument Revenue (million) Forecast, by Application 2019 & 2032
- Table 25: Russia High-throughput Drug Screening Instrument Revenue (million) Forecast, by Application 2019 & 2032
- Table 26: Benelux High-throughput Drug Screening Instrument Revenue (million) Forecast, by Application 2019 & 2032
- Table 27: Nordics High-throughput Drug Screening Instrument Revenue (million) Forecast, by Application 2019 & 2032
- Table 28: Rest of Europe High-throughput Drug Screening Instrument Revenue (million) Forecast, by Application 2019 & 2032
- Table 29: Global High-throughput Drug Screening Instrument Revenue million Forecast, by Application 2019 & 2032
- Table 30: Global High-throughput Drug Screening Instrument Revenue million Forecast, by Types 2019 & 2032
- Table 31: Global High-throughput Drug Screening Instrument Revenue million Forecast, by Country 2019 & 2032
- Table 32: Turkey High-throughput Drug Screening Instrument Revenue (million) Forecast, by Application 2019 & 2032
- Table 33: Israel High-throughput Drug Screening Instrument Revenue (million) Forecast, by Application 2019 & 2032
- Table 34: GCC High-throughput Drug Screening Instrument Revenue (million) Forecast, by Application 2019 & 2032
- Table 35: North Africa High-throughput Drug Screening Instrument Revenue (million) Forecast, by Application 2019 & 2032
- Table 36: South Africa High-throughput Drug Screening Instrument Revenue (million) Forecast, by Application 2019 & 2032
- Table 37: Rest of Middle East & Africa High-throughput Drug Screening Instrument Revenue (million) Forecast, by Application 2019 & 2032
- Table 38: Global High-throughput Drug Screening Instrument Revenue million Forecast, by Application 2019 & 2032
- Table 39: Global High-throughput Drug Screening Instrument Revenue million Forecast, by Types 2019 & 2032
- Table 40: Global High-throughput Drug Screening Instrument Revenue million Forecast, by Country 2019 & 2032
- Table 41: China High-throughput Drug Screening Instrument Revenue (million) Forecast, by Application 2019 & 2032
- Table 42: India High-throughput Drug Screening Instrument Revenue (million) Forecast, by Application 2019 & 2032
- Table 43: Japan High-throughput Drug Screening Instrument Revenue (million) Forecast, by Application 2019 & 2032
- Table 44: South Korea High-throughput Drug Screening Instrument Revenue (million) Forecast, by Application 2019 & 2032
- Table 45: ASEAN High-throughput Drug Screening Instrument Revenue (million) Forecast, by Application 2019 & 2032
- Table 46: Oceania High-throughput Drug Screening Instrument Revenue (million) Forecast, by Application 2019 & 2032
- Table 47: Rest of Asia Pacific High-throughput Drug Screening Instrument Revenue (million) Forecast, by Application 2019 & 2032
Frequently Asked Questions
1. What is the projected Compound Annual Growth Rate (CAGR) of the High-throughput Drug Screening Instrument?
The projected CAGR is approximately XX%.
2. Which companies are prominent players in the High-throughput Drug Screening Instrument?
Key companies in the market include PerkinElmer, Agilent Technologies, Thermofisher Scientific, Danaher, Bio-Rad, Merck Millipore, Aurora Biomed, Tecan Group, Hamilton, Cybio, Fritz Gyger AG, Beckman Coulter, Eppendorf, LabCyte.
3. What are the main segments of the High-throughput Drug Screening Instrument?
The market segments include Application, Types.
4. Can you provide details about the market size?
The market size is estimated to be USD XXX million as of 2022.
5. What are some drivers contributing to market growth?
N/A
6. What are the notable trends driving market growth?
N/A
7. Are there any restraints impacting market growth?
N/A
8. Can you provide examples of recent developments in the market?
N/A
9. What pricing options are available for accessing the report?
Pricing options include single-user, multi-user, and enterprise licenses priced at USD 2900.00, USD 4350.00, and USD 5800.00 respectively.
10. Is the market size provided in terms of value or volume?
The market size is provided in terms of value, measured in million.
11. Are there any specific market keywords associated with the report?
Yes, the market keyword associated with the report is "High-throughput Drug Screening Instrument," which aids in identifying and referencing the specific market segment covered.
12. How do I determine which pricing option suits my needs best?
The pricing options vary based on user requirements and access needs. Individual users may opt for single-user licenses, while businesses requiring broader access may choose multi-user or enterprise licenses for cost-effective access to the report.
13. Are there any additional resources or data provided in the High-throughput Drug Screening Instrument report?
While the report offers comprehensive insights, it's advisable to review the specific contents or supplementary materials provided to ascertain if additional resources or data are available.
14. How can I stay updated on further developments or reports in the High-throughput Drug Screening Instrument?
To stay informed about further developments, trends, and reports in the High-throughput Drug Screening Instrument, consider subscribing to industry newsletters, following relevant companies and organizations, or regularly checking reputable industry news sources and publications.
Methodology
Step 1 - Identification of Relevant Samples Size from Population Database


Step 2 - Approaches for Defining Global Market Size (Value, Volume* & Price*)

Note*: In applicable scenarios
Step 3 - Data Sources
Primary Research
- Web Analytics
- Survey Reports
- Research Institute
- Latest Research Reports
- Opinion Leaders
Secondary Research
- Annual Reports
- White Paper
- Latest Press Release
- Industry Association
- Paid Database
- Investor Presentations

Step 4 - Data Triangulation
Involves using different sources of information in order to increase the validity of a study
These sources are likely to be stakeholders in a program - participants, other researchers, program staff, other community members, and so on.
Then we put all data in single framework & apply various statistical tools to find out the dynamic on the market.
During the analysis stage, feedback from the stakeholder groups would be compared to determine areas of agreement as well as areas of divergence


