

Key Insights
The global High Quality Fiber Optic market is poised for significant expansion, projected to reach $10.74 billion by 2025, with a robust compound annual growth rate (CAGR) of 6.86% expected to persist through 2033. This growth is primarily fueled by the escalating demand for high-speed data transmission across diverse sectors. The automotive industry is witnessing a surge in adoption for advanced driver-assistance systems (ADAS) and in-car infotainment, requiring reliable and high-bandwidth connectivity. Similarly, industrial automation, with its increasing reliance on real-time data processing and IoT integration, presents a substantial growth avenue. The expansion of home networks to support streaming, gaming, and remote work, alongside the continuous evolution of consumer electronics demanding faster data speeds, further accentuates this upward trajectory. The medical sector is also contributing, with fiber optics becoming integral to advanced diagnostic imaging and minimally invasive surgical procedures.
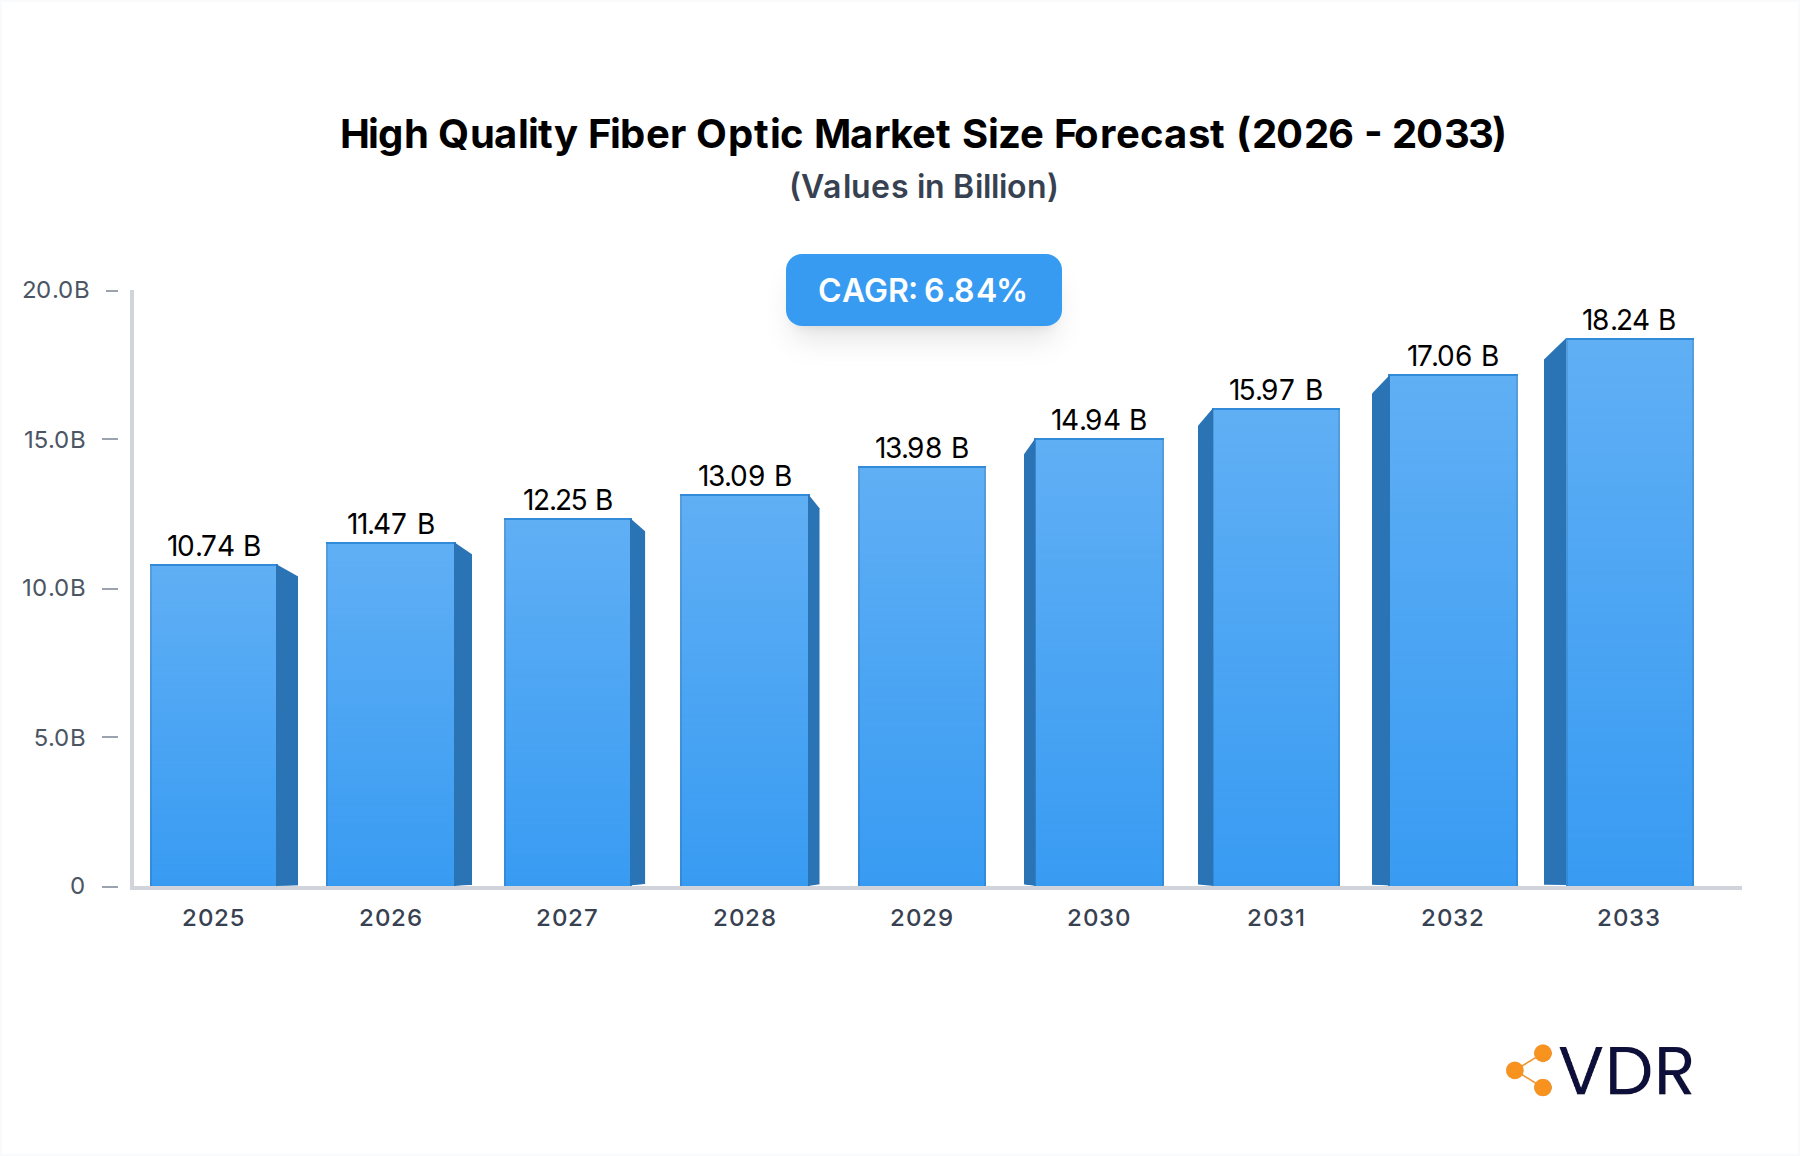
High Quality Fiber Optic Market Size (In Billion)
While the market exhibits strong growth drivers, certain factors could moderate its pace. The initial high cost of deployment and the need for specialized installation expertise for fiber optic networks can act as restraints, particularly in certain developing regions. However, ongoing technological advancements are steadily bringing down costs and simplifying installation processes. Key trends shaping the market include the increasing deployment of 5G networks, which necessitate dense fiber optic infrastructure for backhaul and fronthaul, and the growing adoption of fiber-to-the-home (FTTH) initiatives globally to bridge the digital divide. Innovations in fiber optic cable design, such as increased durability and improved signal integrity, are also contributing to market dynamism. The market is characterized by intense competition among established players like Prysmian, Corning, and YOFC, alongside emerging companies vying for market share.

High Quality Fiber Optic Company Market Share
Unlock the future of connectivity with this definitive report on the High Quality Fiber Optic market. This in-depth analysis provides critical insights into market dynamics, growth trajectories, and competitive landscapes, offering a strategic roadmap for industry stakeholders. Covering the study period from 2019 to 2033, with a base year of 2025, this report delivers actionable intelligence through meticulous data segmentation and expert analysis. Delve into the global market size of High Quality Fiber Optic, projected to reach $XXX billion in 2025, with a robust CAGR of XX.X% anticipated throughout the forecast period (2025-2033). We meticulously examine both parent and child markets, providing a granular view of opportunities and challenges.
This report is your indispensable guide to understanding the evolution of fiber optic technology, its applications across diverse industries, and the strategic moves of key players like Prysmian, HTGD, Furukawa, Corning, YOFC, Futong, Fujikura, Sumitomo, Tongding Optic-Electronic, CommScope, STL, FiberHome, Jiangsu Etern, ZTT, BELDEN, Fasten, Nexans, Kaile, and LS Cable&System. Discover the surging demand for Single-Mode Optical Fiber and Multi-Mode Optical Fiber across sectors including Automotive, Industrial, Home Networks, Consumer Electronics, and Medical.
High Quality Fiber Optic Market Dynamics & Structure
The High Quality Fiber Optic market exhibits a moderately consolidated structure, with a few dominant players holding significant market share, estimated to be around XX% in 2025. Technological innovation remains the primary driver, fueled by advancements in material science and manufacturing processes leading to higher bandwidth, lower attenuation, and increased durability. Regulatory frameworks, particularly those promoting digital infrastructure development and 5G deployment, are increasingly shaping market entry and expansion strategies. Competitive product substitutes, primarily advanced copper cabling, are steadily losing ground due to the superior performance and future-proofing capabilities of fiber optics. End-user demographics are shifting towards a greater demand for high-speed, reliable connectivity across residential, commercial, and industrial settings. Mergers and Acquisitions (M&A) are a notable trend, with an estimated XX M&A deals in the historical period (2019-2024), aimed at consolidating market presence and acquiring innovative technologies. Innovation barriers include the high initial investment in R&D and specialized manufacturing equipment, alongside stringent quality control requirements.
High Quality Fiber Optic Growth Trends & Insights
The High Quality Fiber Optic market is poised for substantial growth, driven by an escalating global demand for data transmission and connectivity. The market size, valued at an estimated $XXX billion in 2025, is projected to witness a Compound Annual Growth Rate (CAGR) of XX.X% through 2033. This impressive trajectory is underpinned by increasing adoption rates in both established and emerging economies, spurred by government initiatives focused on expanding broadband infrastructure. Technological disruptions, such as the advent of advanced fiber optic technologies like hollow-core fiber and polarization-maintaining fiber, are further accelerating this growth by enabling new applications and enhancing existing ones. Consumer behavior shifts towards increased reliance on streaming services, cloud computing, and the Internet of Things (IoT) are directly translating into a higher demand for high-speed, low-latency internet access, making fiber optics the preferred solution. Market penetration is expected to reach XX% globally by 2033, indicating a significant shift away from legacy infrastructure.
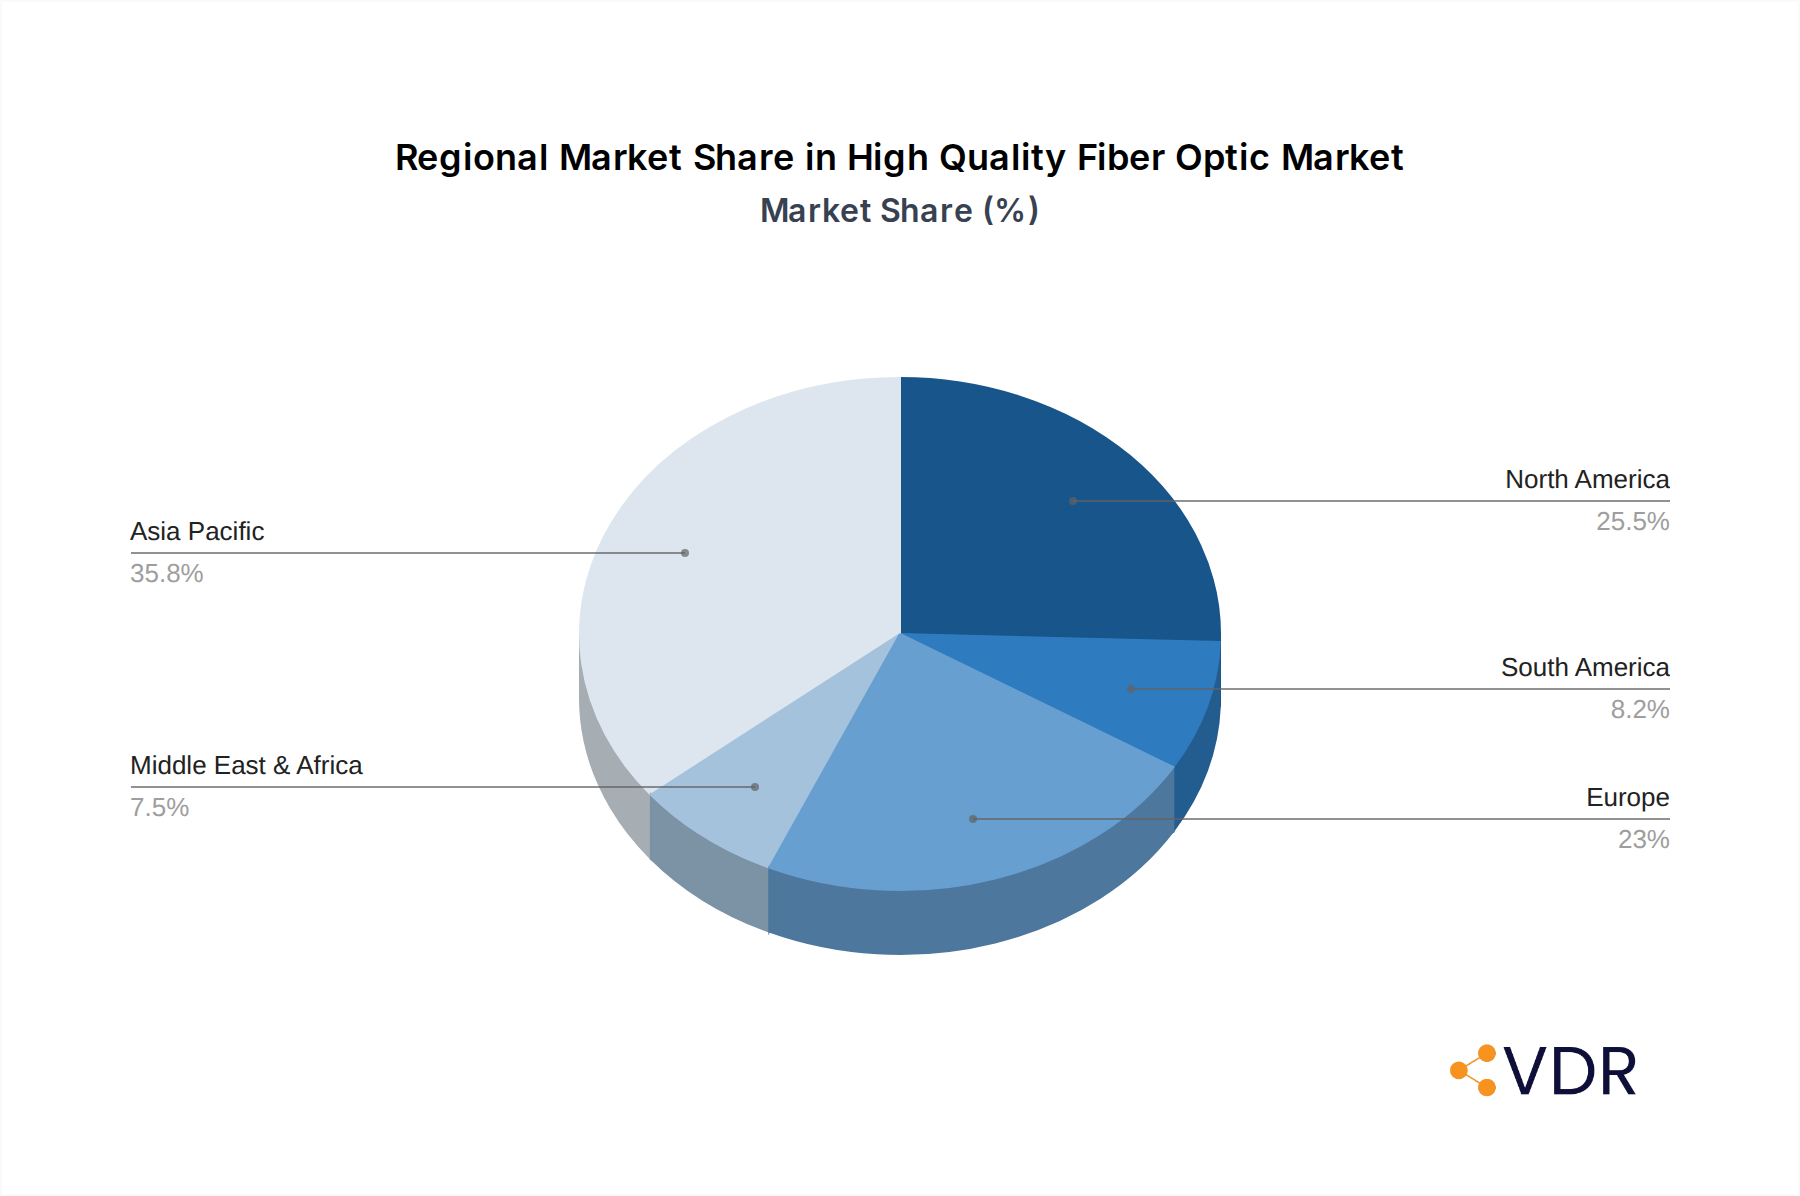
Dominant Regions, Countries, or Segments in High Quality Fiber Optic
The Home Networks segment, driven by the insatiable demand for high-speed broadband and the proliferation of smart home devices, is emerging as a dominant force in the global High Quality Fiber Optic market. This segment is projected to capture an estimated XX% market share by 2025. North America and Europe currently lead in terms of market size and adoption, largely due to advanced economic policies and robust infrastructure development. However, the Asia-Pacific region is exhibiting the fastest growth potential, fueled by extensive government investments in digital infrastructure, particularly in countries like China and India. Key drivers in these dominant regions include supportive regulatory frameworks that incentivize fiber optic deployment, substantial economic policies promoting technological advancement, and increasing consumer awareness of the benefits of high-speed internet. The dominance is further amplified by the growing prevalence of Single-Mode Optical Fiber, which offers superior performance for long-haul and high-bandwidth applications essential for home networking.
High Quality Fiber Optic Product Landscape
The High Quality Fiber Optic product landscape is characterized by continuous innovation focused on enhancing transmission capacity, reducing signal loss, and improving durability. Advancements in manufacturing processes have led to the development of Ultra-Low Loss (ULL) fibers and Bend-Insensitive Fibers (BIFs), crucial for dense urban deployments and challenging industrial environments. These innovations directly translate to improved performance metrics, including reduced latency and higher data throughput. Unique selling propositions revolve around enhanced reliability for critical applications in sectors like telecommunications, data centers, and automotive, where seamless connectivity is paramount. Technological advancements are enabling the integration of fiber optics into new applications, such as advanced medical imaging and high-performance computing.
Key Drivers, Barriers & Challenges in High Quality Fiber Optic
The High Quality Fiber Optic market is propelled by several key drivers. Technological advancements in manufacturing and material science are continuously improving fiber optic capabilities. Government initiatives promoting digital transformation and broadband expansion, particularly 5G deployment, are creating significant demand. The escalating demand for data consumption fueled by streaming, cloud computing, and IoT applications acts as a major economic driver.
However, the market faces significant barriers and challenges. High initial investment costs for research, development, and manufacturing infrastructure pose a substantial hurdle. Supply chain complexities, particularly for specialized raw materials, can lead to disruptions and price volatility. Regulatory hurdles in certain regions, including permitting processes and right-of-way issues, can slow down deployment. Intense competitive pressures from established players and emerging technologies also present challenges.
Emerging Opportunities in High Quality Fiber Optic
Emerging opportunities in the High Quality Fiber Optic sector are ripe for exploration. The burgeoning IoT market presents a vast untapped potential for the deployment of high-speed, low-latency fiber optic networks to connect a multitude of devices across smart cities, industrial automation, and smart agriculture. Innovative applications in telemedicine and remote surgery, requiring ultra-reliable, high-bandwidth connectivity, are gaining traction. Furthermore, the evolving consumer preference for immersive digital experiences, such as virtual reality (VR) and augmented reality (AR), will necessitate the widespread availability of advanced fiber optic infrastructure. The development of smart grid technologies also presents a significant avenue for growth, demanding robust and secure communication networks.
Growth Accelerators in the High Quality Fiber Optic Industry
Several catalysts are accelerating long-term growth in the High Quality Fiber Optic industry. Technological breakthroughs, such as advancements in photonic integrated circuits and new fiber types capable of higher data rates, are fundamental. Strategic partnerships between fiber optic manufacturers, network operators, and technology providers are fostering innovation and market penetration. Market expansion strategies, including focusing on underserved regions and developing tailored solutions for specific industry verticals, are crucial. The increasing adoption of passive optical networks (PON) for residential and business connectivity also serves as a significant growth accelerator, offering cost-effective high-bandwidth solutions.
Key Players Shaping the High Quality Fiber Optic Market
- Prysmian
- HTGD
- Furukawa
- Corning
- YOFC
- Futong
- Fujikura
- Sumitomo
- Tongding Optic-Electronic
- CommScope
- STL
- FiberHome
- Jiangsu Etern
- ZTT
- BELDEN
- Fasten
- Nexans
- Kaile
- LS Cable&System
Notable Milestones in High Quality Fiber Optic Sector
- 2019: Significant advancements in Ultra-Low Loss (ULL) fiber technology, reducing signal attenuation by an estimated XX%.
- 2020: Increased investment in fiber-to-the-home (FTTH) infrastructure globally, with deployment reaching an additional XX million households.
- 2021: Major telecommunications companies accelerate 5G network rollouts, significantly boosting demand for high-density fiber optic cables.
- 2022: Launch of new fiber optic solutions optimized for the Automotive sector, supporting advanced driver-assistance systems (ADAS) and in-car infotainment.
- 2023: Emergence of novel fiber optic sensors for industrial IoT applications, enabling real-time monitoring and predictive maintenance.
- 2024: Key acquisitions and mergers aimed at consolidating market share and expanding product portfolios within the fiber optic industry.
In-Depth High Quality Fiber Optic Market Outlook
The future outlook for the High Quality Fiber Optic market is exceptionally bright, driven by an unyielding demand for enhanced connectivity. The continued expansion of 5G networks, the proliferation of data centers, and the burgeoning Internet of Things (IoT) will serve as consistent growth accelerators. Emerging applications in areas like autonomous vehicles and advanced medical technologies will further solidify fiber optics' indispensable role. Strategic investments in research and development, coupled with supportive government policies aimed at digital infrastructure enhancement, will pave the way for sustained market expansion and technological innovation, promising significant opportunities for industry players.
High Quality Fiber Optic Segmentation
-
1. Application
- 1.1. Automotive
- 1.2. Industrial
- 1.3. Home Networks
- 1.4. Consumer Electronics
- 1.5. Medical
- 1.6. Other
-
2. Types
- 2.1. Single-Mode Optical Fiber
- 2.2. Multi-Mode Optical Fiber
High Quality Fiber Optic Segmentation By Geography
-
1. North America
- 1.1. United States
- 1.2. Canada
- 1.3. Mexico
-
2. South America
- 2.1. Brazil
- 2.2. Argentina
- 2.3. Rest of South America
-
3. Europe
- 3.1. United Kingdom
- 3.2. Germany
- 3.3. France
- 3.4. Italy
- 3.5. Spain
- 3.6. Russia
- 3.7. Benelux
- 3.8. Nordics
- 3.9. Rest of Europe
-
4. Middle East & Africa
- 4.1. Turkey
- 4.2. Israel
- 4.3. GCC
- 4.4. North Africa
- 4.5. South Africa
- 4.6. Rest of Middle East & Africa
-
5. Asia Pacific
- 5.1. China
- 5.2. India
- 5.3. Japan
- 5.4. South Korea
- 5.5. ASEAN
- 5.6. Oceania
- 5.7. Rest of Asia Pacific
High Quality Fiber Optic Regional Market Share
Geographic Coverage of High Quality Fiber Optic
High Quality Fiber Optic REPORT HIGHLIGHTS
| Aspects | Details |
|---|---|
| Study Period | 2020-2034 |
| Base Year | 2025 |
| Estimated Year | 2026 |
| Forecast Period | 2026-2034 |
| Historical Period | 2020-2025 |
| Growth Rate | CAGR of 6.86% from 2020-2034 |
| Segmentation |
|
Table of Contents
- 1. Introduction
- 1.1. Research Scope
- 1.2. Market Segmentation
- 1.3. Research Objective
- 1.4. Definitions and Assumptions
- 2. Executive Summary
- 2.1. Market Snapshot
- 3. Market Dynamics
- 3.1. Market Drivers
- 3.2. Market Restrains
- 3.3. Market Trends
- 3.4. Market Opportunities
- 4. Market Factor Analysis
- 4.1. Porters Five Forces
- 4.1.1. Bargaining Power of Suppliers
- 4.1.2. Bargaining Power of Buyers
- 4.1.3. Threat of New Entrants
- 4.1.4. Threat of Substitutes
- 4.1.5. Competitive Rivalry
- 4.2. PESTEL analysis
- 4.3. BCG Analysis
- 4.3.1. Stars (High Growth, High Market Share)
- 4.3.2. Cash Cows (Low Growth, High Market Share)
- 4.3.3. Question Mark (High Growth, Low Market Share)
- 4.3.4. Dogs (Low Growth, Low Market Share)
- 4.4. Ansoff Matrix Analysis
- 4.5. Supply Chain Analysis
- 4.6. Regulatory Landscape
- 4.7. Current Market Potential and Opportunity Assessment (TAM–SAM–SOM Framework)
- 4.8. VDR Analyst Note
- 4.1. Porters Five Forces
- 5. Market Analysis, Insights and Forecast 2021-2033
- 5.1. Market Analysis, Insights and Forecast - by Application
- 5.1.1. Automotive
- 5.1.2. Industrial
- 5.1.3. Home Networks
- 5.1.4. Consumer Electronics
- 5.1.5. Medical
- 5.1.6. Other
- 5.2. Market Analysis, Insights and Forecast - by Types
- 5.2.1. Single-Mode Optical Fiber
- 5.2.2. Multi-Mode Optical Fiber
- 5.3. Market Analysis, Insights and Forecast - by Region
- 5.3.1. North America
- 5.3.2. South America
- 5.3.3. Europe
- 5.3.4. Middle East & Africa
- 5.3.5. Asia Pacific
- 5.1. Market Analysis, Insights and Forecast - by Application
- 6. Global High Quality Fiber Optic Analysis, Insights and Forecast, 2021-2033
- 6.1. Market Analysis, Insights and Forecast - by Application
- 6.1.1. Automotive
- 6.1.2. Industrial
- 6.1.3. Home Networks
- 6.1.4. Consumer Electronics
- 6.1.5. Medical
- 6.1.6. Other
- 6.2. Market Analysis, Insights and Forecast - by Types
- 6.2.1. Single-Mode Optical Fiber
- 6.2.2. Multi-Mode Optical Fiber
- 6.1. Market Analysis, Insights and Forecast - by Application
- 7. North America High Quality Fiber Optic Analysis, Insights and Forecast, 2021-2033
- 7.1. Market Analysis, Insights and Forecast - by Application
- 7.1.1. Automotive
- 7.1.2. Industrial
- 7.1.3. Home Networks
- 7.1.4. Consumer Electronics
- 7.1.5. Medical
- 7.1.6. Other
- 7.2. Market Analysis, Insights and Forecast - by Types
- 7.2.1. Single-Mode Optical Fiber
- 7.2.2. Multi-Mode Optical Fiber
- 7.1. Market Analysis, Insights and Forecast - by Application
- 8. South America High Quality Fiber Optic Analysis, Insights and Forecast, 2021-2033
- 8.1. Market Analysis, Insights and Forecast - by Application
- 8.1.1. Automotive
- 8.1.2. Industrial
- 8.1.3. Home Networks
- 8.1.4. Consumer Electronics
- 8.1.5. Medical
- 8.1.6. Other
- 8.2. Market Analysis, Insights and Forecast - by Types
- 8.2.1. Single-Mode Optical Fiber
- 8.2.2. Multi-Mode Optical Fiber
- 8.1. Market Analysis, Insights and Forecast - by Application
- 9. Europe High Quality Fiber Optic Analysis, Insights and Forecast, 2021-2033
- 9.1. Market Analysis, Insights and Forecast - by Application
- 9.1.1. Automotive
- 9.1.2. Industrial
- 9.1.3. Home Networks
- 9.1.4. Consumer Electronics
- 9.1.5. Medical
- 9.1.6. Other
- 9.2. Market Analysis, Insights and Forecast - by Types
- 9.2.1. Single-Mode Optical Fiber
- 9.2.2. Multi-Mode Optical Fiber
- 9.1. Market Analysis, Insights and Forecast - by Application
- 10. Middle East & Africa High Quality Fiber Optic Analysis, Insights and Forecast, 2021-2033
- 10.1. Market Analysis, Insights and Forecast - by Application
- 10.1.1. Automotive
- 10.1.2. Industrial
- 10.1.3. Home Networks
- 10.1.4. Consumer Electronics
- 10.1.5. Medical
- 10.1.6. Other
- 10.2. Market Analysis, Insights and Forecast - by Types
- 10.2.1. Single-Mode Optical Fiber
- 10.2.2. Multi-Mode Optical Fiber
- 10.1. Market Analysis, Insights and Forecast - by Application
- 11. Asia Pacific High Quality Fiber Optic Analysis, Insights and Forecast, 2021-2033
- 11.1. Market Analysis, Insights and Forecast - by Application
- 11.1.1. Automotive
- 11.1.2. Industrial
- 11.1.3. Home Networks
- 11.1.4. Consumer Electronics
- 11.1.5. Medical
- 11.1.6. Other
- 11.2. Market Analysis, Insights and Forecast - by Types
- 11.2.1. Single-Mode Optical Fiber
- 11.2.2. Multi-Mode Optical Fiber
- 11.1. Market Analysis, Insights and Forecast - by Application
- 12. Competitive Analysis
- 12.1. Company Profiles
- 12.1.1 Prysmian
- 12.1.1.1. Company Overview
- 12.1.1.2. Products
- 12.1.1.3. Company Financials
- 12.1.1.4. SWOT Analysis
- 12.1.2 HTGD
- 12.1.2.1. Company Overview
- 12.1.2.2. Products
- 12.1.2.3. Company Financials
- 12.1.2.4. SWOT Analysis
- 12.1.3 Furukawa
- 12.1.3.1. Company Overview
- 12.1.3.2. Products
- 12.1.3.3. Company Financials
- 12.1.3.4. SWOT Analysis
- 12.1.4 Corning
- 12.1.4.1. Company Overview
- 12.1.4.2. Products
- 12.1.4.3. Company Financials
- 12.1.4.4. SWOT Analysis
- 12.1.5 YOFC
- 12.1.5.1. Company Overview
- 12.1.5.2. Products
- 12.1.5.3. Company Financials
- 12.1.5.4. SWOT Analysis
- 12.1.6 Futong
- 12.1.6.1. Company Overview
- 12.1.6.2. Products
- 12.1.6.3. Company Financials
- 12.1.6.4. SWOT Analysis
- 12.1.7 Fujikura
- 12.1.7.1. Company Overview
- 12.1.7.2. Products
- 12.1.7.3. Company Financials
- 12.1.7.4. SWOT Analysis
- 12.1.8 Sumitomo
- 12.1.8.1. Company Overview
- 12.1.8.2. Products
- 12.1.8.3. Company Financials
- 12.1.8.4. SWOT Analysis
- 12.1.9 Tongding Optic-Electronic
- 12.1.9.1. Company Overview
- 12.1.9.2. Products
- 12.1.9.3. Company Financials
- 12.1.9.4. SWOT Analysis
- 12.1.10 CommScope
- 12.1.10.1. Company Overview
- 12.1.10.2. Products
- 12.1.10.3. Company Financials
- 12.1.10.4. SWOT Analysis
- 12.1.11 STL
- 12.1.11.1. Company Overview
- 12.1.11.2. Products
- 12.1.11.3. Company Financials
- 12.1.11.4. SWOT Analysis
- 12.1.12 FiberHome
- 12.1.12.1. Company Overview
- 12.1.12.2. Products
- 12.1.12.3. Company Financials
- 12.1.12.4. SWOT Analysis
- 12.1.13 Jiangsu Etern
- 12.1.13.1. Company Overview
- 12.1.13.2. Products
- 12.1.13.3. Company Financials
- 12.1.13.4. SWOT Analysis
- 12.1.14 ZTT
- 12.1.14.1. Company Overview
- 12.1.14.2. Products
- 12.1.14.3. Company Financials
- 12.1.14.4. SWOT Analysis
- 12.1.15 BELDEN
- 12.1.15.1. Company Overview
- 12.1.15.2. Products
- 12.1.15.3. Company Financials
- 12.1.15.4. SWOT Analysis
- 12.1.16 Fasten
- 12.1.16.1. Company Overview
- 12.1.16.2. Products
- 12.1.16.3. Company Financials
- 12.1.16.4. SWOT Analysis
- 12.1.17 Nexans
- 12.1.17.1. Company Overview
- 12.1.17.2. Products
- 12.1.17.3. Company Financials
- 12.1.17.4. SWOT Analysis
- 12.1.18 Kaile
- 12.1.18.1. Company Overview
- 12.1.18.2. Products
- 12.1.18.3. Company Financials
- 12.1.18.4. SWOT Analysis
- 12.1.19 LS Cable&System
- 12.1.19.1. Company Overview
- 12.1.19.2. Products
- 12.1.19.3. Company Financials
- 12.1.19.4. SWOT Analysis
- 12.1.1 Prysmian
- 12.2. Market Entropy
- 12.2.1 Company's Key Areas Served
- 12.2.2 Recent Developments
- 12.3. Company Market Share Analysis 2025
- 12.3.1 Top 5 Companies Market Share Analysis
- 12.3.2 Top 3 Companies Market Share Analysis
- 12.4. List of Potential Customers
- 13. Research Methodology
List of Figures
- Figure 1: Global High Quality Fiber Optic Revenue Breakdown (billion, %) by Region 2025 & 2033
- Figure 2: North America High Quality Fiber Optic Revenue (billion), by Application 2025 & 2033
- Figure 3: North America High Quality Fiber Optic Revenue Share (%), by Application 2025 & 2033
- Figure 4: North America High Quality Fiber Optic Revenue (billion), by Types 2025 & 2033
- Figure 5: North America High Quality Fiber Optic Revenue Share (%), by Types 2025 & 2033
- Figure 6: North America High Quality Fiber Optic Revenue (billion), by Country 2025 & 2033
- Figure 7: North America High Quality Fiber Optic Revenue Share (%), by Country 2025 & 2033
- Figure 8: South America High Quality Fiber Optic Revenue (billion), by Application 2025 & 2033
- Figure 9: South America High Quality Fiber Optic Revenue Share (%), by Application 2025 & 2033
- Figure 10: South America High Quality Fiber Optic Revenue (billion), by Types 2025 & 2033
- Figure 11: South America High Quality Fiber Optic Revenue Share (%), by Types 2025 & 2033
- Figure 12: South America High Quality Fiber Optic Revenue (billion), by Country 2025 & 2033
- Figure 13: South America High Quality Fiber Optic Revenue Share (%), by Country 2025 & 2033
- Figure 14: Europe High Quality Fiber Optic Revenue (billion), by Application 2025 & 2033
- Figure 15: Europe High Quality Fiber Optic Revenue Share (%), by Application 2025 & 2033
- Figure 16: Europe High Quality Fiber Optic Revenue (billion), by Types 2025 & 2033
- Figure 17: Europe High Quality Fiber Optic Revenue Share (%), by Types 2025 & 2033
- Figure 18: Europe High Quality Fiber Optic Revenue (billion), by Country 2025 & 2033
- Figure 19: Europe High Quality Fiber Optic Revenue Share (%), by Country 2025 & 2033
- Figure 20: Middle East & Africa High Quality Fiber Optic Revenue (billion), by Application 2025 & 2033
- Figure 21: Middle East & Africa High Quality Fiber Optic Revenue Share (%), by Application 2025 & 2033
- Figure 22: Middle East & Africa High Quality Fiber Optic Revenue (billion), by Types 2025 & 2033
- Figure 23: Middle East & Africa High Quality Fiber Optic Revenue Share (%), by Types 2025 & 2033
- Figure 24: Middle East & Africa High Quality Fiber Optic Revenue (billion), by Country 2025 & 2033
- Figure 25: Middle East & Africa High Quality Fiber Optic Revenue Share (%), by Country 2025 & 2033
- Figure 26: Asia Pacific High Quality Fiber Optic Revenue (billion), by Application 2025 & 2033
- Figure 27: Asia Pacific High Quality Fiber Optic Revenue Share (%), by Application 2025 & 2033
- Figure 28: Asia Pacific High Quality Fiber Optic Revenue (billion), by Types 2025 & 2033
- Figure 29: Asia Pacific High Quality Fiber Optic Revenue Share (%), by Types 2025 & 2033
- Figure 30: Asia Pacific High Quality Fiber Optic Revenue (billion), by Country 2025 & 2033
- Figure 31: Asia Pacific High Quality Fiber Optic Revenue Share (%), by Country 2025 & 2033
List of Tables
- Table 1: Global High Quality Fiber Optic Revenue billion Forecast, by Application 2020 & 2033
- Table 2: Global High Quality Fiber Optic Revenue billion Forecast, by Types 2020 & 2033
- Table 3: Global High Quality Fiber Optic Revenue billion Forecast, by Region 2020 & 2033
- Table 4: Global High Quality Fiber Optic Revenue billion Forecast, by Application 2020 & 2033
- Table 5: Global High Quality Fiber Optic Revenue billion Forecast, by Types 2020 & 2033
- Table 6: Global High Quality Fiber Optic Revenue billion Forecast, by Country 2020 & 2033
- Table 7: United States High Quality Fiber Optic Revenue (billion) Forecast, by Application 2020 & 2033
- Table 8: Canada High Quality Fiber Optic Revenue (billion) Forecast, by Application 2020 & 2033
- Table 9: Mexico High Quality Fiber Optic Revenue (billion) Forecast, by Application 2020 & 2033
- Table 10: Global High Quality Fiber Optic Revenue billion Forecast, by Application 2020 & 2033
- Table 11: Global High Quality Fiber Optic Revenue billion Forecast, by Types 2020 & 2033
- Table 12: Global High Quality Fiber Optic Revenue billion Forecast, by Country 2020 & 2033
- Table 13: Brazil High Quality Fiber Optic Revenue (billion) Forecast, by Application 2020 & 2033
- Table 14: Argentina High Quality Fiber Optic Revenue (billion) Forecast, by Application 2020 & 2033
- Table 15: Rest of South America High Quality Fiber Optic Revenue (billion) Forecast, by Application 2020 & 2033
- Table 16: Global High Quality Fiber Optic Revenue billion Forecast, by Application 2020 & 2033
- Table 17: Global High Quality Fiber Optic Revenue billion Forecast, by Types 2020 & 2033
- Table 18: Global High Quality Fiber Optic Revenue billion Forecast, by Country 2020 & 2033
- Table 19: United Kingdom High Quality Fiber Optic Revenue (billion) Forecast, by Application 2020 & 2033
- Table 20: Germany High Quality Fiber Optic Revenue (billion) Forecast, by Application 2020 & 2033
- Table 21: France High Quality Fiber Optic Revenue (billion) Forecast, by Application 2020 & 2033
- Table 22: Italy High Quality Fiber Optic Revenue (billion) Forecast, by Application 2020 & 2033
- Table 23: Spain High Quality Fiber Optic Revenue (billion) Forecast, by Application 2020 & 2033
- Table 24: Russia High Quality Fiber Optic Revenue (billion) Forecast, by Application 2020 & 2033
- Table 25: Benelux High Quality Fiber Optic Revenue (billion) Forecast, by Application 2020 & 2033
- Table 26: Nordics High Quality Fiber Optic Revenue (billion) Forecast, by Application 2020 & 2033
- Table 27: Rest of Europe High Quality Fiber Optic Revenue (billion) Forecast, by Application 2020 & 2033
- Table 28: Global High Quality Fiber Optic Revenue billion Forecast, by Application 2020 & 2033
- Table 29: Global High Quality Fiber Optic Revenue billion Forecast, by Types 2020 & 2033
- Table 30: Global High Quality Fiber Optic Revenue billion Forecast, by Country 2020 & 2033
- Table 31: Turkey High Quality Fiber Optic Revenue (billion) Forecast, by Application 2020 & 2033
- Table 32: Israel High Quality Fiber Optic Revenue (billion) Forecast, by Application 2020 & 2033
- Table 33: GCC High Quality Fiber Optic Revenue (billion) Forecast, by Application 2020 & 2033
- Table 34: North Africa High Quality Fiber Optic Revenue (billion) Forecast, by Application 2020 & 2033
- Table 35: South Africa High Quality Fiber Optic Revenue (billion) Forecast, by Application 2020 & 2033
- Table 36: Rest of Middle East & Africa High Quality Fiber Optic Revenue (billion) Forecast, by Application 2020 & 2033
- Table 37: Global High Quality Fiber Optic Revenue billion Forecast, by Application 2020 & 2033
- Table 38: Global High Quality Fiber Optic Revenue billion Forecast, by Types 2020 & 2033
- Table 39: Global High Quality Fiber Optic Revenue billion Forecast, by Country 2020 & 2033
- Table 40: China High Quality Fiber Optic Revenue (billion) Forecast, by Application 2020 & 2033
- Table 41: India High Quality Fiber Optic Revenue (billion) Forecast, by Application 2020 & 2033
- Table 42: Japan High Quality Fiber Optic Revenue (billion) Forecast, by Application 2020 & 2033
- Table 43: South Korea High Quality Fiber Optic Revenue (billion) Forecast, by Application 2020 & 2033
- Table 44: ASEAN High Quality Fiber Optic Revenue (billion) Forecast, by Application 2020 & 2033
- Table 45: Oceania High Quality Fiber Optic Revenue (billion) Forecast, by Application 2020 & 2033
- Table 46: Rest of Asia Pacific High Quality Fiber Optic Revenue (billion) Forecast, by Application 2020 & 2033
Frequently Asked Questions
1. What is the projected Compound Annual Growth Rate (CAGR) of the High Quality Fiber Optic?
The projected CAGR is approximately 6.86%.
2. Which companies are prominent players in the High Quality Fiber Optic?
Key companies in the market include Prysmian, HTGD, Furukawa, Corning, YOFC, Futong, Fujikura, Sumitomo, Tongding Optic-Electronic, CommScope, STL, FiberHome, Jiangsu Etern, ZTT, BELDEN, Fasten, Nexans, Kaile, LS Cable&System.
3. What are the main segments of the High Quality Fiber Optic?
The market segments include Application, Types.
4. Can you provide details about the market size?
The market size is estimated to be USD 10.74 billion as of 2022.
5. What are some drivers contributing to market growth?
N/A
6. What are the notable trends driving market growth?
N/A
7. Are there any restraints impacting market growth?
N/A
8. Can you provide examples of recent developments in the market?
N/A
9. What pricing options are available for accessing the report?
Pricing options include single-user, multi-user, and enterprise licenses priced at USD 4900.00, USD 7350.00, and USD 9800.00 respectively.
10. Is the market size provided in terms of value or volume?
The market size is provided in terms of value, measured in billion.
11. Are there any specific market keywords associated with the report?
Yes, the market keyword associated with the report is "High Quality Fiber Optic," which aids in identifying and referencing the specific market segment covered.
12. How do I determine which pricing option suits my needs best?
The pricing options vary based on user requirements and access needs. Individual users may opt for single-user licenses, while businesses requiring broader access may choose multi-user or enterprise licenses for cost-effective access to the report.
13. Are there any additional resources or data provided in the High Quality Fiber Optic report?
While the report offers comprehensive insights, it's advisable to review the specific contents or supplementary materials provided to ascertain if additional resources or data are available.
14. How can I stay updated on further developments or reports in the High Quality Fiber Optic?
To stay informed about further developments, trends, and reports in the High Quality Fiber Optic, consider subscribing to industry newsletters, following relevant companies and organizations, or regularly checking reputable industry news sources and publications.
Methodology
Step 1 - Identification of Relevant Samples Size from Population Database


Step 2 - Approaches for Defining Global Market Size (Value, Volume* & Price*)

Note*: In applicable scenarios
Step 3 - Data Sources
Primary Research
- Web Analytics
- Survey Reports
- Research Institute
- Latest Research Reports
- Opinion Leaders
Secondary Research
- Annual Reports
- White Paper
- Latest Press Release
- Industry Association
- Paid Database
- Investor Presentations

Step 4 - Data Triangulation
Involves using different sources of information in order to increase the validity of a study
These sources are likely to be stakeholders in a program - participants, other researchers, program staff, other community members, and so on.
Then we put all data in single framework & apply various statistical tools to find out the dynamic on the market.
During the analysis stage, feedback from the stakeholder groups would be compared to determine areas of agreement as well as areas of divergence