Key Insights
The High Computing Power AI Inference Accelerator market is experiencing explosive growth, projected to reach $14 billion by 2025 and exhibiting a remarkable Compound Annual Growth Rate (CAGR) of 47% from 2025 to 2033. This rapid expansion is driven by several key factors. The increasing demand for real-time AI applications across diverse sectors like autonomous vehicles, healthcare, and finance fuels the need for high-performance inference accelerators. Advancements in deep learning models, requiring significantly more processing power, further accelerate market growth. Furthermore, the continuous miniaturization of hardware and the development of energy-efficient architectures are making high-computing power AI inference accelerators more accessible and cost-effective. The competitive landscape is dynamic, with key players like NVIDIA, Huawei, and others constantly innovating to gain market share.
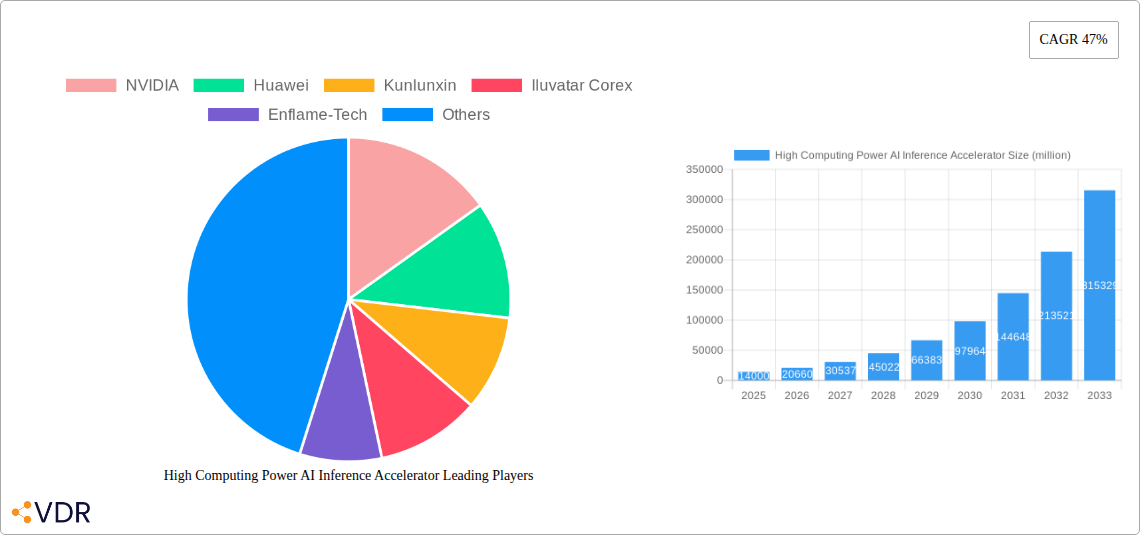
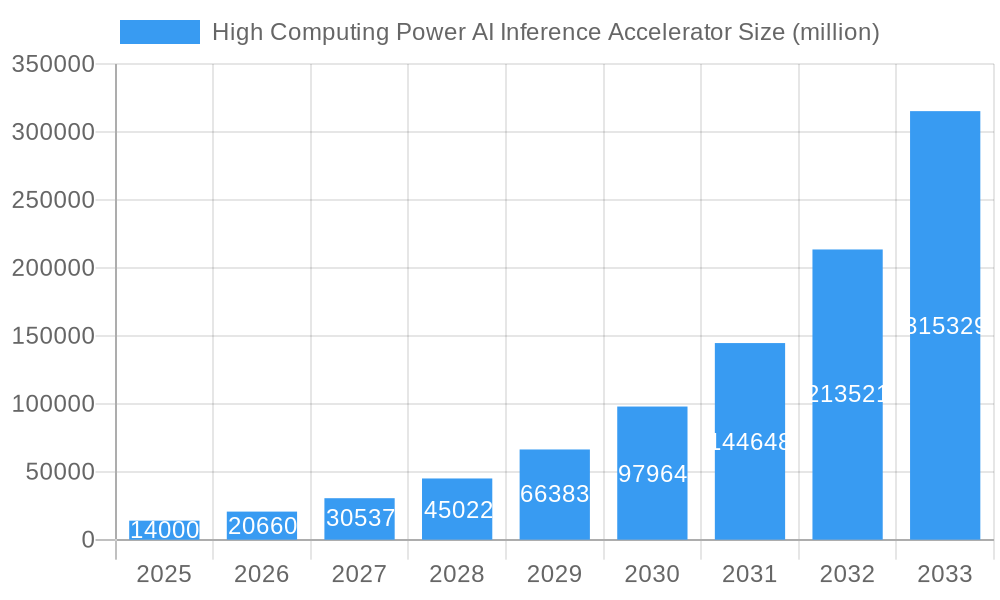
High Computing Power AI Inference Accelerator Market Size (In Billion)
Growth will be influenced by several trends. The rise of edge computing, pushing AI processing closer to data sources, is creating significant opportunities. The development of specialized AI accelerators optimized for specific workloads, such as natural language processing or computer vision, enhances efficiency and performance. However, challenges remain. High initial investment costs for advanced hardware and the need for skilled professionals to implement and maintain these systems could restrain market growth to some extent. Nevertheless, the overall market trajectory indicates a robust and sustained expansion driven by the pervasive adoption of AI across industries.
High Computing Power AI Inference Accelerator Company Market Share
High Computing Power AI Inference Accelerator Market Report: 2019-2033
This comprehensive report provides an in-depth analysis of the High Computing Power AI Inference Accelerator market, encompassing market dynamics, growth trends, regional segmentation, product landscape, key players, and future outlook. The study period covers 2019-2033, with 2025 as the base and estimated year. The forecast period is 2025-2033, and the historical period is 2019-2024. The report caters to industry professionals, investors, and strategic decision-makers seeking a clear understanding of this rapidly evolving market. The market is segmented by various applications and geographical regions, further enhancing the detailed insights available in this detailed analysis. The total market size is projected to reach xx million by 2033.
High Computing Power AI Inference Accelerator Market Dynamics & Structure
The high computing power AI inference accelerator market is characterized by intense competition and rapid technological advancements. Market concentration is moderate, with key players like NVIDIA, Huawei, and others holding significant shares, but a growing number of smaller, specialized companies are emerging. Technological innovation, driven by the demand for faster and more efficient AI processing, is a primary growth driver. Regulatory frameworks, particularly concerning data privacy and security, significantly influence market development. Competitive product substitutes, such as CPUs and GPUs with integrated AI capabilities, exert pressure on specialized accelerator adoption. The end-user demographic is broad, encompassing various industries such as automotive, healthcare, finance, and cloud computing. Mergers and acquisitions (M&A) activity is expected to increase, with larger companies acquiring smaller, specialized firms to expand their product portfolios and capabilities.
- Market Concentration: Moderately concentrated, with top 5 players holding approximately xx% of market share in 2025.
- Technological Innovation: Significant advancements in chip architecture (e.g., specialized AI processors), memory technologies (e.g., high-bandwidth memory), and software optimization are driving growth.
- Regulatory Frameworks: Data privacy regulations (e.g., GDPR, CCPA) are influencing the design and deployment of AI inference accelerators.
- Competitive Substitutes: CPUs and GPUs with integrated AI capabilities offer alternative solutions, but specialized accelerators offer superior performance for specific applications.
- End-User Demographics: Diverse across various industries, with increasing adoption in cloud computing, autonomous driving, and healthcare.
- M&A Trends: Expected increase in M&A activity as larger companies seek to consolidate the market and acquire specialized technologies. xx M&A deals were recorded in the historical period.
High Computing Power AI Inference Accelerator Growth Trends & Insights
The high computing power AI inference accelerator market is experiencing robust growth, driven by the exponential increase in data volume and the rising demand for real-time AI applications. The market size, valued at xx million in 2025, is projected to reach xx million by 2033, exhibiting a Compound Annual Growth Rate (CAGR) of xx%. This growth is fueled by increasing adoption rates across various sectors, particularly in cloud computing and edge AI deployments. Technological disruptions, such as the development of novel architectures and memory technologies, continually enhance performance and efficiency, further accelerating market expansion. Consumer behavior shifts toward increased reliance on AI-powered services and devices are underpinning the demand for high-performance inference accelerators. Market penetration is increasing across diverse industries, with notable growth in the automotive, healthcare, and finance sectors.
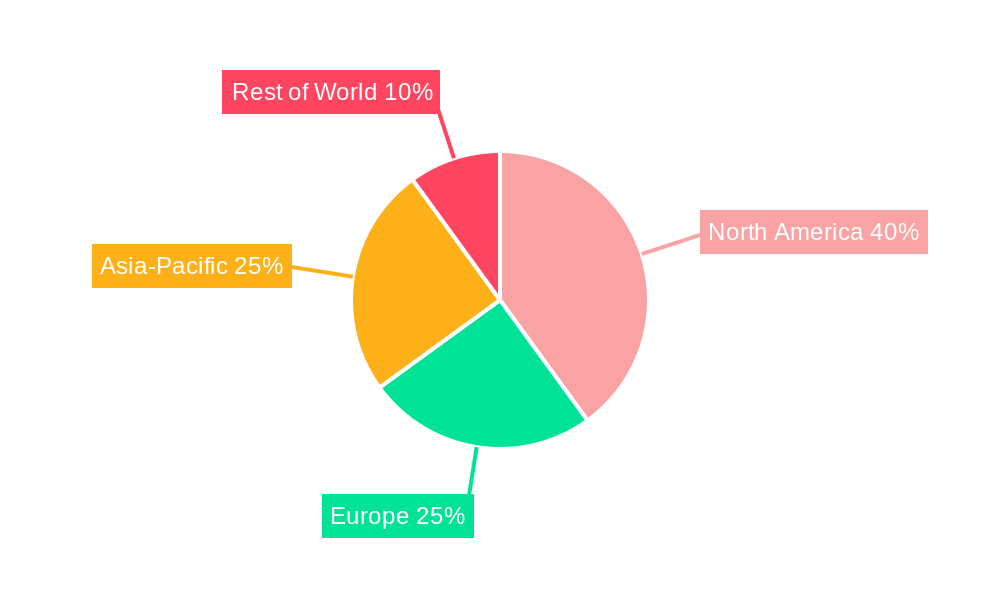
Dominant Regions, Countries, or Segments in High Computing Power AI Inference Accelerator
North America currently holds the largest market share in high computing power AI inference accelerators, driven by strong technological innovation, substantial investment in AI research and development, and the presence of major technology companies. However, the Asia-Pacific region is projected to witness the fastest growth rate due to increasing government initiatives promoting AI adoption, rapidly expanding digital infrastructure, and a large and growing market for AI-powered applications. Specific countries like the United States, China, and Japan are key contributors to market growth.
- Key Drivers in North America: Strong R&D investment, presence of major technology companies, high adoption rates in various industries.
- Key Drivers in Asia-Pacific: Government support for AI development, expanding digital infrastructure, large and growing AI application market.
- Dominance Factors: Technological leadership, investment in R&D, strong market demand, and supportive government policies.
High Computing Power AI Inference Accelerator Product Landscape
The market offers a diverse range of high computing power AI inference accelerators, each with unique selling propositions and technological advancements. These include specialized ASICs (Application-Specific Integrated Circuits) designed for specific AI workloads, FPGAs (Field-Programmable Gate Arrays) offering flexibility and reconfigurability, and specialized GPUs optimized for inference tasks. Key performance metrics such as inference speed, power efficiency, and latency are crucial factors influencing product selection. Continuous innovation in chip architecture, memory technologies, and software optimization leads to improved performance and reduced costs, furthering market expansion.
Key Drivers, Barriers & Challenges in High Computing Power AI Inference Accelerator
Key Drivers: The proliferation of AI applications across various sectors, the increasing demand for real-time AI processing, and continuous advancements in chip architecture are primary drivers. Government support for AI development in several regions, combined with increasing private investment, further accelerates market growth.
Challenges: High initial costs of deployment, the complexity of integrating these accelerators into existing systems, and potential supply chain disruptions pose significant challenges. Furthermore, competition from established players and emerging startups, along with regulatory uncertainties regarding data privacy, create hurdles to market expansion. The dependency on specialized skills and expertise for implementation also presents an obstacle to widespread adoption.
Emerging Opportunities in High Computing Power AI Inference Accelerator
Emerging opportunities lie in the growing adoption of AI in edge computing, the expansion into new applications like autonomous driving and robotics, and the development of more energy-efficient inference accelerators. The untapped potential in developing countries and the increasing demand for AI-powered solutions in healthcare and finance offer significant market expansion opportunities. Furthermore, innovations in neuromorphic computing and other novel architectures could unlock new levels of performance and efficiency.
Growth Accelerators in the High Computing Power AI Inference Accelerator Industry
Technological breakthroughs in chip design and memory technology are driving accelerated growth, complemented by strategic partnerships between hardware and software companies. Market expansion strategies focused on addressing specific industry needs, such as autonomous vehicles or healthcare diagnostics, are key catalysts for long-term growth. Increased investment in AI research and development is fostering innovation and further accelerating market expansion.
Notable Milestones in High Computing Power AI Inference Accelerator Sector
- 2020: NVIDIA launches Ampere architecture GPUs with enhanced AI inference capabilities.
- 2021: Huawei unveils its Ascend AI processor series for data centers and edge deployments.
- 2022: Several significant mergers and acquisitions occur within the high-performance computing sector, consolidating market share.
- 2023: Cambrian releases a new generation of AI inference chips with improved energy efficiency.
In-Depth High Computing Power AI Inference Accelerator Market Outlook
The future of the high computing power AI inference accelerator market appears bright, driven by unrelenting technological progress, increasing demand from diverse sectors, and favorable government policies. Strategic opportunities exist for companies focusing on developing energy-efficient solutions, expanding into new applications, and creating robust partnerships across the industry ecosystem. The market is poised for substantial growth, presenting significant returns for both established players and innovative startups.
High Computing Power AI Inference Accelerator Segmentation
-
1. Application
- 1.1. Cloud Deployment
- 1.2. Terminal Deployment
-
2. Types
- 2.1. CPU+GPU
- 2.2. CPU+FPGA
- 2.3. CPU+ASIC
- 2.4. Other
High Computing Power AI Inference Accelerator Segmentation By Geography
-
1. North America
- 1.1. United States
- 1.2. Canada
- 1.3. Mexico
-
2. South America
- 2.1. Brazil
- 2.2. Argentina
- 2.3. Rest of South America
-
3. Europe
- 3.1. United Kingdom
- 3.2. Germany
- 3.3. France
- 3.4. Italy
- 3.5. Spain
- 3.6. Russia
- 3.7. Benelux
- 3.8. Nordics
- 3.9. Rest of Europe
-
4. Middle East & Africa
- 4.1. Turkey
- 4.2. Israel
- 4.3. GCC
- 4.4. North Africa
- 4.5. South Africa
- 4.6. Rest of Middle East & Africa
-
5. Asia Pacific
- 5.1. China
- 5.2. India
- 5.3. Japan
- 5.4. South Korea
- 5.5. ASEAN
- 5.6. Oceania
- 5.7. Rest of Asia Pacific
High Computing Power AI Inference Accelerator Regional Market Share
Geographic Coverage of High Computing Power AI Inference Accelerator
High Computing Power AI Inference Accelerator REPORT HIGHLIGHTS
| Aspects | Details |
|---|---|
| Study Period | 2020-2034 |
| Base Year | 2025 |
| Estimated Year | 2026 |
| Forecast Period | 2026-2034 |
| Historical Period | 2020-2025 |
| Growth Rate | CAGR of 47% from 2020-2034 |
| Segmentation |
|
Table of Contents
- 1. Introduction
- 1.1. Research Scope
- 1.2. Market Segmentation
- 1.3. Research Objective
- 1.4. Definitions and Assumptions
- 2. Executive Summary
- 2.1. Market Snapshot
- 3. Market Dynamics
- 3.1. Market Drivers
- 3.2. Market Restrains
- 3.3. Market Trends
- 3.4. Market Opportunities
- 4. Market Factor Analysis
- 4.1. Porters Five Forces
- 4.1.1. Bargaining Power of Suppliers
- 4.1.2. Bargaining Power of Buyers
- 4.1.3. Threat of New Entrants
- 4.1.4. Threat of Substitutes
- 4.1.5. Competitive Rivalry
- 4.2. PESTEL analysis
- 4.3. BCG Analysis
- 4.3.1. Stars (High Growth, High Market Share)
- 4.3.2. Cash Cows (Low Growth, High Market Share)
- 4.3.3. Question Mark (High Growth, Low Market Share)
- 4.3.4. Dogs (Low Growth, Low Market Share)
- 4.4. Ansoff Matrix Analysis
- 4.5. Supply Chain Analysis
- 4.6. Regulatory Landscape
- 4.7. Current Market Potential and Opportunity Assessment (TAM–SAM–SOM Framework)
- 4.8. VDR Analyst Note
- 4.1. Porters Five Forces
- 5. Market Analysis, Insights and Forecast 2021-2033
- 5.1. Market Analysis, Insights and Forecast - by Application
- 5.1.1. Cloud Deployment
- 5.1.2. Terminal Deployment
- 5.2. Market Analysis, Insights and Forecast - by Types
- 5.2.1. CPU+GPU
- 5.2.2. CPU+FPGA
- 5.2.3. CPU+ASIC
- 5.2.4. Other
- 5.3. Market Analysis, Insights and Forecast - by Region
- 5.3.1. North America
- 5.3.2. South America
- 5.3.3. Europe
- 5.3.4. Middle East & Africa
- 5.3.5. Asia Pacific
- 5.1. Market Analysis, Insights and Forecast - by Application
- 6. Global High Computing Power AI Inference Accelerator Analysis, Insights and Forecast, 2021-2033
- 6.1. Market Analysis, Insights and Forecast - by Application
- 6.1.1. Cloud Deployment
- 6.1.2. Terminal Deployment
- 6.2. Market Analysis, Insights and Forecast - by Types
- 6.2.1. CPU+GPU
- 6.2.2. CPU+FPGA
- 6.2.3. CPU+ASIC
- 6.2.4. Other
- 6.1. Market Analysis, Insights and Forecast - by Application
- 7. North America High Computing Power AI Inference Accelerator Analysis, Insights and Forecast, 2021-2033
- 7.1. Market Analysis, Insights and Forecast - by Application
- 7.1.1. Cloud Deployment
- 7.1.2. Terminal Deployment
- 7.2. Market Analysis, Insights and Forecast - by Types
- 7.2.1. CPU+GPU
- 7.2.2. CPU+FPGA
- 7.2.3. CPU+ASIC
- 7.2.4. Other
- 7.1. Market Analysis, Insights and Forecast - by Application
- 8. South America High Computing Power AI Inference Accelerator Analysis, Insights and Forecast, 2021-2033
- 8.1. Market Analysis, Insights and Forecast - by Application
- 8.1.1. Cloud Deployment
- 8.1.2. Terminal Deployment
- 8.2. Market Analysis, Insights and Forecast - by Types
- 8.2.1. CPU+GPU
- 8.2.2. CPU+FPGA
- 8.2.3. CPU+ASIC
- 8.2.4. Other
- 8.1. Market Analysis, Insights and Forecast - by Application
- 9. Europe High Computing Power AI Inference Accelerator Analysis, Insights and Forecast, 2021-2033
- 9.1. Market Analysis, Insights and Forecast - by Application
- 9.1.1. Cloud Deployment
- 9.1.2. Terminal Deployment
- 9.2. Market Analysis, Insights and Forecast - by Types
- 9.2.1. CPU+GPU
- 9.2.2. CPU+FPGA
- 9.2.3. CPU+ASIC
- 9.2.4. Other
- 9.1. Market Analysis, Insights and Forecast - by Application
- 10. Middle East & Africa High Computing Power AI Inference Accelerator Analysis, Insights and Forecast, 2021-2033
- 10.1. Market Analysis, Insights and Forecast - by Application
- 10.1.1. Cloud Deployment
- 10.1.2. Terminal Deployment
- 10.2. Market Analysis, Insights and Forecast - by Types
- 10.2.1. CPU+GPU
- 10.2.2. CPU+FPGA
- 10.2.3. CPU+ASIC
- 10.2.4. Other
- 10.1. Market Analysis, Insights and Forecast - by Application
- 11. Asia Pacific High Computing Power AI Inference Accelerator Analysis, Insights and Forecast, 2021-2033
- 11.1. Market Analysis, Insights and Forecast - by Application
- 11.1.1. Cloud Deployment
- 11.1.2. Terminal Deployment
- 11.2. Market Analysis, Insights and Forecast - by Types
- 11.2.1. CPU+GPU
- 11.2.2. CPU+FPGA
- 11.2.3. CPU+ASIC
- 11.2.4. Other
- 11.1. Market Analysis, Insights and Forecast - by Application
- 12. Competitive Analysis
- 12.1. Company Profiles
- 12.1.1 NVIDIA
- 12.1.1.1. Company Overview
- 12.1.1.2. Products
- 12.1.1.3. Company Financials
- 12.1.1.4. SWOT Analysis
- 12.1.2 Huawei
- 12.1.2.1. Company Overview
- 12.1.2.2. Products
- 12.1.2.3. Company Financials
- 12.1.2.4. SWOT Analysis
- 12.1.3 Kunlunxin
- 12.1.3.1. Company Overview
- 12.1.3.2. Products
- 12.1.3.3. Company Financials
- 12.1.3.4. SWOT Analysis
- 12.1.4 Iluvatar Corex
- 12.1.4.1. Company Overview
- 12.1.4.2. Products
- 12.1.4.3. Company Financials
- 12.1.4.4. SWOT Analysis
- 12.1.5 Enflame-Tech
- 12.1.5.1. Company Overview
- 12.1.5.2. Products
- 12.1.5.3. Company Financials
- 12.1.5.4. SWOT Analysis
- 12.1.6 Cambrian
- 12.1.6.1. Company Overview
- 12.1.6.2. Products
- 12.1.6.3. Company Financials
- 12.1.6.4. SWOT Analysis
- 12.1.1 NVIDIA
- 12.2. Market Entropy
- 12.2.1 Company's Key Areas Served
- 12.2.2 Recent Developments
- 12.3. Company Market Share Analysis 2025
- 12.3.1 Top 5 Companies Market Share Analysis
- 12.3.2 Top 3 Companies Market Share Analysis
- 12.4. List of Potential Customers
- 13. Research Methodology
List of Figures
- Figure 1: Global High Computing Power AI Inference Accelerator Revenue Breakdown (million, %) by Region 2025 & 2033
- Figure 2: Global High Computing Power AI Inference Accelerator Volume Breakdown (K, %) by Region 2025 & 2033
- Figure 3: North America High Computing Power AI Inference Accelerator Revenue (million), by Application 2025 & 2033
- Figure 4: North America High Computing Power AI Inference Accelerator Volume (K), by Application 2025 & 2033
- Figure 5: North America High Computing Power AI Inference Accelerator Revenue Share (%), by Application 2025 & 2033
- Figure 6: North America High Computing Power AI Inference Accelerator Volume Share (%), by Application 2025 & 2033
- Figure 7: North America High Computing Power AI Inference Accelerator Revenue (million), by Types 2025 & 2033
- Figure 8: North America High Computing Power AI Inference Accelerator Volume (K), by Types 2025 & 2033
- Figure 9: North America High Computing Power AI Inference Accelerator Revenue Share (%), by Types 2025 & 2033
- Figure 10: North America High Computing Power AI Inference Accelerator Volume Share (%), by Types 2025 & 2033
- Figure 11: North America High Computing Power AI Inference Accelerator Revenue (million), by Country 2025 & 2033
- Figure 12: North America High Computing Power AI Inference Accelerator Volume (K), by Country 2025 & 2033
- Figure 13: North America High Computing Power AI Inference Accelerator Revenue Share (%), by Country 2025 & 2033
- Figure 14: North America High Computing Power AI Inference Accelerator Volume Share (%), by Country 2025 & 2033
- Figure 15: South America High Computing Power AI Inference Accelerator Revenue (million), by Application 2025 & 2033
- Figure 16: South America High Computing Power AI Inference Accelerator Volume (K), by Application 2025 & 2033
- Figure 17: South America High Computing Power AI Inference Accelerator Revenue Share (%), by Application 2025 & 2033
- Figure 18: South America High Computing Power AI Inference Accelerator Volume Share (%), by Application 2025 & 2033
- Figure 19: South America High Computing Power AI Inference Accelerator Revenue (million), by Types 2025 & 2033
- Figure 20: South America High Computing Power AI Inference Accelerator Volume (K), by Types 2025 & 2033
- Figure 21: South America High Computing Power AI Inference Accelerator Revenue Share (%), by Types 2025 & 2033
- Figure 22: South America High Computing Power AI Inference Accelerator Volume Share (%), by Types 2025 & 2033
- Figure 23: South America High Computing Power AI Inference Accelerator Revenue (million), by Country 2025 & 2033
- Figure 24: South America High Computing Power AI Inference Accelerator Volume (K), by Country 2025 & 2033
- Figure 25: South America High Computing Power AI Inference Accelerator Revenue Share (%), by Country 2025 & 2033
- Figure 26: South America High Computing Power AI Inference Accelerator Volume Share (%), by Country 2025 & 2033
- Figure 27: Europe High Computing Power AI Inference Accelerator Revenue (million), by Application 2025 & 2033
- Figure 28: Europe High Computing Power AI Inference Accelerator Volume (K), by Application 2025 & 2033
- Figure 29: Europe High Computing Power AI Inference Accelerator Revenue Share (%), by Application 2025 & 2033
- Figure 30: Europe High Computing Power AI Inference Accelerator Volume Share (%), by Application 2025 & 2033
- Figure 31: Europe High Computing Power AI Inference Accelerator Revenue (million), by Types 2025 & 2033
- Figure 32: Europe High Computing Power AI Inference Accelerator Volume (K), by Types 2025 & 2033
- Figure 33: Europe High Computing Power AI Inference Accelerator Revenue Share (%), by Types 2025 & 2033
- Figure 34: Europe High Computing Power AI Inference Accelerator Volume Share (%), by Types 2025 & 2033
- Figure 35: Europe High Computing Power AI Inference Accelerator Revenue (million), by Country 2025 & 2033
- Figure 36: Europe High Computing Power AI Inference Accelerator Volume (K), by Country 2025 & 2033
- Figure 37: Europe High Computing Power AI Inference Accelerator Revenue Share (%), by Country 2025 & 2033
- Figure 38: Europe High Computing Power AI Inference Accelerator Volume Share (%), by Country 2025 & 2033
- Figure 39: Middle East & Africa High Computing Power AI Inference Accelerator Revenue (million), by Application 2025 & 2033
- Figure 40: Middle East & Africa High Computing Power AI Inference Accelerator Volume (K), by Application 2025 & 2033
- Figure 41: Middle East & Africa High Computing Power AI Inference Accelerator Revenue Share (%), by Application 2025 & 2033
- Figure 42: Middle East & Africa High Computing Power AI Inference Accelerator Volume Share (%), by Application 2025 & 2033
- Figure 43: Middle East & Africa High Computing Power AI Inference Accelerator Revenue (million), by Types 2025 & 2033
- Figure 44: Middle East & Africa High Computing Power AI Inference Accelerator Volume (K), by Types 2025 & 2033
- Figure 45: Middle East & Africa High Computing Power AI Inference Accelerator Revenue Share (%), by Types 2025 & 2033
- Figure 46: Middle East & Africa High Computing Power AI Inference Accelerator Volume Share (%), by Types 2025 & 2033
- Figure 47: Middle East & Africa High Computing Power AI Inference Accelerator Revenue (million), by Country 2025 & 2033
- Figure 48: Middle East & Africa High Computing Power AI Inference Accelerator Volume (K), by Country 2025 & 2033
- Figure 49: Middle East & Africa High Computing Power AI Inference Accelerator Revenue Share (%), by Country 2025 & 2033
- Figure 50: Middle East & Africa High Computing Power AI Inference Accelerator Volume Share (%), by Country 2025 & 2033
- Figure 51: Asia Pacific High Computing Power AI Inference Accelerator Revenue (million), by Application 2025 & 2033
- Figure 52: Asia Pacific High Computing Power AI Inference Accelerator Volume (K), by Application 2025 & 2033
- Figure 53: Asia Pacific High Computing Power AI Inference Accelerator Revenue Share (%), by Application 2025 & 2033
- Figure 54: Asia Pacific High Computing Power AI Inference Accelerator Volume Share (%), by Application 2025 & 2033
- Figure 55: Asia Pacific High Computing Power AI Inference Accelerator Revenue (million), by Types 2025 & 2033
- Figure 56: Asia Pacific High Computing Power AI Inference Accelerator Volume (K), by Types 2025 & 2033
- Figure 57: Asia Pacific High Computing Power AI Inference Accelerator Revenue Share (%), by Types 2025 & 2033
- Figure 58: Asia Pacific High Computing Power AI Inference Accelerator Volume Share (%), by Types 2025 & 2033
- Figure 59: Asia Pacific High Computing Power AI Inference Accelerator Revenue (million), by Country 2025 & 2033
- Figure 60: Asia Pacific High Computing Power AI Inference Accelerator Volume (K), by Country 2025 & 2033
- Figure 61: Asia Pacific High Computing Power AI Inference Accelerator Revenue Share (%), by Country 2025 & 2033
- Figure 62: Asia Pacific High Computing Power AI Inference Accelerator Volume Share (%), by Country 2025 & 2033
List of Tables
- Table 1: Global High Computing Power AI Inference Accelerator Revenue million Forecast, by Application 2020 & 2033
- Table 2: Global High Computing Power AI Inference Accelerator Volume K Forecast, by Application 2020 & 2033
- Table 3: Global High Computing Power AI Inference Accelerator Revenue million Forecast, by Types 2020 & 2033
- Table 4: Global High Computing Power AI Inference Accelerator Volume K Forecast, by Types 2020 & 2033
- Table 5: Global High Computing Power AI Inference Accelerator Revenue million Forecast, by Region 2020 & 2033
- Table 6: Global High Computing Power AI Inference Accelerator Volume K Forecast, by Region 2020 & 2033
- Table 7: Global High Computing Power AI Inference Accelerator Revenue million Forecast, by Application 2020 & 2033
- Table 8: Global High Computing Power AI Inference Accelerator Volume K Forecast, by Application 2020 & 2033
- Table 9: Global High Computing Power AI Inference Accelerator Revenue million Forecast, by Types 2020 & 2033
- Table 10: Global High Computing Power AI Inference Accelerator Volume K Forecast, by Types 2020 & 2033
- Table 11: Global High Computing Power AI Inference Accelerator Revenue million Forecast, by Country 2020 & 2033
- Table 12: Global High Computing Power AI Inference Accelerator Volume K Forecast, by Country 2020 & 2033
- Table 13: United States High Computing Power AI Inference Accelerator Revenue (million) Forecast, by Application 2020 & 2033
- Table 14: United States High Computing Power AI Inference Accelerator Volume (K) Forecast, by Application 2020 & 2033
- Table 15: Canada High Computing Power AI Inference Accelerator Revenue (million) Forecast, by Application 2020 & 2033
- Table 16: Canada High Computing Power AI Inference Accelerator Volume (K) Forecast, by Application 2020 & 2033
- Table 17: Mexico High Computing Power AI Inference Accelerator Revenue (million) Forecast, by Application 2020 & 2033
- Table 18: Mexico High Computing Power AI Inference Accelerator Volume (K) Forecast, by Application 2020 & 2033
- Table 19: Global High Computing Power AI Inference Accelerator Revenue million Forecast, by Application 2020 & 2033
- Table 20: Global High Computing Power AI Inference Accelerator Volume K Forecast, by Application 2020 & 2033
- Table 21: Global High Computing Power AI Inference Accelerator Revenue million Forecast, by Types 2020 & 2033
- Table 22: Global High Computing Power AI Inference Accelerator Volume K Forecast, by Types 2020 & 2033
- Table 23: Global High Computing Power AI Inference Accelerator Revenue million Forecast, by Country 2020 & 2033
- Table 24: Global High Computing Power AI Inference Accelerator Volume K Forecast, by Country 2020 & 2033
- Table 25: Brazil High Computing Power AI Inference Accelerator Revenue (million) Forecast, by Application 2020 & 2033
- Table 26: Brazil High Computing Power AI Inference Accelerator Volume (K) Forecast, by Application 2020 & 2033
- Table 27: Argentina High Computing Power AI Inference Accelerator Revenue (million) Forecast, by Application 2020 & 2033
- Table 28: Argentina High Computing Power AI Inference Accelerator Volume (K) Forecast, by Application 2020 & 2033
- Table 29: Rest of South America High Computing Power AI Inference Accelerator Revenue (million) Forecast, by Application 2020 & 2033
- Table 30: Rest of South America High Computing Power AI Inference Accelerator Volume (K) Forecast, by Application 2020 & 2033
- Table 31: Global High Computing Power AI Inference Accelerator Revenue million Forecast, by Application 2020 & 2033
- Table 32: Global High Computing Power AI Inference Accelerator Volume K Forecast, by Application 2020 & 2033
- Table 33: Global High Computing Power AI Inference Accelerator Revenue million Forecast, by Types 2020 & 2033
- Table 34: Global High Computing Power AI Inference Accelerator Volume K Forecast, by Types 2020 & 2033
- Table 35: Global High Computing Power AI Inference Accelerator Revenue million Forecast, by Country 2020 & 2033
- Table 36: Global High Computing Power AI Inference Accelerator Volume K Forecast, by Country 2020 & 2033
- Table 37: United Kingdom High Computing Power AI Inference Accelerator Revenue (million) Forecast, by Application 2020 & 2033
- Table 38: United Kingdom High Computing Power AI Inference Accelerator Volume (K) Forecast, by Application 2020 & 2033
- Table 39: Germany High Computing Power AI Inference Accelerator Revenue (million) Forecast, by Application 2020 & 2033
- Table 40: Germany High Computing Power AI Inference Accelerator Volume (K) Forecast, by Application 2020 & 2033
- Table 41: France High Computing Power AI Inference Accelerator Revenue (million) Forecast, by Application 2020 & 2033
- Table 42: France High Computing Power AI Inference Accelerator Volume (K) Forecast, by Application 2020 & 2033
- Table 43: Italy High Computing Power AI Inference Accelerator Revenue (million) Forecast, by Application 2020 & 2033
- Table 44: Italy High Computing Power AI Inference Accelerator Volume (K) Forecast, by Application 2020 & 2033
- Table 45: Spain High Computing Power AI Inference Accelerator Revenue (million) Forecast, by Application 2020 & 2033
- Table 46: Spain High Computing Power AI Inference Accelerator Volume (K) Forecast, by Application 2020 & 2033
- Table 47: Russia High Computing Power AI Inference Accelerator Revenue (million) Forecast, by Application 2020 & 2033
- Table 48: Russia High Computing Power AI Inference Accelerator Volume (K) Forecast, by Application 2020 & 2033
- Table 49: Benelux High Computing Power AI Inference Accelerator Revenue (million) Forecast, by Application 2020 & 2033
- Table 50: Benelux High Computing Power AI Inference Accelerator Volume (K) Forecast, by Application 2020 & 2033
- Table 51: Nordics High Computing Power AI Inference Accelerator Revenue (million) Forecast, by Application 2020 & 2033
- Table 52: Nordics High Computing Power AI Inference Accelerator Volume (K) Forecast, by Application 2020 & 2033
- Table 53: Rest of Europe High Computing Power AI Inference Accelerator Revenue (million) Forecast, by Application 2020 & 2033
- Table 54: Rest of Europe High Computing Power AI Inference Accelerator Volume (K) Forecast, by Application 2020 & 2033
- Table 55: Global High Computing Power AI Inference Accelerator Revenue million Forecast, by Application 2020 & 2033
- Table 56: Global High Computing Power AI Inference Accelerator Volume K Forecast, by Application 2020 & 2033
- Table 57: Global High Computing Power AI Inference Accelerator Revenue million Forecast, by Types 2020 & 2033
- Table 58: Global High Computing Power AI Inference Accelerator Volume K Forecast, by Types 2020 & 2033
- Table 59: Global High Computing Power AI Inference Accelerator Revenue million Forecast, by Country 2020 & 2033
- Table 60: Global High Computing Power AI Inference Accelerator Volume K Forecast, by Country 2020 & 2033
- Table 61: Turkey High Computing Power AI Inference Accelerator Revenue (million) Forecast, by Application 2020 & 2033
- Table 62: Turkey High Computing Power AI Inference Accelerator Volume (K) Forecast, by Application 2020 & 2033
- Table 63: Israel High Computing Power AI Inference Accelerator Revenue (million) Forecast, by Application 2020 & 2033
- Table 64: Israel High Computing Power AI Inference Accelerator Volume (K) Forecast, by Application 2020 & 2033
- Table 65: GCC High Computing Power AI Inference Accelerator Revenue (million) Forecast, by Application 2020 & 2033
- Table 66: GCC High Computing Power AI Inference Accelerator Volume (K) Forecast, by Application 2020 & 2033
- Table 67: North Africa High Computing Power AI Inference Accelerator Revenue (million) Forecast, by Application 2020 & 2033
- Table 68: North Africa High Computing Power AI Inference Accelerator Volume (K) Forecast, by Application 2020 & 2033
- Table 69: South Africa High Computing Power AI Inference Accelerator Revenue (million) Forecast, by Application 2020 & 2033
- Table 70: South Africa High Computing Power AI Inference Accelerator Volume (K) Forecast, by Application 2020 & 2033
- Table 71: Rest of Middle East & Africa High Computing Power AI Inference Accelerator Revenue (million) Forecast, by Application 2020 & 2033
- Table 72: Rest of Middle East & Africa High Computing Power AI Inference Accelerator Volume (K) Forecast, by Application 2020 & 2033
- Table 73: Global High Computing Power AI Inference Accelerator Revenue million Forecast, by Application 2020 & 2033
- Table 74: Global High Computing Power AI Inference Accelerator Volume K Forecast, by Application 2020 & 2033
- Table 75: Global High Computing Power AI Inference Accelerator Revenue million Forecast, by Types 2020 & 2033
- Table 76: Global High Computing Power AI Inference Accelerator Volume K Forecast, by Types 2020 & 2033
- Table 77: Global High Computing Power AI Inference Accelerator Revenue million Forecast, by Country 2020 & 2033
- Table 78: Global High Computing Power AI Inference Accelerator Volume K Forecast, by Country 2020 & 2033
- Table 79: China High Computing Power AI Inference Accelerator Revenue (million) Forecast, by Application 2020 & 2033
- Table 80: China High Computing Power AI Inference Accelerator Volume (K) Forecast, by Application 2020 & 2033
- Table 81: India High Computing Power AI Inference Accelerator Revenue (million) Forecast, by Application 2020 & 2033
- Table 82: India High Computing Power AI Inference Accelerator Volume (K) Forecast, by Application 2020 & 2033
- Table 83: Japan High Computing Power AI Inference Accelerator Revenue (million) Forecast, by Application 2020 & 2033
- Table 84: Japan High Computing Power AI Inference Accelerator Volume (K) Forecast, by Application 2020 & 2033
- Table 85: South Korea High Computing Power AI Inference Accelerator Revenue (million) Forecast, by Application 2020 & 2033
- Table 86: South Korea High Computing Power AI Inference Accelerator Volume (K) Forecast, by Application 2020 & 2033
- Table 87: ASEAN High Computing Power AI Inference Accelerator Revenue (million) Forecast, by Application 2020 & 2033
- Table 88: ASEAN High Computing Power AI Inference Accelerator Volume (K) Forecast, by Application 2020 & 2033
- Table 89: Oceania High Computing Power AI Inference Accelerator Revenue (million) Forecast, by Application 2020 & 2033
- Table 90: Oceania High Computing Power AI Inference Accelerator Volume (K) Forecast, by Application 2020 & 2033
- Table 91: Rest of Asia Pacific High Computing Power AI Inference Accelerator Revenue (million) Forecast, by Application 2020 & 2033
- Table 92: Rest of Asia Pacific High Computing Power AI Inference Accelerator Volume (K) Forecast, by Application 2020 & 2033
Frequently Asked Questions
1. What is the projected Compound Annual Growth Rate (CAGR) of the High Computing Power AI Inference Accelerator?
The projected CAGR is approximately 47%.
2. Which companies are prominent players in the High Computing Power AI Inference Accelerator?
Key companies in the market include NVIDIA, Huawei, Kunlunxin, Iluvatar Corex, Enflame-Tech, Cambrian.
3. What are the main segments of the High Computing Power AI Inference Accelerator?
The market segments include Application, Types.
4. Can you provide details about the market size?
The market size is estimated to be USD 14000 million as of 2022.
5. What are some drivers contributing to market growth?
N/A
6. What are the notable trends driving market growth?
N/A
7. Are there any restraints impacting market growth?
N/A
8. Can you provide examples of recent developments in the market?
N/A
9. What pricing options are available for accessing the report?
Pricing options include single-user, multi-user, and enterprise licenses priced at USD 4350.00, USD 6525.00, and USD 8700.00 respectively.
10. Is the market size provided in terms of value or volume?
The market size is provided in terms of value, measured in million and volume, measured in K.
11. Are there any specific market keywords associated with the report?
Yes, the market keyword associated with the report is "High Computing Power AI Inference Accelerator," which aids in identifying and referencing the specific market segment covered.
12. How do I determine which pricing option suits my needs best?
The pricing options vary based on user requirements and access needs. Individual users may opt for single-user licenses, while businesses requiring broader access may choose multi-user or enterprise licenses for cost-effective access to the report.
13. Are there any additional resources or data provided in the High Computing Power AI Inference Accelerator report?
While the report offers comprehensive insights, it's advisable to review the specific contents or supplementary materials provided to ascertain if additional resources or data are available.
14. How can I stay updated on further developments or reports in the High Computing Power AI Inference Accelerator?
To stay informed about further developments, trends, and reports in the High Computing Power AI Inference Accelerator, consider subscribing to industry newsletters, following relevant companies and organizations, or regularly checking reputable industry news sources and publications.
Methodology
Step 1 - Identification of Relevant Samples Size from Population Database


Step 2 - Approaches for Defining Global Market Size (Value, Volume* & Price*)

Note*: In applicable scenarios
Step 3 - Data Sources
Primary Research
- Web Analytics
- Survey Reports
- Research Institute
- Latest Research Reports
- Opinion Leaders
Secondary Research
- Annual Reports
- White Paper
- Latest Press Release
- Industry Association
- Paid Database
- Investor Presentations

Step 4 - Data Triangulation
Involves using different sources of information in order to increase the validity of a study
These sources are likely to be stakeholders in a program - participants, other researchers, program staff, other community members, and so on.
Then we put all data in single framework & apply various statistical tools to find out the dynamic on the market.
During the analysis stage, feedback from the stakeholder groups would be compared to determine areas of agreement as well as areas of divergence

