
Key Insights
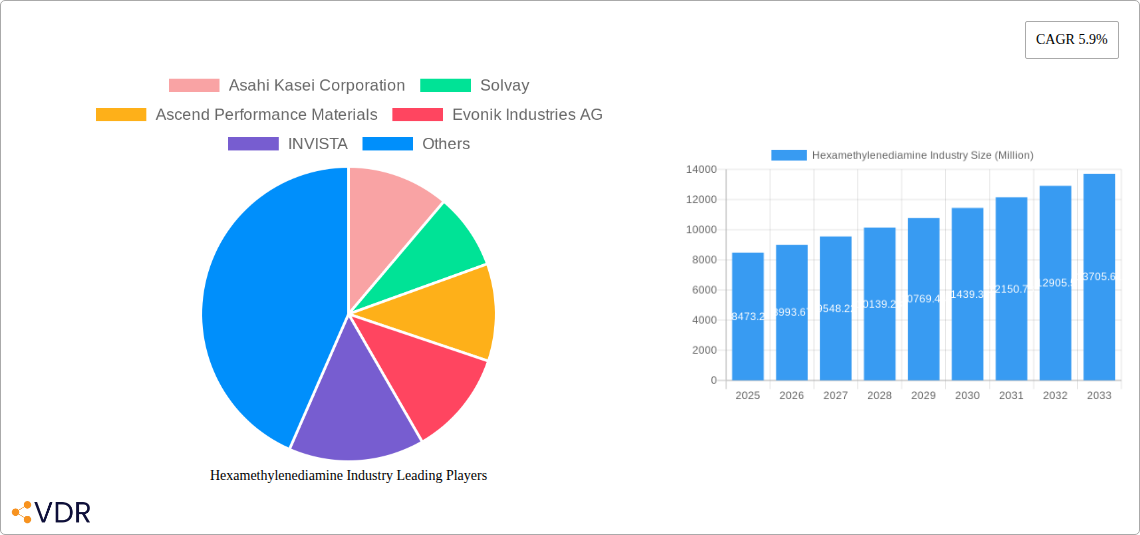
The global hexamethylenediamine (HMDA) market, valued at $8,473.20 million in 2025, is projected to experience robust growth, driven by the expanding nylon production sector. Nylon, a significant application of HMDA, is witnessing increased demand across textiles, automotive, and plastics industries due to its versatility and strength. The rising popularity of high-performance polymers and advanced materials in diverse end-use sectors further fuels market expansion. Coatings and biocides, representing other key HMDA applications, are also experiencing growth, particularly driven by increasing infrastructural development and heightened awareness of hygiene and sanitation. While factors like fluctuating raw material prices and environmental regulations may pose some restraints, technological advancements in HMDA production and the exploration of sustainable alternatives are expected to mitigate these challenges. The Asia-Pacific region, spearheaded by China and India, is anticipated to dominate the HMDA market owing to the robust growth of the manufacturing and construction sectors in these countries. Major market players, including Asahi Kasei Corporation, Solvay, and BASF SE, are actively investing in research and development to improve production efficiency and enhance product offerings, further driving market competition and innovation. The market’s consistent growth is expected to continue throughout the forecast period (2025-2033), with a Compound Annual Growth Rate (CAGR) of 5.9%.
The segmentation of the HMDA market reveals that nylon production holds the largest share, reflecting the material's critical role in various applications. Within the end-user industries, the textile sector displays significant demand due to nylon’s use in apparel and carpets. However, the automotive and plastics sectors are exhibiting faster growth rates, suggesting a shift towards higher-performance applications. The competitive landscape is characterized by the presence of both established chemical giants and emerging players focusing on sustainable and bio-based HMDA production. Regional growth patterns will likely see variations based on economic development and industrialization across different regions. North America and Europe, though mature markets, are expected to continue their steady growth trajectory, while Asia-Pacific holds significant potential for rapid expansion. The future of the HMDA market appears promising, with continued growth fueled by technological innovation, expanding end-use applications, and the ongoing development of sustainable alternatives.
Hexamethylenediamine Industry Market Report: 2019-2033
This comprehensive report provides an in-depth analysis of the global hexamethylenediamine (HMDA) industry, encompassing market dynamics, growth trends, regional segmentation, and key player strategies. The study covers the period 2019-2033, with a focus on the forecast period 2025-2033 and a base year of 2025. This report is essential for industry professionals, investors, and researchers seeking a thorough understanding of this vital chemical market and its future trajectory. The report is valued at xx Million units in 2025.
Hexamethylenediamine Industry Market Dynamics & Structure
The global hexamethylenediamine market is characterized by moderate concentration, with several major players holding significant market share. The industry is driven by technological innovations focused on sustainable production methods and enhanced product performance. Stringent environmental regulations are shaping manufacturing processes, pushing companies towards greener alternatives. The market faces competition from substitute materials in specific applications, though HMDA's unique properties maintain its dominance in key sectors. End-user demographics, particularly in the growing automotive and textile industries, significantly influence demand. M&A activity has been moderate, with strategic partnerships playing a more prominent role in recent years.
- Market Concentration: Moderately concentrated, with the top 5 players holding approximately xx% market share in 2025.
- Technological Innovation: Focus on bio-based HMDA production and improved efficiency in existing processes.
- Regulatory Framework: Stringent environmental regulations impacting production methods and waste management.
- Competitive Substitutes: Limited direct substitutes, but competition exists from alternative materials in niche applications.
- M&A Trends: Moderate M&A activity, with a growing emphasis on strategic collaborations and joint ventures.
Hexamethylenediamine Industry Growth Trends & Insights
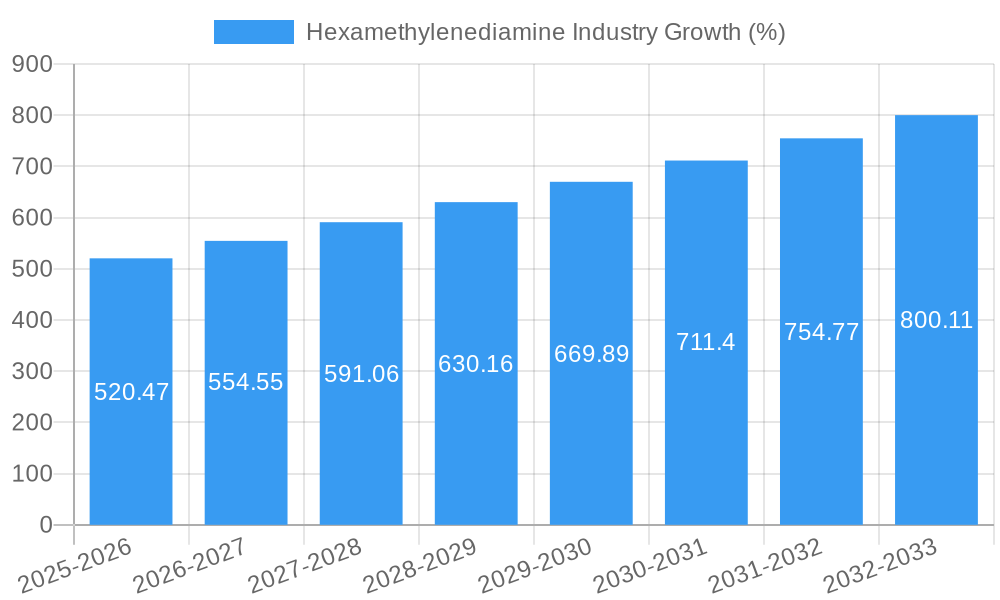
The global hexamethylenediamine market is projected to experience steady growth over the forecast period (2025-2033). Driven by increasing demand from key end-use sectors like textiles, plastics, and automotive, the market size is estimated to reach xx Million units by 2033, exhibiting a CAGR of xx% from 2025. The adoption rate of HMDA in various applications is influenced by factors such as price fluctuations of raw materials, technological advancements, and economic growth in emerging markets. Consumer behavior shifts towards sustainable products are also driving demand for bio-based HMDA. Technological disruptions, such as the increasing use of renewable feedstocks in HMDA production, are reshaping the industry landscape, while market penetration in developing economies presents significant opportunities.
Dominant Regions, Countries, or Segments in Hexamethylenediamine Industry
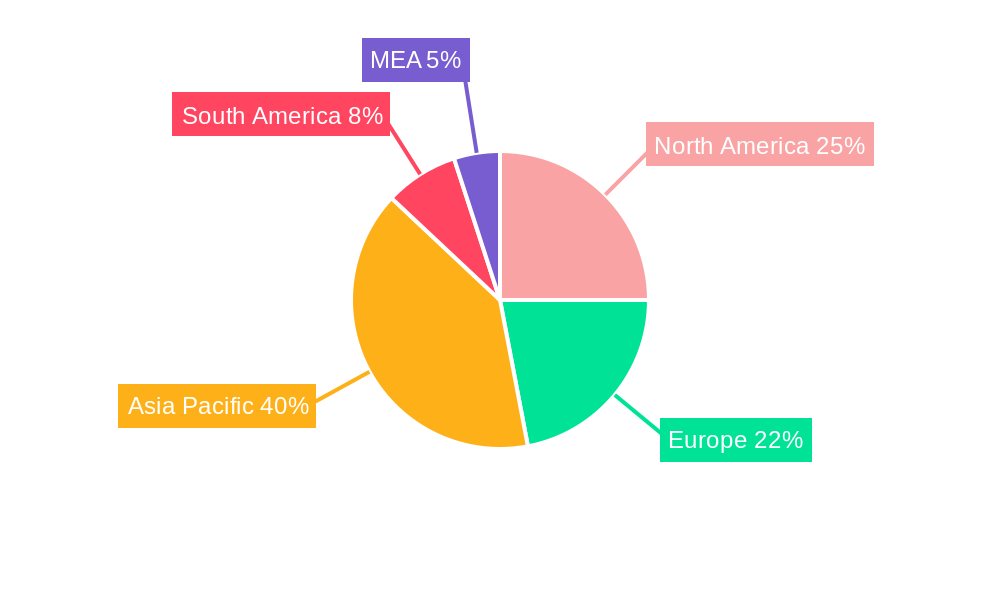
The Asia-Pacific region is expected to dominate the HMDA market throughout the forecast period, driven by robust growth in the textile and automotive industries within countries like China and India. Within application segments, Nylon production remains the dominant end-use, accounting for approximately xx% of global consumption in 2025, followed by the intermediate for coatings segment.
- Key Regional Drivers: Strong economic growth, expanding industrialization, and increasing investments in infrastructure.
- Leading Countries: China, India, United States, Germany.
- Dominant Application Segment: Nylon Production, followed by Intermediate for Coatings.
- Dominant End-User Industry: Textile and Automotive industries.
Hexamethylenediamine Industry Product Landscape
Hexamethylenediamine is primarily offered as a high-purity chemical, with variations tailored for specific applications. Recent innovations focus on bio-based production methods, aiming to reduce environmental impact and enhance sustainability. Key performance metrics include purity levels, reaction efficiency, and handling safety. The unique selling propositions often revolve around superior quality, consistent performance, and environmentally friendly production processes.
Key Drivers, Barriers & Challenges in Hexamethylenediamine Industry
Key Drivers: Increasing demand from the nylon and polyurethane industries; growth in the automotive and textile sectors; advancements in bio-based production methods.
Key Challenges: Fluctuations in raw material prices; stringent environmental regulations; competition from substitute materials; supply chain disruptions. The impact of these challenges is estimated to reduce the market growth by approximately xx% during the forecast period.
Emerging Opportunities in Hexamethylenediamine Industry
Emerging opportunities include expanding into new applications, such as in specialized coatings and adhesives. The rising demand for sustainable materials is driving the exploration of renewable feedstocks for HMDA production. Untapped markets in developing economies offer substantial growth potential.
Growth Accelerators in the Hexamethylenediamine Industry Industry
Long-term growth will be fueled by technological advancements in sustainable production, strategic partnerships between chemical producers and bio-based technology providers, and expansion into high-growth markets. The development of novel applications for HMDA will further drive market expansion.
Key Players Shaping the Hexamethylenediamine Industry Market
- Asahi Kasei Corporation
- Solvay
- Ascend Performance Materials
- Evonik Industries AG
- INVISTA
- DOW
- BASF SE
- Alfa Aesar
- Genomatica Inc
- TORAY INDUSTRIES INC
- Radici Partecipazioni SpA
- Shenma Industrial Co Ltd
Notable Milestones in Hexamethylenediamine Industry Sector
- March 2022: Asahi Kasei Corporation partnered with Genomatica Inc. to commercialize renewable nylon 6,6 using bio-based HMDA.
- January 2022: BASF SE announced plans to build a new HMDA plant in Chalampé, France, increasing its production capacity.
In-Depth Hexamethylenediamine Industry Market Outlook
The future of the HMDA market is promising, driven by continuous innovation, sustainability initiatives, and expansion into new applications. Strategic partnerships and investments in bio-based production will play a crucial role in shaping the industry's future. The market is poised for significant growth, particularly in emerging economies, offering attractive opportunities for established players and new entrants alike.
Hexamethylenediamine Industry Segmentation
-
1. Application
- 1.1. Nylon Production
- 1.2. Intermediate for Coatings
- 1.3. Biocides
- 1.4. Other Ap
-
2. End-user Industry
- 2.1. Textile
- 2.2. Plastics
- 2.3. Automotive
- 2.4. Other En
Hexamethylenediamine Industry Segmentation By Geography
-
1. Asia Pacific
- 1.1. China
- 1.2. India
- 1.3. Japan
- 1.4. South Korea
- 1.5. Rest of Asia Pacific
-
2. North America
- 2.1. United States
- 2.2. Canada
- 2.3. Mexico
-
3. Europe
- 3.1. Germany
- 3.2. United Kingdom
- 3.3. Italy
- 3.4. France
- 3.5. Rest of Europe
-
4. South America
- 4.1. Brazil
- 4.2. Argentina
- 4.3. Rest of South America
-
5. Middle East and Africa
- 5.1. Saudi Arabia
- 5.2. South Africa
- 5.3. Rest of Middle East and Africa
Hexamethylenediamine Industry REPORT HIGHLIGHTS
| Aspects | Details |
|---|---|
| Study Period | 2019-2033 |
| Base Year | 2024 |
| Estimated Year | 2025 |
| Forecast Period | 2025-2033 |
| Historical Period | 2019-2024 |
| Growth Rate | CAGR of 5.9% from 2019-2033 |
| Segmentation |
|
Table of Contents
- 1. Introduction
- 1.1. Research Scope
- 1.2. Market Segmentation
- 1.3. Research Methodology
- 1.4. Definitions and Assumptions
- 2. Executive Summary
- 2.1. Introduction
- 3. Market Dynamics
- 3.1. Introduction
- 3.2. Market Drivers
- 3.2.1. Increasing Consumption of Nylon 66 Resins; The Rising Demand for Hexamethylenediamine in Automotive and Textile Industries; Other Drivers
- 3.3. Market Restrains
- 3.3.1. Increased Usage of of Bio-based Raw Materials for Nylon Production; Other Restraints
- 3.4. Market Trends
- 3.4.1. Textile End-User Industry to Dominate the Market
- 4. Market Factor Analysis
- 4.1. Porters Five Forces
- 4.2. Supply/Value Chain
- 4.3. PESTEL analysis
- 4.4. Market Entropy
- 4.5. Patent/Trademark Analysis
- 5. Global Hexamethylenediamine Industry Analysis, Insights and Forecast, 2019-2031
- 5.1. Market Analysis, Insights and Forecast - by Application
- 5.1.1. Nylon Production
- 5.1.2. Intermediate for Coatings
- 5.1.3. Biocides
- 5.1.4. Other Ap
- 5.2. Market Analysis, Insights and Forecast - by End-user Industry
- 5.2.1. Textile
- 5.2.2. Plastics
- 5.2.3. Automotive
- 5.2.4. Other En
- 5.3. Market Analysis, Insights and Forecast - by Region
- 5.3.1. Asia Pacific
- 5.3.2. North America
- 5.3.3. Europe
- 5.3.4. South America
- 5.3.5. Middle East and Africa
- 5.1. Market Analysis, Insights and Forecast - by Application
- 6. Asia Pacific Hexamethylenediamine Industry Analysis, Insights and Forecast, 2019-2031
- 6.1. Market Analysis, Insights and Forecast - by Application
- 6.1.1. Nylon Production
- 6.1.2. Intermediate for Coatings
- 6.1.3. Biocides
- 6.1.4. Other Ap
- 6.2. Market Analysis, Insights and Forecast - by End-user Industry
- 6.2.1. Textile
- 6.2.2. Plastics
- 6.2.3. Automotive
- 6.2.4. Other En
- 6.1. Market Analysis, Insights and Forecast - by Application
- 7. North America Hexamethylenediamine Industry Analysis, Insights and Forecast, 2019-2031
- 7.1. Market Analysis, Insights and Forecast - by Application
- 7.1.1. Nylon Production
- 7.1.2. Intermediate for Coatings
- 7.1.3. Biocides
- 7.1.4. Other Ap
- 7.2. Market Analysis, Insights and Forecast - by End-user Industry
- 7.2.1. Textile
- 7.2.2. Plastics
- 7.2.3. Automotive
- 7.2.4. Other En
- 7.1. Market Analysis, Insights and Forecast - by Application
- 8. Europe Hexamethylenediamine Industry Analysis, Insights and Forecast, 2019-2031
- 8.1. Market Analysis, Insights and Forecast - by Application
- 8.1.1. Nylon Production
- 8.1.2. Intermediate for Coatings
- 8.1.3. Biocides
- 8.1.4. Other Ap
- 8.2. Market Analysis, Insights and Forecast - by End-user Industry
- 8.2.1. Textile
- 8.2.2. Plastics
- 8.2.3. Automotive
- 8.2.4. Other En
- 8.1. Market Analysis, Insights and Forecast - by Application
- 9. South America Hexamethylenediamine Industry Analysis, Insights and Forecast, 2019-2031
- 9.1. Market Analysis, Insights and Forecast - by Application
- 9.1.1. Nylon Production
- 9.1.2. Intermediate for Coatings
- 9.1.3. Biocides
- 9.1.4. Other Ap
- 9.2. Market Analysis, Insights and Forecast - by End-user Industry
- 9.2.1. Textile
- 9.2.2. Plastics
- 9.2.3. Automotive
- 9.2.4. Other En
- 9.1. Market Analysis, Insights and Forecast - by Application
- 10. Middle East and Africa Hexamethylenediamine Industry Analysis, Insights and Forecast, 2019-2031
- 10.1. Market Analysis, Insights and Forecast - by Application
- 10.1.1. Nylon Production
- 10.1.2. Intermediate for Coatings
- 10.1.3. Biocides
- 10.1.4. Other Ap
- 10.2. Market Analysis, Insights and Forecast - by End-user Industry
- 10.2.1. Textile
- 10.2.2. Plastics
- 10.2.3. Automotive
- 10.2.4. Other En
- 10.1. Market Analysis, Insights and Forecast - by Application
- 11. North America Hexamethylenediamine Industry Analysis, Insights and Forecast, 2019-2031
- 11.1. Market Analysis, Insights and Forecast - By Country/Sub-region
- 11.1.1 United States
- 11.1.2 Canada
- 11.1.3 Mexico
- 12. Europe Hexamethylenediamine Industry Analysis, Insights and Forecast, 2019-2031
- 12.1. Market Analysis, Insights and Forecast - By Country/Sub-region
- 12.1.1 Germany
- 12.1.2 France
- 12.1.3 Italy
- 12.1.4 United Kingdom
- 12.1.5 Netherlands
- 12.1.6 Rest of Europe
- 13. Asia Pacific Hexamethylenediamine Industry Analysis, Insights and Forecast, 2019-2031
- 13.1. Market Analysis, Insights and Forecast - By Country/Sub-region
- 13.1.1 China
- 13.1.2 Japan
- 13.1.3 India
- 13.1.4 South Korea
- 13.1.5 Taiwan
- 13.1.6 Australia
- 13.1.7 Rest of Asia-Pacific
- 14. South America Hexamethylenediamine Industry Analysis, Insights and Forecast, 2019-2031
- 14.1. Market Analysis, Insights and Forecast - By Country/Sub-region
- 14.1.1 Brazil
- 14.1.2 Argentina
- 14.1.3 Rest of South America
- 15. MEA Hexamethylenediamine Industry Analysis, Insights and Forecast, 2019-2031
- 15.1. Market Analysis, Insights and Forecast - By Country/Sub-region
- 15.1.1 Middle East
- 15.1.2 Africa
- 16. Competitive Analysis
- 16.1. Global Market Share Analysis 2024
- 16.2. Company Profiles
- 16.2.1 Asahi Kasei Corporation
- 16.2.1.1. Overview
- 16.2.1.2. Products
- 16.2.1.3. SWOT Analysis
- 16.2.1.4. Recent Developments
- 16.2.1.5. Financials (Based on Availability)
- 16.2.2 Solvay
- 16.2.2.1. Overview
- 16.2.2.2. Products
- 16.2.2.3. SWOT Analysis
- 16.2.2.4. Recent Developments
- 16.2.2.5. Financials (Based on Availability)
- 16.2.3 Ascend Performance Materials
- 16.2.3.1. Overview
- 16.2.3.2. Products
- 16.2.3.3. SWOT Analysis
- 16.2.3.4. Recent Developments
- 16.2.3.5. Financials (Based on Availability)
- 16.2.4 Evonik Industries AG
- 16.2.4.1. Overview
- 16.2.4.2. Products
- 16.2.4.3. SWOT Analysis
- 16.2.4.4. Recent Developments
- 16.2.4.5. Financials (Based on Availability)
- 16.2.5 INVISTA
- 16.2.5.1. Overview
- 16.2.5.2. Products
- 16.2.5.3. SWOT Analysis
- 16.2.5.4. Recent Developments
- 16.2.5.5. Financials (Based on Availability)
- 16.2.6 DOW
- 16.2.6.1. Overview
- 16.2.6.2. Products
- 16.2.6.3. SWOT Analysis
- 16.2.6.4. Recent Developments
- 16.2.6.5. Financials (Based on Availability)
- 16.2.7 BASF SE
- 16.2.7.1. Overview
- 16.2.7.2. Products
- 16.2.7.3. SWOT Analysis
- 16.2.7.4. Recent Developments
- 16.2.7.5. Financials (Based on Availability)
- 16.2.8 Alfa Aesar
- 16.2.8.1. Overview
- 16.2.8.2. Products
- 16.2.8.3. SWOT Analysis
- 16.2.8.4. Recent Developments
- 16.2.8.5. Financials (Based on Availability)
- 16.2.9 Genomatica Inc
- 16.2.9.1. Overview
- 16.2.9.2. Products
- 16.2.9.3. SWOT Analysis
- 16.2.9.4. Recent Developments
- 16.2.9.5. Financials (Based on Availability)
- 16.2.10 TORAY INDUSTRIES INC
- 16.2.10.1. Overview
- 16.2.10.2. Products
- 16.2.10.3. SWOT Analysis
- 16.2.10.4. Recent Developments
- 16.2.10.5. Financials (Based on Availability)
- 16.2.11 Radici Partecipazioni SpA
- 16.2.11.1. Overview
- 16.2.11.2. Products
- 16.2.11.3. SWOT Analysis
- 16.2.11.4. Recent Developments
- 16.2.11.5. Financials (Based on Availability)
- 16.2.12 Shenma Industrial Co Ltd
- 16.2.12.1. Overview
- 16.2.12.2. Products
- 16.2.12.3. SWOT Analysis
- 16.2.12.4. Recent Developments
- 16.2.12.5. Financials (Based on Availability)
- 16.2.1 Asahi Kasei Corporation
List of Figures
- Figure 1: Global Hexamethylenediamine Industry Revenue Breakdown (Million, %) by Region 2024 & 2032
- Figure 2: Global Hexamethylenediamine Industry Volume Breakdown (K Tons, %) by Region 2024 & 2032
- Figure 3: North America Hexamethylenediamine Industry Revenue (Million), by Country 2024 & 2032
- Figure 4: North America Hexamethylenediamine Industry Volume (K Tons), by Country 2024 & 2032
- Figure 5: North America Hexamethylenediamine Industry Revenue Share (%), by Country 2024 & 2032
- Figure 6: North America Hexamethylenediamine Industry Volume Share (%), by Country 2024 & 2032
- Figure 7: Europe Hexamethylenediamine Industry Revenue (Million), by Country 2024 & 2032
- Figure 8: Europe Hexamethylenediamine Industry Volume (K Tons), by Country 2024 & 2032
- Figure 9: Europe Hexamethylenediamine Industry Revenue Share (%), by Country 2024 & 2032
- Figure 10: Europe Hexamethylenediamine Industry Volume Share (%), by Country 2024 & 2032
- Figure 11: Asia Pacific Hexamethylenediamine Industry Revenue (Million), by Country 2024 & 2032
- Figure 12: Asia Pacific Hexamethylenediamine Industry Volume (K Tons), by Country 2024 & 2032
- Figure 13: Asia Pacific Hexamethylenediamine Industry Revenue Share (%), by Country 2024 & 2032
- Figure 14: Asia Pacific Hexamethylenediamine Industry Volume Share (%), by Country 2024 & 2032
- Figure 15: South America Hexamethylenediamine Industry Revenue (Million), by Country 2024 & 2032
- Figure 16: South America Hexamethylenediamine Industry Volume (K Tons), by Country 2024 & 2032
- Figure 17: South America Hexamethylenediamine Industry Revenue Share (%), by Country 2024 & 2032
- Figure 18: South America Hexamethylenediamine Industry Volume Share (%), by Country 2024 & 2032
- Figure 19: MEA Hexamethylenediamine Industry Revenue (Million), by Country 2024 & 2032
- Figure 20: MEA Hexamethylenediamine Industry Volume (K Tons), by Country 2024 & 2032
- Figure 21: MEA Hexamethylenediamine Industry Revenue Share (%), by Country 2024 & 2032
- Figure 22: MEA Hexamethylenediamine Industry Volume Share (%), by Country 2024 & 2032
- Figure 23: Asia Pacific Hexamethylenediamine Industry Revenue (Million), by Application 2024 & 2032
- Figure 24: Asia Pacific Hexamethylenediamine Industry Volume (K Tons), by Application 2024 & 2032
- Figure 25: Asia Pacific Hexamethylenediamine Industry Revenue Share (%), by Application 2024 & 2032
- Figure 26: Asia Pacific Hexamethylenediamine Industry Volume Share (%), by Application 2024 & 2032
- Figure 27: Asia Pacific Hexamethylenediamine Industry Revenue (Million), by End-user Industry 2024 & 2032
- Figure 28: Asia Pacific Hexamethylenediamine Industry Volume (K Tons), by End-user Industry 2024 & 2032
- Figure 29: Asia Pacific Hexamethylenediamine Industry Revenue Share (%), by End-user Industry 2024 & 2032
- Figure 30: Asia Pacific Hexamethylenediamine Industry Volume Share (%), by End-user Industry 2024 & 2032
- Figure 31: Asia Pacific Hexamethylenediamine Industry Revenue (Million), by Country 2024 & 2032
- Figure 32: Asia Pacific Hexamethylenediamine Industry Volume (K Tons), by Country 2024 & 2032
- Figure 33: Asia Pacific Hexamethylenediamine Industry Revenue Share (%), by Country 2024 & 2032
- Figure 34: Asia Pacific Hexamethylenediamine Industry Volume Share (%), by Country 2024 & 2032
- Figure 35: North America Hexamethylenediamine Industry Revenue (Million), by Application 2024 & 2032
- Figure 36: North America Hexamethylenediamine Industry Volume (K Tons), by Application 2024 & 2032
- Figure 37: North America Hexamethylenediamine Industry Revenue Share (%), by Application 2024 & 2032
- Figure 38: North America Hexamethylenediamine Industry Volume Share (%), by Application 2024 & 2032
- Figure 39: North America Hexamethylenediamine Industry Revenue (Million), by End-user Industry 2024 & 2032
- Figure 40: North America Hexamethylenediamine Industry Volume (K Tons), by End-user Industry 2024 & 2032
- Figure 41: North America Hexamethylenediamine Industry Revenue Share (%), by End-user Industry 2024 & 2032
- Figure 42: North America Hexamethylenediamine Industry Volume Share (%), by End-user Industry 2024 & 2032
- Figure 43: North America Hexamethylenediamine Industry Revenue (Million), by Country 2024 & 2032
- Figure 44: North America Hexamethylenediamine Industry Volume (K Tons), by Country 2024 & 2032
- Figure 45: North America Hexamethylenediamine Industry Revenue Share (%), by Country 2024 & 2032
- Figure 46: North America Hexamethylenediamine Industry Volume Share (%), by Country 2024 & 2032
- Figure 47: Europe Hexamethylenediamine Industry Revenue (Million), by Application 2024 & 2032
- Figure 48: Europe Hexamethylenediamine Industry Volume (K Tons), by Application 2024 & 2032
- Figure 49: Europe Hexamethylenediamine Industry Revenue Share (%), by Application 2024 & 2032
- Figure 50: Europe Hexamethylenediamine Industry Volume Share (%), by Application 2024 & 2032
- Figure 51: Europe Hexamethylenediamine Industry Revenue (Million), by End-user Industry 2024 & 2032
- Figure 52: Europe Hexamethylenediamine Industry Volume (K Tons), by End-user Industry 2024 & 2032
- Figure 53: Europe Hexamethylenediamine Industry Revenue Share (%), by End-user Industry 2024 & 2032
- Figure 54: Europe Hexamethylenediamine Industry Volume Share (%), by End-user Industry 2024 & 2032
- Figure 55: Europe Hexamethylenediamine Industry Revenue (Million), by Country 2024 & 2032
- Figure 56: Europe Hexamethylenediamine Industry Volume (K Tons), by Country 2024 & 2032
- Figure 57: Europe Hexamethylenediamine Industry Revenue Share (%), by Country 2024 & 2032
- Figure 58: Europe Hexamethylenediamine Industry Volume Share (%), by Country 2024 & 2032
- Figure 59: South America Hexamethylenediamine Industry Revenue (Million), by Application 2024 & 2032
- Figure 60: South America Hexamethylenediamine Industry Volume (K Tons), by Application 2024 & 2032
- Figure 61: South America Hexamethylenediamine Industry Revenue Share (%), by Application 2024 & 2032
- Figure 62: South America Hexamethylenediamine Industry Volume Share (%), by Application 2024 & 2032
- Figure 63: South America Hexamethylenediamine Industry Revenue (Million), by End-user Industry 2024 & 2032
- Figure 64: South America Hexamethylenediamine Industry Volume (K Tons), by End-user Industry 2024 & 2032
- Figure 65: South America Hexamethylenediamine Industry Revenue Share (%), by End-user Industry 2024 & 2032
- Figure 66: South America Hexamethylenediamine Industry Volume Share (%), by End-user Industry 2024 & 2032
- Figure 67: South America Hexamethylenediamine Industry Revenue (Million), by Country 2024 & 2032
- Figure 68: South America Hexamethylenediamine Industry Volume (K Tons), by Country 2024 & 2032
- Figure 69: South America Hexamethylenediamine Industry Revenue Share (%), by Country 2024 & 2032
- Figure 70: South America Hexamethylenediamine Industry Volume Share (%), by Country 2024 & 2032
- Figure 71: Middle East and Africa Hexamethylenediamine Industry Revenue (Million), by Application 2024 & 2032
- Figure 72: Middle East and Africa Hexamethylenediamine Industry Volume (K Tons), by Application 2024 & 2032
- Figure 73: Middle East and Africa Hexamethylenediamine Industry Revenue Share (%), by Application 2024 & 2032
- Figure 74: Middle East and Africa Hexamethylenediamine Industry Volume Share (%), by Application 2024 & 2032
- Figure 75: Middle East and Africa Hexamethylenediamine Industry Revenue (Million), by End-user Industry 2024 & 2032
- Figure 76: Middle East and Africa Hexamethylenediamine Industry Volume (K Tons), by End-user Industry 2024 & 2032
- Figure 77: Middle East and Africa Hexamethylenediamine Industry Revenue Share (%), by End-user Industry 2024 & 2032
- Figure 78: Middle East and Africa Hexamethylenediamine Industry Volume Share (%), by End-user Industry 2024 & 2032
- Figure 79: Middle East and Africa Hexamethylenediamine Industry Revenue (Million), by Country 2024 & 2032
- Figure 80: Middle East and Africa Hexamethylenediamine Industry Volume (K Tons), by Country 2024 & 2032
- Figure 81: Middle East and Africa Hexamethylenediamine Industry Revenue Share (%), by Country 2024 & 2032
- Figure 82: Middle East and Africa Hexamethylenediamine Industry Volume Share (%), by Country 2024 & 2032
List of Tables
- Table 1: Global Hexamethylenediamine Industry Revenue Million Forecast, by Region 2019 & 2032
- Table 2: Global Hexamethylenediamine Industry Volume K Tons Forecast, by Region 2019 & 2032
- Table 3: Global Hexamethylenediamine Industry Revenue Million Forecast, by Application 2019 & 2032
- Table 4: Global Hexamethylenediamine Industry Volume K Tons Forecast, by Application 2019 & 2032
- Table 5: Global Hexamethylenediamine Industry Revenue Million Forecast, by End-user Industry 2019 & 2032
- Table 6: Global Hexamethylenediamine Industry Volume K Tons Forecast, by End-user Industry 2019 & 2032
- Table 7: Global Hexamethylenediamine Industry Revenue Million Forecast, by Region 2019 & 2032
- Table 8: Global Hexamethylenediamine Industry Volume K Tons Forecast, by Region 2019 & 2032
- Table 9: Global Hexamethylenediamine Industry Revenue Million Forecast, by Country 2019 & 2032
- Table 10: Global Hexamethylenediamine Industry Volume K Tons Forecast, by Country 2019 & 2032
- Table 11: United States Hexamethylenediamine Industry Revenue (Million) Forecast, by Application 2019 & 2032
- Table 12: United States Hexamethylenediamine Industry Volume (K Tons) Forecast, by Application 2019 & 2032
- Table 13: Canada Hexamethylenediamine Industry Revenue (Million) Forecast, by Application 2019 & 2032
- Table 14: Canada Hexamethylenediamine Industry Volume (K Tons) Forecast, by Application 2019 & 2032
- Table 15: Mexico Hexamethylenediamine Industry Revenue (Million) Forecast, by Application 2019 & 2032
- Table 16: Mexico Hexamethylenediamine Industry Volume (K Tons) Forecast, by Application 2019 & 2032
- Table 17: Global Hexamethylenediamine Industry Revenue Million Forecast, by Country 2019 & 2032
- Table 18: Global Hexamethylenediamine Industry Volume K Tons Forecast, by Country 2019 & 2032
- Table 19: Germany Hexamethylenediamine Industry Revenue (Million) Forecast, by Application 2019 & 2032
- Table 20: Germany Hexamethylenediamine Industry Volume (K Tons) Forecast, by Application 2019 & 2032
- Table 21: France Hexamethylenediamine Industry Revenue (Million) Forecast, by Application 2019 & 2032
- Table 22: France Hexamethylenediamine Industry Volume (K Tons) Forecast, by Application 2019 & 2032
- Table 23: Italy Hexamethylenediamine Industry Revenue (Million) Forecast, by Application 2019 & 2032
- Table 24: Italy Hexamethylenediamine Industry Volume (K Tons) Forecast, by Application 2019 & 2032
- Table 25: United Kingdom Hexamethylenediamine Industry Revenue (Million) Forecast, by Application 2019 & 2032
- Table 26: United Kingdom Hexamethylenediamine Industry Volume (K Tons) Forecast, by Application 2019 & 2032
- Table 27: Netherlands Hexamethylenediamine Industry Revenue (Million) Forecast, by Application 2019 & 2032
- Table 28: Netherlands Hexamethylenediamine Industry Volume (K Tons) Forecast, by Application 2019 & 2032
- Table 29: Rest of Europe Hexamethylenediamine Industry Revenue (Million) Forecast, by Application 2019 & 2032
- Table 30: Rest of Europe Hexamethylenediamine Industry Volume (K Tons) Forecast, by Application 2019 & 2032
- Table 31: Global Hexamethylenediamine Industry Revenue Million Forecast, by Country 2019 & 2032
- Table 32: Global Hexamethylenediamine Industry Volume K Tons Forecast, by Country 2019 & 2032
- Table 33: China Hexamethylenediamine Industry Revenue (Million) Forecast, by Application 2019 & 2032
- Table 34: China Hexamethylenediamine Industry Volume (K Tons) Forecast, by Application 2019 & 2032
- Table 35: Japan Hexamethylenediamine Industry Revenue (Million) Forecast, by Application 2019 & 2032
- Table 36: Japan Hexamethylenediamine Industry Volume (K Tons) Forecast, by Application 2019 & 2032
- Table 37: India Hexamethylenediamine Industry Revenue (Million) Forecast, by Application 2019 & 2032
- Table 38: India Hexamethylenediamine Industry Volume (K Tons) Forecast, by Application 2019 & 2032
- Table 39: South Korea Hexamethylenediamine Industry Revenue (Million) Forecast, by Application 2019 & 2032
- Table 40: South Korea Hexamethylenediamine Industry Volume (K Tons) Forecast, by Application 2019 & 2032
- Table 41: Taiwan Hexamethylenediamine Industry Revenue (Million) Forecast, by Application 2019 & 2032
- Table 42: Taiwan Hexamethylenediamine Industry Volume (K Tons) Forecast, by Application 2019 & 2032
- Table 43: Australia Hexamethylenediamine Industry Revenue (Million) Forecast, by Application 2019 & 2032
- Table 44: Australia Hexamethylenediamine Industry Volume (K Tons) Forecast, by Application 2019 & 2032
- Table 45: Rest of Asia-Pacific Hexamethylenediamine Industry Revenue (Million) Forecast, by Application 2019 & 2032
- Table 46: Rest of Asia-Pacific Hexamethylenediamine Industry Volume (K Tons) Forecast, by Application 2019 & 2032
- Table 47: Global Hexamethylenediamine Industry Revenue Million Forecast, by Country 2019 & 2032
- Table 48: Global Hexamethylenediamine Industry Volume K Tons Forecast, by Country 2019 & 2032
- Table 49: Brazil Hexamethylenediamine Industry Revenue (Million) Forecast, by Application 2019 & 2032
- Table 50: Brazil Hexamethylenediamine Industry Volume (K Tons) Forecast, by Application 2019 & 2032
- Table 51: Argentina Hexamethylenediamine Industry Revenue (Million) Forecast, by Application 2019 & 2032
- Table 52: Argentina Hexamethylenediamine Industry Volume (K Tons) Forecast, by Application 2019 & 2032
- Table 53: Rest of South America Hexamethylenediamine Industry Revenue (Million) Forecast, by Application 2019 & 2032
- Table 54: Rest of South America Hexamethylenediamine Industry Volume (K Tons) Forecast, by Application 2019 & 2032
- Table 55: Global Hexamethylenediamine Industry Revenue Million Forecast, by Country 2019 & 2032
- Table 56: Global Hexamethylenediamine Industry Volume K Tons Forecast, by Country 2019 & 2032
- Table 57: Middle East Hexamethylenediamine Industry Revenue (Million) Forecast, by Application 2019 & 2032
- Table 58: Middle East Hexamethylenediamine Industry Volume (K Tons) Forecast, by Application 2019 & 2032
- Table 59: Africa Hexamethylenediamine Industry Revenue (Million) Forecast, by Application 2019 & 2032
- Table 60: Africa Hexamethylenediamine Industry Volume (K Tons) Forecast, by Application 2019 & 2032
- Table 61: Global Hexamethylenediamine Industry Revenue Million Forecast, by Application 2019 & 2032
- Table 62: Global Hexamethylenediamine Industry Volume K Tons Forecast, by Application 2019 & 2032
- Table 63: Global Hexamethylenediamine Industry Revenue Million Forecast, by End-user Industry 2019 & 2032
- Table 64: Global Hexamethylenediamine Industry Volume K Tons Forecast, by End-user Industry 2019 & 2032
- Table 65: Global Hexamethylenediamine Industry Revenue Million Forecast, by Country 2019 & 2032
- Table 66: Global Hexamethylenediamine Industry Volume K Tons Forecast, by Country 2019 & 2032
- Table 67: China Hexamethylenediamine Industry Revenue (Million) Forecast, by Application 2019 & 2032
- Table 68: China Hexamethylenediamine Industry Volume (K Tons) Forecast, by Application 2019 & 2032
- Table 69: India Hexamethylenediamine Industry Revenue (Million) Forecast, by Application 2019 & 2032
- Table 70: India Hexamethylenediamine Industry Volume (K Tons) Forecast, by Application 2019 & 2032
- Table 71: Japan Hexamethylenediamine Industry Revenue (Million) Forecast, by Application 2019 & 2032
- Table 72: Japan Hexamethylenediamine Industry Volume (K Tons) Forecast, by Application 2019 & 2032
- Table 73: South Korea Hexamethylenediamine Industry Revenue (Million) Forecast, by Application 2019 & 2032
- Table 74: South Korea Hexamethylenediamine Industry Volume (K Tons) Forecast, by Application 2019 & 2032
- Table 75: Rest of Asia Pacific Hexamethylenediamine Industry Revenue (Million) Forecast, by Application 2019 & 2032
- Table 76: Rest of Asia Pacific Hexamethylenediamine Industry Volume (K Tons) Forecast, by Application 2019 & 2032
- Table 77: Global Hexamethylenediamine Industry Revenue Million Forecast, by Application 2019 & 2032
- Table 78: Global Hexamethylenediamine Industry Volume K Tons Forecast, by Application 2019 & 2032
- Table 79: Global Hexamethylenediamine Industry Revenue Million Forecast, by End-user Industry 2019 & 2032
- Table 80: Global Hexamethylenediamine Industry Volume K Tons Forecast, by End-user Industry 2019 & 2032
- Table 81: Global Hexamethylenediamine Industry Revenue Million Forecast, by Country 2019 & 2032
- Table 82: Global Hexamethylenediamine Industry Volume K Tons Forecast, by Country 2019 & 2032
- Table 83: United States Hexamethylenediamine Industry Revenue (Million) Forecast, by Application 2019 & 2032
- Table 84: United States Hexamethylenediamine Industry Volume (K Tons) Forecast, by Application 2019 & 2032
- Table 85: Canada Hexamethylenediamine Industry Revenue (Million) Forecast, by Application 2019 & 2032
- Table 86: Canada Hexamethylenediamine Industry Volume (K Tons) Forecast, by Application 2019 & 2032
- Table 87: Mexico Hexamethylenediamine Industry Revenue (Million) Forecast, by Application 2019 & 2032
- Table 88: Mexico Hexamethylenediamine Industry Volume (K Tons) Forecast, by Application 2019 & 2032
- Table 89: Global Hexamethylenediamine Industry Revenue Million Forecast, by Application 2019 & 2032
- Table 90: Global Hexamethylenediamine Industry Volume K Tons Forecast, by Application 2019 & 2032
- Table 91: Global Hexamethylenediamine Industry Revenue Million Forecast, by End-user Industry 2019 & 2032
- Table 92: Global Hexamethylenediamine Industry Volume K Tons Forecast, by End-user Industry 2019 & 2032
- Table 93: Global Hexamethylenediamine Industry Revenue Million Forecast, by Country 2019 & 2032
- Table 94: Global Hexamethylenediamine Industry Volume K Tons Forecast, by Country 2019 & 2032
- Table 95: Germany Hexamethylenediamine Industry Revenue (Million) Forecast, by Application 2019 & 2032
- Table 96: Germany Hexamethylenediamine Industry Volume (K Tons) Forecast, by Application 2019 & 2032
- Table 97: United Kingdom Hexamethylenediamine Industry Revenue (Million) Forecast, by Application 2019 & 2032
- Table 98: United Kingdom Hexamethylenediamine Industry Volume (K Tons) Forecast, by Application 2019 & 2032
- Table 99: Italy Hexamethylenediamine Industry Revenue (Million) Forecast, by Application 2019 & 2032
- Table 100: Italy Hexamethylenediamine Industry Volume (K Tons) Forecast, by Application 2019 & 2032
- Table 101: France Hexamethylenediamine Industry Revenue (Million) Forecast, by Application 2019 & 2032
- Table 102: France Hexamethylenediamine Industry Volume (K Tons) Forecast, by Application 2019 & 2032
- Table 103: Rest of Europe Hexamethylenediamine Industry Revenue (Million) Forecast, by Application 2019 & 2032
- Table 104: Rest of Europe Hexamethylenediamine Industry Volume (K Tons) Forecast, by Application 2019 & 2032
- Table 105: Global Hexamethylenediamine Industry Revenue Million Forecast, by Application 2019 & 2032
- Table 106: Global Hexamethylenediamine Industry Volume K Tons Forecast, by Application 2019 & 2032
- Table 107: Global Hexamethylenediamine Industry Revenue Million Forecast, by End-user Industry 2019 & 2032
- Table 108: Global Hexamethylenediamine Industry Volume K Tons Forecast, by End-user Industry 2019 & 2032
- Table 109: Global Hexamethylenediamine Industry Revenue Million Forecast, by Country 2019 & 2032
- Table 110: Global Hexamethylenediamine Industry Volume K Tons Forecast, by Country 2019 & 2032
- Table 111: Brazil Hexamethylenediamine Industry Revenue (Million) Forecast, by Application 2019 & 2032
- Table 112: Brazil Hexamethylenediamine Industry Volume (K Tons) Forecast, by Application 2019 & 2032
- Table 113: Argentina Hexamethylenediamine Industry Revenue (Million) Forecast, by Application 2019 & 2032
- Table 114: Argentina Hexamethylenediamine Industry Volume (K Tons) Forecast, by Application 2019 & 2032
- Table 115: Rest of South America Hexamethylenediamine Industry Revenue (Million) Forecast, by Application 2019 & 2032
- Table 116: Rest of South America Hexamethylenediamine Industry Volume (K Tons) Forecast, by Application 2019 & 2032
- Table 117: Global Hexamethylenediamine Industry Revenue Million Forecast, by Application 2019 & 2032
- Table 118: Global Hexamethylenediamine Industry Volume K Tons Forecast, by Application 2019 & 2032
- Table 119: Global Hexamethylenediamine Industry Revenue Million Forecast, by End-user Industry 2019 & 2032
- Table 120: Global Hexamethylenediamine Industry Volume K Tons Forecast, by End-user Industry 2019 & 2032
- Table 121: Global Hexamethylenediamine Industry Revenue Million Forecast, by Country 2019 & 2032
- Table 122: Global Hexamethylenediamine Industry Volume K Tons Forecast, by Country 2019 & 2032
- Table 123: Saudi Arabia Hexamethylenediamine Industry Revenue (Million) Forecast, by Application 2019 & 2032
- Table 124: Saudi Arabia Hexamethylenediamine Industry Volume (K Tons) Forecast, by Application 2019 & 2032
- Table 125: South Africa Hexamethylenediamine Industry Revenue (Million) Forecast, by Application 2019 & 2032
- Table 126: South Africa Hexamethylenediamine Industry Volume (K Tons) Forecast, by Application 2019 & 2032
- Table 127: Rest of Middle East and Africa Hexamethylenediamine Industry Revenue (Million) Forecast, by Application 2019 & 2032
- Table 128: Rest of Middle East and Africa Hexamethylenediamine Industry Volume (K Tons) Forecast, by Application 2019 & 2032
Frequently Asked Questions
1. What is the projected Compound Annual Growth Rate (CAGR) of the Hexamethylenediamine Industry?
The projected CAGR is approximately 5.9%.
2. Which companies are prominent players in the Hexamethylenediamine Industry?
Key companies in the market include Asahi Kasei Corporation, Solvay, Ascend Performance Materials, Evonik Industries AG, INVISTA, DOW, BASF SE, Alfa Aesar, Genomatica Inc, TORAY INDUSTRIES INC, Radici Partecipazioni SpA, Shenma Industrial Co Ltd.
3. What are the main segments of the Hexamethylenediamine Industry?
The market segments include Application, End-user Industry.
4. Can you provide details about the market size?
The market size is estimated to be USD 8,473.20 Million as of 2022.
5. What are some drivers contributing to market growth?
Increasing Consumption of Nylon 66 Resins; The Rising Demand for Hexamethylenediamine in Automotive and Textile Industries; Other Drivers.
6. What are the notable trends driving market growth?
Textile End-User Industry to Dominate the Market.
7. Are there any restraints impacting market growth?
Increased Usage of of Bio-based Raw Materials for Nylon Production; Other Restraints.
8. Can you provide examples of recent developments in the market?
March 2022: Asahi Kasei Corporation announced a strategic partnership with Genomatica Inc. to commercialize renewable nylon 6,6 made from Genomatica’s bio-based hexamethylenediamine building block. The partnership will help Asahi Kasei Corporation to further strengthen its market for hexamethylenediamine.
9. What pricing options are available for accessing the report?
Pricing options include single-user, multi-user, and enterprise licenses priced at USD 4750, USD 5250, and USD 8750 respectively.
10. Is the market size provided in terms of value or volume?
The market size is provided in terms of value, measured in Million and volume, measured in K Tons.
11. Are there any specific market keywords associated with the report?
Yes, the market keyword associated with the report is "Hexamethylenediamine Industry," which aids in identifying and referencing the specific market segment covered.
12. How do I determine which pricing option suits my needs best?
The pricing options vary based on user requirements and access needs. Individual users may opt for single-user licenses, while businesses requiring broader access may choose multi-user or enterprise licenses for cost-effective access to the report.
13. Are there any additional resources or data provided in the Hexamethylenediamine Industry report?
While the report offers comprehensive insights, it's advisable to review the specific contents or supplementary materials provided to ascertain if additional resources or data are available.
14. How can I stay updated on further developments or reports in the Hexamethylenediamine Industry?
To stay informed about further developments, trends, and reports in the Hexamethylenediamine Industry, consider subscribing to industry newsletters, following relevant companies and organizations, or regularly checking reputable industry news sources and publications.
Methodology
Step 1 - Identification of Relevant Samples Size from Population Database


Step 2 - Approaches for Defining Global Market Size (Value, Volume* & Price*)

Note*: In applicable scenarios
Step 3 - Data Sources
Primary Research
- Web Analytics
- Survey Reports
- Research Institute
- Latest Research Reports
- Opinion Leaders
Secondary Research
- Annual Reports
- White Paper
- Latest Press Release
- Industry Association
- Paid Database
- Investor Presentations

Step 4 - Data Triangulation
Involves using different sources of information in order to increase the validity of a study
These sources are likely to be stakeholders in a program - participants, other researchers, program staff, other community members, and so on.
Then we put all data in single framework & apply various statistical tools to find out the dynamic on the market.
During the analysis stage, feedback from the stakeholder groups would be compared to determine areas of agreement as well as areas of divergence


