
Key Insights
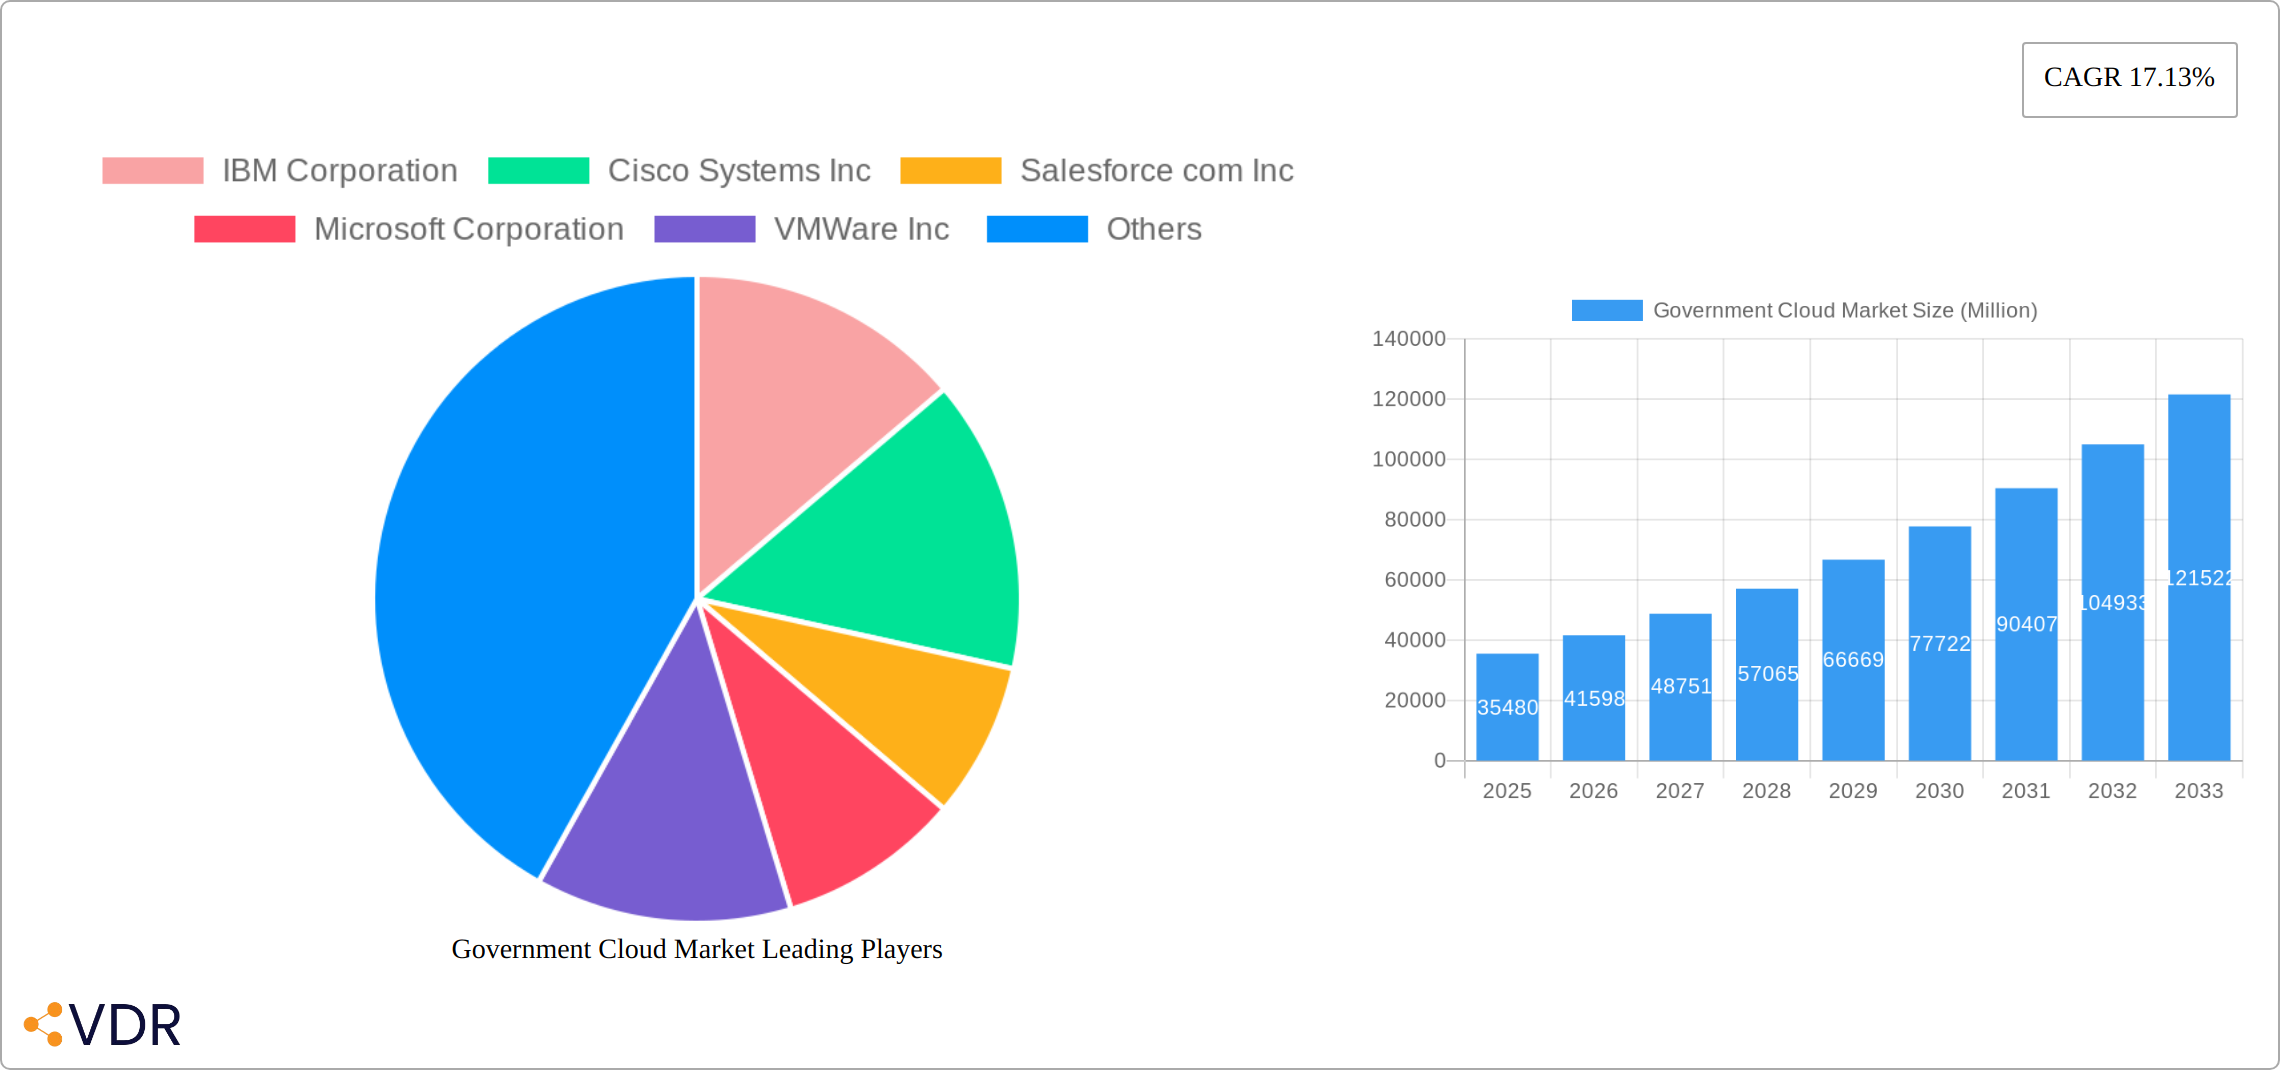
The Government Cloud market, valued at $35.48 billion in 2025, is projected to experience robust growth, driven by increasing government digitalization initiatives, stringent data security requirements, and the need for improved operational efficiency. A Compound Annual Growth Rate (CAGR) of 17.13% from 2025 to 2033 indicates a significant expansion of this market. Key drivers include the modernization of legacy IT infrastructure, the adoption of cloud-based applications for citizen services (e.g., online tax filing, digital ID systems), and the growing demand for enhanced data analytics capabilities to support evidence-based policymaking. The shift towards cloud-based solutions offers governments cost savings through reduced capital expenditures and improved scalability, while also fostering greater collaboration and data sharing across different government agencies. The market is segmented by deployment model (public, private, hybrid), delivery mode (IaaS, PaaS, SaaS), and application (server & storage, disaster recovery, security & compliance, analytics, content management). North America currently holds a significant market share, but the Asia-Pacific region is poised for substantial growth due to increasing government investments in digital infrastructure and rising adoption of cloud services across various government functions. However, challenges such as data security concerns, regulatory compliance complexities, and the need for skilled IT professionals could potentially restrain market growth to some extent.
The competitive landscape is shaped by a diverse mix of established technology vendors and specialized cloud service providers. Major players like IBM, Cisco, Salesforce, Microsoft, VMware, Amazon Web Services, and Google compete fiercely to secure government contracts, leveraging their expertise in cloud infrastructure, security, and application development. The market's future trajectory depends on several factors including the continued evolution of cloud technologies, government budgets, and the effectiveness of cybersecurity measures. The increasing adoption of artificial intelligence (AI) and machine learning (ML) within government operations is also likely to stimulate further growth in the Government Cloud market, creating new opportunities for specialized solution providers. Understanding these dynamics is crucial for both technology vendors and policymakers to navigate the evolving landscape of government cloud adoption.
Government Cloud Market: A Comprehensive Market Report (2019-2033)
This in-depth report provides a comprehensive analysis of the Government Cloud Market, encompassing market dynamics, growth trends, regional analysis, competitive landscape, and future outlook. The study period covers 2019-2033, with a base year of 2025 and a forecast period of 2025-2033. The report segments the market by deployment model (Public Cloud, Private Cloud, Hybrid Cloud), delivery mode (IaaS, PaaS, SaaS), and application (Server & Storage, Disaster Recovery/Data Backup, Security & Compliance, Analytics, Content Management). Key players analyzed include IBM Corporation, Cisco Systems Inc, Salesforce.com Inc, Microsoft Corporation, VMware Inc, Dell Inc, Amazon Web Services Inc, NetApp Inc, Oracle Corporation, CGI Inc, Google Inc, and Rackspace Inc. The market size is projected to reach xx Million by 2033.
Government Cloud Market Dynamics & Structure
The Government Cloud market is characterized by a moderately concentrated landscape, with a few major players holding significant market share. However, the market is dynamic, driven by technological innovations, evolving regulatory frameworks, and increasing adoption of cloud services by government agencies. Mergers and acquisitions (M&A) activity remains significant, with larger players seeking to expand their service offerings and geographic reach.
- Market Concentration: The top 5 players account for approximately xx% of the market share in 2025.
- Technological Innovation: Advancements in areas like AI, machine learning, and edge computing are driving demand for sophisticated cloud solutions.
- Regulatory Frameworks: Government regulations related to data security, privacy, and compliance are shaping the market landscape and influencing vendor strategies.
- Competitive Substitutes: On-premise solutions and legacy systems still compete with cloud offerings, but cloud adoption is steadily increasing.
- End-User Demographics: Government agencies at all levels (federal, state, local) are increasingly adopting cloud services to improve efficiency, scalability, and security.
- M&A Trends: The number of M&A deals in the government cloud market averaged xx per year during the historical period (2019-2024).
Government Cloud Market Growth Trends & Insights
The global Government Cloud market has witnessed substantial growth in recent years, driven by a confluence of factors. Government agencies worldwide are increasingly adopting cloud technologies to enhance data security, streamline operations, and optimize costs. This trend is further amplified by the escalating demand for advanced data analytics and the need for greater agility and scalability in IT infrastructure. The market is projected to maintain a robust Compound Annual Growth Rate (CAGR) of [Insert Updated CAGR]% during the forecast period (2025-2033), exceeding [Insert Updated Market Size in Millions] million by 2033, up from [Insert Updated Market Size in Millions] million in 2025. While mature markets exhibit high penetration, emerging economies are experiencing a period of rapid and significant adoption, presenting considerable untapped potential. This growth trajectory is being shaped by technological advancements such as serverless computing, edge computing, and the expanding adoption of AI/ML, alongside shifts in consumer behavior towards digital-first service delivery and the increasing prevalence of multi-cloud strategies.
Dominant Regions, Countries, or Segments in Government Cloud Market
North America currently holds the largest market share in the Government Cloud market, driven by high cloud adoption rates and robust government IT budgets. However, regions like Asia-Pacific are exhibiting rapid growth due to increasing government investments in digital infrastructure and rising demand for cloud-based services. Within the segment breakdown:
By Deployment Model: The Public Cloud segment is the dominant player, accounting for approximately xx% of the market in 2025, fueled by its scalability and cost-effectiveness. However, Hybrid Cloud deployments are gaining traction due to security and regulatory concerns.
By Delivery Mode: IaaS is the largest segment, followed by SaaS and PaaS.
By Application: Server and Storage, Security & Compliance, and Disaster Recovery/Data Backup are major application segments driving market growth.
Key Drivers (across segments):
- Increasing government budgets allocated to IT modernization initiatives.
- Stringent data security and compliance regulations.
- Growing need for enhanced operational efficiency and scalability.
- The rise of big data analytics and the need for advanced data processing capabilities.
Government Cloud Market Product Landscape
Government cloud products are evolving rapidly, with vendors offering a wide range of services tailored to specific government needs. This includes enhanced security features, compliance certifications, and integration with legacy systems. Innovation focuses on AI-powered solutions, advanced analytics platforms, and improved data management capabilities. Unique selling propositions often center around tailored compliance solutions, robust security architecture, and seamless integration with existing government systems.
Key Drivers, Barriers & Challenges in Government Cloud Market
Key Drivers:
- Accelerated government investment in digital transformation initiatives, fueled by the need for modernization and improved citizen services.
- Widespread adoption of cloud-native applications designed for scalability, resilience, and optimized performance within cloud environments.
- Stringent data security and compliance requirements driving the migration to secure cloud platforms with robust governance features.
- Enhanced data analytics and business intelligence capabilities enabled by cloud-based platforms, offering valuable insights for policy making and resource allocation.
- The need for improved interoperability and data sharing across different government agencies and departments.
Key Challenges:
- Persistent data security and privacy concerns, particularly regarding sensitive citizen data and national security information.
- Navigating complex and evolving regulatory frameworks and compliance standards, which vary significantly across jurisdictions.
- Addressing the integration complexities associated with migrating legacy systems to cloud platforms, requiring significant planning and investment.
- Budgetary constraints and limited IT resources in some government agencies, potentially hindering cloud adoption and posing a barrier to realizing the full benefits of cloud migration. The cost of modernizing legacy systems and migrating to cloud environments represents a significant financial hurdle, estimated to impact annual market growth by approximately [Insert Updated Impact in Millions] million.
- Lack of skilled personnel capable of managing and maintaining cloud infrastructure and applications.
Emerging Opportunities in Government Cloud Market
- Skyrocketing demand for AI and machine learning capabilities to enhance government services, improve decision-making, and automate processes.
- Significant expansion of cloud services into emerging economies, driven by increasing digitalization initiatives and government support.
- Growing adoption of multi-cloud strategies to enhance resilience, flexibility, and avoid vendor lock-in, optimizing resource utilization and minimizing risks.
- Development of specialized, tailored cloud solutions catering to the unique requirements of specific government sectors, such as healthcare, defense, and education.
- Increased focus on sustainability and green cloud computing initiatives, promoting environmentally responsible cloud adoption.
Growth Accelerators in the Government Cloud Market Industry
Strategic partnerships between government agencies and leading cloud providers are proving critical for successful cloud adoption and market growth. These collaborations foster innovation, knowledge sharing, and the development of tailored solutions. Simultaneously, substantial investments in research and development, particularly in areas such as quantum computing and edge computing, are fueling technological advancements and expanding the possibilities within the government cloud landscape. The increasing prevalence of "cloud-first" policies adopted by governments worldwide further underscores the significant momentum driving market expansion.
Key Players Shaping the Government Cloud Market Market
- IBM Corporation
- Cisco Systems Inc
- Salesforce.com Inc
- Microsoft Corporation
- VMware Inc
- Dell Inc
- Amazon Web Services Inc
- NetApp Inc
- Oracle Corporation
- CGI Inc
- Google Inc
- Rackspace Inc
Notable Milestones in Government Cloud Market Sector
- October 2022: Oracle announced its multi-cloud offerings tailored for the Indian government, emphasizing infrastructure modernization and seamless application portability across Azure and Oracle Cloud Infrastructure (OCI).
- August 2022: Google Cloud partnered with Singapore's National AI initiative to spearhead the development of AI applications, provide training for public sector officials, and scale AI initiatives across key sectors.
- [Add a new, relevant milestone here with date and brief description]
In-Depth Government Cloud Market Market Outlook
The Government Cloud market is poised for continued growth, driven by ongoing digital transformation initiatives, increased government investments in cloud technologies, and the expanding adoption of innovative cloud-based solutions. The focus on enhanced security, compliance, and interoperability will further shape market dynamics. Strategic partnerships and the development of specialized solutions catering to the unique needs of government agencies will create significant opportunities for growth in the coming years.
Government Cloud Market Segmentation
-
1. Deployment model
- 1.1. Public Cloud
- 1.2. Private Cloud
- 1.3. Hybrid Cloud
-
2. Delivery Mode
- 2.1. Infrastructure-as-a-Service
- 2.2. Pltaform-as-a-Service
- 2.3. Software-as-a-Service
-
3. Application
- 3.1. Server and Storage
- 3.2. Disaster Recovery/Data Backup
- 3.3. Security and Compliance
- 3.4. Analytics
- 3.5. Content Management
Government Cloud Market Segmentation By Geography
- 1. North America
- 2. Europe
- 3. Asia Pacific
- 4. Latin America
- 5. Middle East and Africa

Government Cloud Market REPORT HIGHLIGHTS
| Aspects | Details |
|---|---|
| Study Period | 2019-2033 |
| Base Year | 2024 |
| Estimated Year | 2025 |
| Forecast Period | 2025-2033 |
| Historical Period | 2019-2024 |
| Growth Rate | CAGR of 17.13% from 2019-2033 |
| Segmentation |
|
Table of Contents
- 1. Introduction
- 1.1. Research Scope
- 1.2. Market Segmentation
- 1.3. Research Methodology
- 1.4. Definitions and Assumptions
- 2. Executive Summary
- 2.1. Introduction
- 3. Market Dynamics
- 3.1. Introduction
- 3.2. Market Drivers
- 3.2.1. 6.1 Need for Greater Storage Capabilities is Driving the Market Demand6.2 Need for Data Transparency are Expanding the Market
- 3.3. Market Restrains
- 3.3.1. 7.1 Cloud Computing Skills Gap is Hindering the Market Growth
- 3.4. Market Trends
- 3.4.1. Need for Greater Cloud Storage Capabilities to witness growth
- 4. Market Factor Analysis
- 4.1. Porters Five Forces
- 4.2. Supply/Value Chain
- 4.3. PESTEL analysis
- 4.4. Market Entropy
- 4.5. Patent/Trademark Analysis
- 5. Global Government Cloud Market Analysis, Insights and Forecast, 2019-2031
- 5.1. Market Analysis, Insights and Forecast - by Deployment model
- 5.1.1. Public Cloud
- 5.1.2. Private Cloud
- 5.1.3. Hybrid Cloud
- 5.2. Market Analysis, Insights and Forecast - by Delivery Mode
- 5.2.1. Infrastructure-as-a-Service
- 5.2.2. Pltaform-as-a-Service
- 5.2.3. Software-as-a-Service
- 5.3. Market Analysis, Insights and Forecast - by Application
- 5.3.1. Server and Storage
- 5.3.2. Disaster Recovery/Data Backup
- 5.3.3. Security and Compliance
- 5.3.4. Analytics
- 5.3.5. Content Management
- 5.4. Market Analysis, Insights and Forecast - by Region
- 5.4.1. North America
- 5.4.2. Europe
- 5.4.3. Asia Pacific
- 5.4.4. Latin America
- 5.4.5. Middle East and Africa
- 5.1. Market Analysis, Insights and Forecast - by Deployment model
- 6. North America Government Cloud Market Analysis, Insights and Forecast, 2019-2031
- 6.1. Market Analysis, Insights and Forecast - by Deployment model
- 6.1.1. Public Cloud
- 6.1.2. Private Cloud
- 6.1.3. Hybrid Cloud
- 6.2. Market Analysis, Insights and Forecast - by Delivery Mode
- 6.2.1. Infrastructure-as-a-Service
- 6.2.2. Pltaform-as-a-Service
- 6.2.3. Software-as-a-Service
- 6.3. Market Analysis, Insights and Forecast - by Application
- 6.3.1. Server and Storage
- 6.3.2. Disaster Recovery/Data Backup
- 6.3.3. Security and Compliance
- 6.3.4. Analytics
- 6.3.5. Content Management
- 6.1. Market Analysis, Insights and Forecast - by Deployment model
- 7. Europe Government Cloud Market Analysis, Insights and Forecast, 2019-2031
- 7.1. Market Analysis, Insights and Forecast - by Deployment model
- 7.1.1. Public Cloud
- 7.1.2. Private Cloud
- 7.1.3. Hybrid Cloud
- 7.2. Market Analysis, Insights and Forecast - by Delivery Mode
- 7.2.1. Infrastructure-as-a-Service
- 7.2.2. Pltaform-as-a-Service
- 7.2.3. Software-as-a-Service
- 7.3. Market Analysis, Insights and Forecast - by Application
- 7.3.1. Server and Storage
- 7.3.2. Disaster Recovery/Data Backup
- 7.3.3. Security and Compliance
- 7.3.4. Analytics
- 7.3.5. Content Management
- 7.1. Market Analysis, Insights and Forecast - by Deployment model
- 8. Asia Pacific Government Cloud Market Analysis, Insights and Forecast, 2019-2031
- 8.1. Market Analysis, Insights and Forecast - by Deployment model
- 8.1.1. Public Cloud
- 8.1.2. Private Cloud
- 8.1.3. Hybrid Cloud
- 8.2. Market Analysis, Insights and Forecast - by Delivery Mode
- 8.2.1. Infrastructure-as-a-Service
- 8.2.2. Pltaform-as-a-Service
- 8.2.3. Software-as-a-Service
- 8.3. Market Analysis, Insights and Forecast - by Application
- 8.3.1. Server and Storage
- 8.3.2. Disaster Recovery/Data Backup
- 8.3.3. Security and Compliance
- 8.3.4. Analytics
- 8.3.5. Content Management
- 8.1. Market Analysis, Insights and Forecast - by Deployment model
- 9. Latin America Government Cloud Market Analysis, Insights and Forecast, 2019-2031
- 9.1. Market Analysis, Insights and Forecast - by Deployment model
- 9.1.1. Public Cloud
- 9.1.2. Private Cloud
- 9.1.3. Hybrid Cloud
- 9.2. Market Analysis, Insights and Forecast - by Delivery Mode
- 9.2.1. Infrastructure-as-a-Service
- 9.2.2. Pltaform-as-a-Service
- 9.2.3. Software-as-a-Service
- 9.3. Market Analysis, Insights and Forecast - by Application
- 9.3.1. Server and Storage
- 9.3.2. Disaster Recovery/Data Backup
- 9.3.3. Security and Compliance
- 9.3.4. Analytics
- 9.3.5. Content Management
- 9.1. Market Analysis, Insights and Forecast - by Deployment model
- 10. Middle East and Africa Government Cloud Market Analysis, Insights and Forecast, 2019-2031
- 10.1. Market Analysis, Insights and Forecast - by Deployment model
- 10.1.1. Public Cloud
- 10.1.2. Private Cloud
- 10.1.3. Hybrid Cloud
- 10.2. Market Analysis, Insights and Forecast - by Delivery Mode
- 10.2.1. Infrastructure-as-a-Service
- 10.2.2. Pltaform-as-a-Service
- 10.2.3. Software-as-a-Service
- 10.3. Market Analysis, Insights and Forecast - by Application
- 10.3.1. Server and Storage
- 10.3.2. Disaster Recovery/Data Backup
- 10.3.3. Security and Compliance
- 10.3.4. Analytics
- 10.3.5. Content Management
- 10.1. Market Analysis, Insights and Forecast - by Deployment model
- 11. North America Government Cloud Market Analysis, Insights and Forecast, 2019-2031
- 11.1. Market Analysis, Insights and Forecast - By Country/Sub-region
- 11.1.1 United States
- 11.1.2 Canada
- 11.1.3 Mexico
- 12. Europe Government Cloud Market Analysis, Insights and Forecast, 2019-2031
- 12.1. Market Analysis, Insights and Forecast - By Country/Sub-region
- 12.1.1 Germany
- 12.1.2 United Kingdom
- 12.1.3 France
- 12.1.4 Spain
- 12.1.5 Italy
- 12.1.6 Spain
- 12.1.7 Belgium
- 12.1.8 Netherland
- 12.1.9 Nordics
- 12.1.10 Rest of Europe
- 13. Asia Pacific Government Cloud Market Analysis, Insights and Forecast, 2019-2031
- 13.1. Market Analysis, Insights and Forecast - By Country/Sub-region
- 13.1.1 China
- 13.1.2 Japan
- 13.1.3 India
- 13.1.4 South Korea
- 13.1.5 Southeast Asia
- 13.1.6 Australia
- 13.1.7 Indonesia
- 13.1.8 Phillipes
- 13.1.9 Singapore
- 13.1.10 Thailandc
- 13.1.11 Rest of Asia Pacific
- 14. South America Government Cloud Market Analysis, Insights and Forecast, 2019-2031
- 14.1. Market Analysis, Insights and Forecast - By Country/Sub-region
- 14.1.1 Brazil
- 14.1.2 Argentina
- 14.1.3 Peru
- 14.1.4 Chile
- 14.1.5 Colombia
- 14.1.6 Ecuador
- 14.1.7 Venezuela
- 14.1.8 Rest of South America
- 15. North America Government Cloud Market Analysis, Insights and Forecast, 2019-2031
- 15.1. Market Analysis, Insights and Forecast - By Country/Sub-region
- 15.1.1 United States
- 15.1.2 Canada
- 15.1.3 Mexico
- 16. MEA Government Cloud Market Analysis, Insights and Forecast, 2019-2031
- 16.1. Market Analysis, Insights and Forecast - By Country/Sub-region
- 16.1.1 United Arab Emirates
- 16.1.2 Saudi Arabia
- 16.1.3 South Africa
- 16.1.4 Rest of Middle East and Africa
- 17. Competitive Analysis
- 17.1. Global Market Share Analysis 2024
- 17.2. Company Profiles
- 17.2.1 IBM Corporation
- 17.2.1.1. Overview
- 17.2.1.2. Products
- 17.2.1.3. SWOT Analysis
- 17.2.1.4. Recent Developments
- 17.2.1.5. Financials (Based on Availability)
- 17.2.2 Cisco Systems Inc
- 17.2.2.1. Overview
- 17.2.2.2. Products
- 17.2.2.3. SWOT Analysis
- 17.2.2.4. Recent Developments
- 17.2.2.5. Financials (Based on Availability)
- 17.2.3 Salesforce com Inc
- 17.2.3.1. Overview
- 17.2.3.2. Products
- 17.2.3.3. SWOT Analysis
- 17.2.3.4. Recent Developments
- 17.2.3.5. Financials (Based on Availability)
- 17.2.4 Microsoft Corporation
- 17.2.4.1. Overview
- 17.2.4.2. Products
- 17.2.4.3. SWOT Analysis
- 17.2.4.4. Recent Developments
- 17.2.4.5. Financials (Based on Availability)
- 17.2.5 VMWare Inc
- 17.2.5.1. Overview
- 17.2.5.2. Products
- 17.2.5.3. SWOT Analysis
- 17.2.5.4. Recent Developments
- 17.2.5.5. Financials (Based on Availability)
- 17.2.6 Dell Inc
- 17.2.6.1. Overview
- 17.2.6.2. Products
- 17.2.6.3. SWOT Analysis
- 17.2.6.4. Recent Developments
- 17.2.6.5. Financials (Based on Availability)
- 17.2.7 Amazon Web Services Inc
- 17.2.7.1. Overview
- 17.2.7.2. Products
- 17.2.7.3. SWOT Analysis
- 17.2.7.4. Recent Developments
- 17.2.7.5. Financials (Based on Availability)
- 17.2.8 NetApp Inc
- 17.2.8.1. Overview
- 17.2.8.2. Products
- 17.2.8.3. SWOT Analysis
- 17.2.8.4. Recent Developments
- 17.2.8.5. Financials (Based on Availability)
- 17.2.9 Oracle Corporation
- 17.2.9.1. Overview
- 17.2.9.2. Products
- 17.2.9.3. SWOT Analysis
- 17.2.9.4. Recent Developments
- 17.2.9.5. Financials (Based on Availability)
- 17.2.10 CGI Inc
- 17.2.10.1. Overview
- 17.2.10.2. Products
- 17.2.10.3. SWOT Analysis
- 17.2.10.4. Recent Developments
- 17.2.10.5. Financials (Based on Availability)
- 17.2.11 Google Inc
- 17.2.11.1. Overview
- 17.2.11.2. Products
- 17.2.11.3. SWOT Analysis
- 17.2.11.4. Recent Developments
- 17.2.11.5. Financials (Based on Availability)
- 17.2.12 Rackspace Inc
- 17.2.12.1. Overview
- 17.2.12.2. Products
- 17.2.12.3. SWOT Analysis
- 17.2.12.4. Recent Developments
- 17.2.12.5. Financials (Based on Availability)
- 17.2.1 IBM Corporation
List of Figures
- Figure 1: Global Government Cloud Market Revenue Breakdown (Million, %) by Region 2024 & 2032
- Figure 2: Global Government Cloud Market Volume Breakdown (K Unit, %) by Region 2024 & 2032
- Figure 3: North America Government Cloud Market Revenue (Million), by Country 2024 & 2032
- Figure 4: North America Government Cloud Market Volume (K Unit), by Country 2024 & 2032
- Figure 5: North America Government Cloud Market Revenue Share (%), by Country 2024 & 2032
- Figure 6: North America Government Cloud Market Volume Share (%), by Country 2024 & 2032
- Figure 7: Europe Government Cloud Market Revenue (Million), by Country 2024 & 2032
- Figure 8: Europe Government Cloud Market Volume (K Unit), by Country 2024 & 2032
- Figure 9: Europe Government Cloud Market Revenue Share (%), by Country 2024 & 2032
- Figure 10: Europe Government Cloud Market Volume Share (%), by Country 2024 & 2032
- Figure 11: Asia Pacific Government Cloud Market Revenue (Million), by Country 2024 & 2032
- Figure 12: Asia Pacific Government Cloud Market Volume (K Unit), by Country 2024 & 2032
- Figure 13: Asia Pacific Government Cloud Market Revenue Share (%), by Country 2024 & 2032
- Figure 14: Asia Pacific Government Cloud Market Volume Share (%), by Country 2024 & 2032
- Figure 15: South America Government Cloud Market Revenue (Million), by Country 2024 & 2032
- Figure 16: South America Government Cloud Market Volume (K Unit), by Country 2024 & 2032
- Figure 17: South America Government Cloud Market Revenue Share (%), by Country 2024 & 2032
- Figure 18: South America Government Cloud Market Volume Share (%), by Country 2024 & 2032
- Figure 19: North America Government Cloud Market Revenue (Million), by Country 2024 & 2032
- Figure 20: North America Government Cloud Market Volume (K Unit), by Country 2024 & 2032
- Figure 21: North America Government Cloud Market Revenue Share (%), by Country 2024 & 2032
- Figure 22: North America Government Cloud Market Volume Share (%), by Country 2024 & 2032
- Figure 23: MEA Government Cloud Market Revenue (Million), by Country 2024 & 2032
- Figure 24: MEA Government Cloud Market Volume (K Unit), by Country 2024 & 2032
- Figure 25: MEA Government Cloud Market Revenue Share (%), by Country 2024 & 2032
- Figure 26: MEA Government Cloud Market Volume Share (%), by Country 2024 & 2032
- Figure 27: North America Government Cloud Market Revenue (Million), by Deployment model 2024 & 2032
- Figure 28: North America Government Cloud Market Volume (K Unit), by Deployment model 2024 & 2032
- Figure 29: North America Government Cloud Market Revenue Share (%), by Deployment model 2024 & 2032
- Figure 30: North America Government Cloud Market Volume Share (%), by Deployment model 2024 & 2032
- Figure 31: North America Government Cloud Market Revenue (Million), by Delivery Mode 2024 & 2032
- Figure 32: North America Government Cloud Market Volume (K Unit), by Delivery Mode 2024 & 2032
- Figure 33: North America Government Cloud Market Revenue Share (%), by Delivery Mode 2024 & 2032
- Figure 34: North America Government Cloud Market Volume Share (%), by Delivery Mode 2024 & 2032
- Figure 35: North America Government Cloud Market Revenue (Million), by Application 2024 & 2032
- Figure 36: North America Government Cloud Market Volume (K Unit), by Application 2024 & 2032
- Figure 37: North America Government Cloud Market Revenue Share (%), by Application 2024 & 2032
- Figure 38: North America Government Cloud Market Volume Share (%), by Application 2024 & 2032
- Figure 39: North America Government Cloud Market Revenue (Million), by Country 2024 & 2032
- Figure 40: North America Government Cloud Market Volume (K Unit), by Country 2024 & 2032
- Figure 41: North America Government Cloud Market Revenue Share (%), by Country 2024 & 2032
- Figure 42: North America Government Cloud Market Volume Share (%), by Country 2024 & 2032
- Figure 43: Europe Government Cloud Market Revenue (Million), by Deployment model 2024 & 2032
- Figure 44: Europe Government Cloud Market Volume (K Unit), by Deployment model 2024 & 2032
- Figure 45: Europe Government Cloud Market Revenue Share (%), by Deployment model 2024 & 2032
- Figure 46: Europe Government Cloud Market Volume Share (%), by Deployment model 2024 & 2032
- Figure 47: Europe Government Cloud Market Revenue (Million), by Delivery Mode 2024 & 2032
- Figure 48: Europe Government Cloud Market Volume (K Unit), by Delivery Mode 2024 & 2032
- Figure 49: Europe Government Cloud Market Revenue Share (%), by Delivery Mode 2024 & 2032
- Figure 50: Europe Government Cloud Market Volume Share (%), by Delivery Mode 2024 & 2032
- Figure 51: Europe Government Cloud Market Revenue (Million), by Application 2024 & 2032
- Figure 52: Europe Government Cloud Market Volume (K Unit), by Application 2024 & 2032
- Figure 53: Europe Government Cloud Market Revenue Share (%), by Application 2024 & 2032
- Figure 54: Europe Government Cloud Market Volume Share (%), by Application 2024 & 2032
- Figure 55: Europe Government Cloud Market Revenue (Million), by Country 2024 & 2032
- Figure 56: Europe Government Cloud Market Volume (K Unit), by Country 2024 & 2032
- Figure 57: Europe Government Cloud Market Revenue Share (%), by Country 2024 & 2032
- Figure 58: Europe Government Cloud Market Volume Share (%), by Country 2024 & 2032
- Figure 59: Asia Pacific Government Cloud Market Revenue (Million), by Deployment model 2024 & 2032
- Figure 60: Asia Pacific Government Cloud Market Volume (K Unit), by Deployment model 2024 & 2032
- Figure 61: Asia Pacific Government Cloud Market Revenue Share (%), by Deployment model 2024 & 2032
- Figure 62: Asia Pacific Government Cloud Market Volume Share (%), by Deployment model 2024 & 2032
- Figure 63: Asia Pacific Government Cloud Market Revenue (Million), by Delivery Mode 2024 & 2032
- Figure 64: Asia Pacific Government Cloud Market Volume (K Unit), by Delivery Mode 2024 & 2032
- Figure 65: Asia Pacific Government Cloud Market Revenue Share (%), by Delivery Mode 2024 & 2032
- Figure 66: Asia Pacific Government Cloud Market Volume Share (%), by Delivery Mode 2024 & 2032
- Figure 67: Asia Pacific Government Cloud Market Revenue (Million), by Application 2024 & 2032
- Figure 68: Asia Pacific Government Cloud Market Volume (K Unit), by Application 2024 & 2032
- Figure 69: Asia Pacific Government Cloud Market Revenue Share (%), by Application 2024 & 2032
- Figure 70: Asia Pacific Government Cloud Market Volume Share (%), by Application 2024 & 2032
- Figure 71: Asia Pacific Government Cloud Market Revenue (Million), by Country 2024 & 2032
- Figure 72: Asia Pacific Government Cloud Market Volume (K Unit), by Country 2024 & 2032
- Figure 73: Asia Pacific Government Cloud Market Revenue Share (%), by Country 2024 & 2032
- Figure 74: Asia Pacific Government Cloud Market Volume Share (%), by Country 2024 & 2032
- Figure 75: Latin America Government Cloud Market Revenue (Million), by Deployment model 2024 & 2032
- Figure 76: Latin America Government Cloud Market Volume (K Unit), by Deployment model 2024 & 2032
- Figure 77: Latin America Government Cloud Market Revenue Share (%), by Deployment model 2024 & 2032
- Figure 78: Latin America Government Cloud Market Volume Share (%), by Deployment model 2024 & 2032
- Figure 79: Latin America Government Cloud Market Revenue (Million), by Delivery Mode 2024 & 2032
- Figure 80: Latin America Government Cloud Market Volume (K Unit), by Delivery Mode 2024 & 2032
- Figure 81: Latin America Government Cloud Market Revenue Share (%), by Delivery Mode 2024 & 2032
- Figure 82: Latin America Government Cloud Market Volume Share (%), by Delivery Mode 2024 & 2032
- Figure 83: Latin America Government Cloud Market Revenue (Million), by Application 2024 & 2032
- Figure 84: Latin America Government Cloud Market Volume (K Unit), by Application 2024 & 2032
- Figure 85: Latin America Government Cloud Market Revenue Share (%), by Application 2024 & 2032
- Figure 86: Latin America Government Cloud Market Volume Share (%), by Application 2024 & 2032
- Figure 87: Latin America Government Cloud Market Revenue (Million), by Country 2024 & 2032
- Figure 88: Latin America Government Cloud Market Volume (K Unit), by Country 2024 & 2032
- Figure 89: Latin America Government Cloud Market Revenue Share (%), by Country 2024 & 2032
- Figure 90: Latin America Government Cloud Market Volume Share (%), by Country 2024 & 2032
- Figure 91: Middle East and Africa Government Cloud Market Revenue (Million), by Deployment model 2024 & 2032
- Figure 92: Middle East and Africa Government Cloud Market Volume (K Unit), by Deployment model 2024 & 2032
- Figure 93: Middle East and Africa Government Cloud Market Revenue Share (%), by Deployment model 2024 & 2032
- Figure 94: Middle East and Africa Government Cloud Market Volume Share (%), by Deployment model 2024 & 2032
- Figure 95: Middle East and Africa Government Cloud Market Revenue (Million), by Delivery Mode 2024 & 2032
- Figure 96: Middle East and Africa Government Cloud Market Volume (K Unit), by Delivery Mode 2024 & 2032
- Figure 97: Middle East and Africa Government Cloud Market Revenue Share (%), by Delivery Mode 2024 & 2032
- Figure 98: Middle East and Africa Government Cloud Market Volume Share (%), by Delivery Mode 2024 & 2032
- Figure 99: Middle East and Africa Government Cloud Market Revenue (Million), by Application 2024 & 2032
- Figure 100: Middle East and Africa Government Cloud Market Volume (K Unit), by Application 2024 & 2032
- Figure 101: Middle East and Africa Government Cloud Market Revenue Share (%), by Application 2024 & 2032
- Figure 102: Middle East and Africa Government Cloud Market Volume Share (%), by Application 2024 & 2032
- Figure 103: Middle East and Africa Government Cloud Market Revenue (Million), by Country 2024 & 2032
- Figure 104: Middle East and Africa Government Cloud Market Volume (K Unit), by Country 2024 & 2032
- Figure 105: Middle East and Africa Government Cloud Market Revenue Share (%), by Country 2024 & 2032
- Figure 106: Middle East and Africa Government Cloud Market Volume Share (%), by Country 2024 & 2032
List of Tables
- Table 1: Global Government Cloud Market Revenue Million Forecast, by Region 2019 & 2032
- Table 2: Global Government Cloud Market Volume K Unit Forecast, by Region 2019 & 2032
- Table 3: Global Government Cloud Market Revenue Million Forecast, by Deployment model 2019 & 2032
- Table 4: Global Government Cloud Market Volume K Unit Forecast, by Deployment model 2019 & 2032
- Table 5: Global Government Cloud Market Revenue Million Forecast, by Delivery Mode 2019 & 2032
- Table 6: Global Government Cloud Market Volume K Unit Forecast, by Delivery Mode 2019 & 2032
- Table 7: Global Government Cloud Market Revenue Million Forecast, by Application 2019 & 2032
- Table 8: Global Government Cloud Market Volume K Unit Forecast, by Application 2019 & 2032
- Table 9: Global Government Cloud Market Revenue Million Forecast, by Region 2019 & 2032
- Table 10: Global Government Cloud Market Volume K Unit Forecast, by Region 2019 & 2032
- Table 11: Global Government Cloud Market Revenue Million Forecast, by Country 2019 & 2032
- Table 12: Global Government Cloud Market Volume K Unit Forecast, by Country 2019 & 2032
- Table 13: United States Government Cloud Market Revenue (Million) Forecast, by Application 2019 & 2032
- Table 14: United States Government Cloud Market Volume (K Unit) Forecast, by Application 2019 & 2032
- Table 15: Canada Government Cloud Market Revenue (Million) Forecast, by Application 2019 & 2032
- Table 16: Canada Government Cloud Market Volume (K Unit) Forecast, by Application 2019 & 2032
- Table 17: Mexico Government Cloud Market Revenue (Million) Forecast, by Application 2019 & 2032
- Table 18: Mexico Government Cloud Market Volume (K Unit) Forecast, by Application 2019 & 2032
- Table 19: Global Government Cloud Market Revenue Million Forecast, by Country 2019 & 2032
- Table 20: Global Government Cloud Market Volume K Unit Forecast, by Country 2019 & 2032
- Table 21: Germany Government Cloud Market Revenue (Million) Forecast, by Application 2019 & 2032
- Table 22: Germany Government Cloud Market Volume (K Unit) Forecast, by Application 2019 & 2032
- Table 23: United Kingdom Government Cloud Market Revenue (Million) Forecast, by Application 2019 & 2032
- Table 24: United Kingdom Government Cloud Market Volume (K Unit) Forecast, by Application 2019 & 2032
- Table 25: France Government Cloud Market Revenue (Million) Forecast, by Application 2019 & 2032
- Table 26: France Government Cloud Market Volume (K Unit) Forecast, by Application 2019 & 2032
- Table 27: Spain Government Cloud Market Revenue (Million) Forecast, by Application 2019 & 2032
- Table 28: Spain Government Cloud Market Volume (K Unit) Forecast, by Application 2019 & 2032
- Table 29: Italy Government Cloud Market Revenue (Million) Forecast, by Application 2019 & 2032
- Table 30: Italy Government Cloud Market Volume (K Unit) Forecast, by Application 2019 & 2032
- Table 31: Spain Government Cloud Market Revenue (Million) Forecast, by Application 2019 & 2032
- Table 32: Spain Government Cloud Market Volume (K Unit) Forecast, by Application 2019 & 2032
- Table 33: Belgium Government Cloud Market Revenue (Million) Forecast, by Application 2019 & 2032
- Table 34: Belgium Government Cloud Market Volume (K Unit) Forecast, by Application 2019 & 2032
- Table 35: Netherland Government Cloud Market Revenue (Million) Forecast, by Application 2019 & 2032
- Table 36: Netherland Government Cloud Market Volume (K Unit) Forecast, by Application 2019 & 2032
- Table 37: Nordics Government Cloud Market Revenue (Million) Forecast, by Application 2019 & 2032
- Table 38: Nordics Government Cloud Market Volume (K Unit) Forecast, by Application 2019 & 2032
- Table 39: Rest of Europe Government Cloud Market Revenue (Million) Forecast, by Application 2019 & 2032
- Table 40: Rest of Europe Government Cloud Market Volume (K Unit) Forecast, by Application 2019 & 2032
- Table 41: Global Government Cloud Market Revenue Million Forecast, by Country 2019 & 2032
- Table 42: Global Government Cloud Market Volume K Unit Forecast, by Country 2019 & 2032
- Table 43: China Government Cloud Market Revenue (Million) Forecast, by Application 2019 & 2032
- Table 44: China Government Cloud Market Volume (K Unit) Forecast, by Application 2019 & 2032
- Table 45: Japan Government Cloud Market Revenue (Million) Forecast, by Application 2019 & 2032
- Table 46: Japan Government Cloud Market Volume (K Unit) Forecast, by Application 2019 & 2032
- Table 47: India Government Cloud Market Revenue (Million) Forecast, by Application 2019 & 2032
- Table 48: India Government Cloud Market Volume (K Unit) Forecast, by Application 2019 & 2032
- Table 49: South Korea Government Cloud Market Revenue (Million) Forecast, by Application 2019 & 2032
- Table 50: South Korea Government Cloud Market Volume (K Unit) Forecast, by Application 2019 & 2032
- Table 51: Southeast Asia Government Cloud Market Revenue (Million) Forecast, by Application 2019 & 2032
- Table 52: Southeast Asia Government Cloud Market Volume (K Unit) Forecast, by Application 2019 & 2032
- Table 53: Australia Government Cloud Market Revenue (Million) Forecast, by Application 2019 & 2032
- Table 54: Australia Government Cloud Market Volume (K Unit) Forecast, by Application 2019 & 2032
- Table 55: Indonesia Government Cloud Market Revenue (Million) Forecast, by Application 2019 & 2032
- Table 56: Indonesia Government Cloud Market Volume (K Unit) Forecast, by Application 2019 & 2032
- Table 57: Phillipes Government Cloud Market Revenue (Million) Forecast, by Application 2019 & 2032
- Table 58: Phillipes Government Cloud Market Volume (K Unit) Forecast, by Application 2019 & 2032
- Table 59: Singapore Government Cloud Market Revenue (Million) Forecast, by Application 2019 & 2032
- Table 60: Singapore Government Cloud Market Volume (K Unit) Forecast, by Application 2019 & 2032
- Table 61: Thailandc Government Cloud Market Revenue (Million) Forecast, by Application 2019 & 2032
- Table 62: Thailandc Government Cloud Market Volume (K Unit) Forecast, by Application 2019 & 2032
- Table 63: Rest of Asia Pacific Government Cloud Market Revenue (Million) Forecast, by Application 2019 & 2032
- Table 64: Rest of Asia Pacific Government Cloud Market Volume (K Unit) Forecast, by Application 2019 & 2032
- Table 65: Global Government Cloud Market Revenue Million Forecast, by Country 2019 & 2032
- Table 66: Global Government Cloud Market Volume K Unit Forecast, by Country 2019 & 2032
- Table 67: Brazil Government Cloud Market Revenue (Million) Forecast, by Application 2019 & 2032
- Table 68: Brazil Government Cloud Market Volume (K Unit) Forecast, by Application 2019 & 2032
- Table 69: Argentina Government Cloud Market Revenue (Million) Forecast, by Application 2019 & 2032
- Table 70: Argentina Government Cloud Market Volume (K Unit) Forecast, by Application 2019 & 2032
- Table 71: Peru Government Cloud Market Revenue (Million) Forecast, by Application 2019 & 2032
- Table 72: Peru Government Cloud Market Volume (K Unit) Forecast, by Application 2019 & 2032
- Table 73: Chile Government Cloud Market Revenue (Million) Forecast, by Application 2019 & 2032
- Table 74: Chile Government Cloud Market Volume (K Unit) Forecast, by Application 2019 & 2032
- Table 75: Colombia Government Cloud Market Revenue (Million) Forecast, by Application 2019 & 2032
- Table 76: Colombia Government Cloud Market Volume (K Unit) Forecast, by Application 2019 & 2032
- Table 77: Ecuador Government Cloud Market Revenue (Million) Forecast, by Application 2019 & 2032
- Table 78: Ecuador Government Cloud Market Volume (K Unit) Forecast, by Application 2019 & 2032
- Table 79: Venezuela Government Cloud Market Revenue (Million) Forecast, by Application 2019 & 2032
- Table 80: Venezuela Government Cloud Market Volume (K Unit) Forecast, by Application 2019 & 2032
- Table 81: Rest of South America Government Cloud Market Revenue (Million) Forecast, by Application 2019 & 2032
- Table 82: Rest of South America Government Cloud Market Volume (K Unit) Forecast, by Application 2019 & 2032
- Table 83: Global Government Cloud Market Revenue Million Forecast, by Country 2019 & 2032
- Table 84: Global Government Cloud Market Volume K Unit Forecast, by Country 2019 & 2032
- Table 85: United States Government Cloud Market Revenue (Million) Forecast, by Application 2019 & 2032
- Table 86: United States Government Cloud Market Volume (K Unit) Forecast, by Application 2019 & 2032
- Table 87: Canada Government Cloud Market Revenue (Million) Forecast, by Application 2019 & 2032
- Table 88: Canada Government Cloud Market Volume (K Unit) Forecast, by Application 2019 & 2032
- Table 89: Mexico Government Cloud Market Revenue (Million) Forecast, by Application 2019 & 2032
- Table 90: Mexico Government Cloud Market Volume (K Unit) Forecast, by Application 2019 & 2032
- Table 91: Global Government Cloud Market Revenue Million Forecast, by Country 2019 & 2032
- Table 92: Global Government Cloud Market Volume K Unit Forecast, by Country 2019 & 2032
- Table 93: United Arab Emirates Government Cloud Market Revenue (Million) Forecast, by Application 2019 & 2032
- Table 94: United Arab Emirates Government Cloud Market Volume (K Unit) Forecast, by Application 2019 & 2032
- Table 95: Saudi Arabia Government Cloud Market Revenue (Million) Forecast, by Application 2019 & 2032
- Table 96: Saudi Arabia Government Cloud Market Volume (K Unit) Forecast, by Application 2019 & 2032
- Table 97: South Africa Government Cloud Market Revenue (Million) Forecast, by Application 2019 & 2032
- Table 98: South Africa Government Cloud Market Volume (K Unit) Forecast, by Application 2019 & 2032
- Table 99: Rest of Middle East and Africa Government Cloud Market Revenue (Million) Forecast, by Application 2019 & 2032
- Table 100: Rest of Middle East and Africa Government Cloud Market Volume (K Unit) Forecast, by Application 2019 & 2032
- Table 101: Global Government Cloud Market Revenue Million Forecast, by Deployment model 2019 & 2032
- Table 102: Global Government Cloud Market Volume K Unit Forecast, by Deployment model 2019 & 2032
- Table 103: Global Government Cloud Market Revenue Million Forecast, by Delivery Mode 2019 & 2032
- Table 104: Global Government Cloud Market Volume K Unit Forecast, by Delivery Mode 2019 & 2032
- Table 105: Global Government Cloud Market Revenue Million Forecast, by Application 2019 & 2032
- Table 106: Global Government Cloud Market Volume K Unit Forecast, by Application 2019 & 2032
- Table 107: Global Government Cloud Market Revenue Million Forecast, by Country 2019 & 2032
- Table 108: Global Government Cloud Market Volume K Unit Forecast, by Country 2019 & 2032
- Table 109: Global Government Cloud Market Revenue Million Forecast, by Deployment model 2019 & 2032
- Table 110: Global Government Cloud Market Volume K Unit Forecast, by Deployment model 2019 & 2032
- Table 111: Global Government Cloud Market Revenue Million Forecast, by Delivery Mode 2019 & 2032
- Table 112: Global Government Cloud Market Volume K Unit Forecast, by Delivery Mode 2019 & 2032
- Table 113: Global Government Cloud Market Revenue Million Forecast, by Application 2019 & 2032
- Table 114: Global Government Cloud Market Volume K Unit Forecast, by Application 2019 & 2032
- Table 115: Global Government Cloud Market Revenue Million Forecast, by Country 2019 & 2032
- Table 116: Global Government Cloud Market Volume K Unit Forecast, by Country 2019 & 2032
- Table 117: Global Government Cloud Market Revenue Million Forecast, by Deployment model 2019 & 2032
- Table 118: Global Government Cloud Market Volume K Unit Forecast, by Deployment model 2019 & 2032
- Table 119: Global Government Cloud Market Revenue Million Forecast, by Delivery Mode 2019 & 2032
- Table 120: Global Government Cloud Market Volume K Unit Forecast, by Delivery Mode 2019 & 2032
- Table 121: Global Government Cloud Market Revenue Million Forecast, by Application 2019 & 2032
- Table 122: Global Government Cloud Market Volume K Unit Forecast, by Application 2019 & 2032
- Table 123: Global Government Cloud Market Revenue Million Forecast, by Country 2019 & 2032
- Table 124: Global Government Cloud Market Volume K Unit Forecast, by Country 2019 & 2032
- Table 125: Global Government Cloud Market Revenue Million Forecast, by Deployment model 2019 & 2032
- Table 126: Global Government Cloud Market Volume K Unit Forecast, by Deployment model 2019 & 2032
- Table 127: Global Government Cloud Market Revenue Million Forecast, by Delivery Mode 2019 & 2032
- Table 128: Global Government Cloud Market Volume K Unit Forecast, by Delivery Mode 2019 & 2032
- Table 129: Global Government Cloud Market Revenue Million Forecast, by Application 2019 & 2032
- Table 130: Global Government Cloud Market Volume K Unit Forecast, by Application 2019 & 2032
- Table 131: Global Government Cloud Market Revenue Million Forecast, by Country 2019 & 2032
- Table 132: Global Government Cloud Market Volume K Unit Forecast, by Country 2019 & 2032
- Table 133: Global Government Cloud Market Revenue Million Forecast, by Deployment model 2019 & 2032
- Table 134: Global Government Cloud Market Volume K Unit Forecast, by Deployment model 2019 & 2032
- Table 135: Global Government Cloud Market Revenue Million Forecast, by Delivery Mode 2019 & 2032
- Table 136: Global Government Cloud Market Volume K Unit Forecast, by Delivery Mode 2019 & 2032
- Table 137: Global Government Cloud Market Revenue Million Forecast, by Application 2019 & 2032
- Table 138: Global Government Cloud Market Volume K Unit Forecast, by Application 2019 & 2032
- Table 139: Global Government Cloud Market Revenue Million Forecast, by Country 2019 & 2032
- Table 140: Global Government Cloud Market Volume K Unit Forecast, by Country 2019 & 2032
Frequently Asked Questions
1. What is the projected Compound Annual Growth Rate (CAGR) of the Government Cloud Market?
The projected CAGR is approximately 17.13%.
2. Which companies are prominent players in the Government Cloud Market?
Key companies in the market include IBM Corporation, Cisco Systems Inc, Salesforce com Inc, Microsoft Corporation, VMWare Inc , Dell Inc, Amazon Web Services Inc, NetApp Inc, Oracle Corporation, CGI Inc, Google Inc, Rackspace Inc.
3. What are the main segments of the Government Cloud Market?
The market segments include Deployment model, Delivery Mode, Application.
4. Can you provide details about the market size?
The market size is estimated to be USD 35.48 Million as of 2022.
5. What are some drivers contributing to market growth?
6.1 Need for Greater Storage Capabilities is Driving the Market Demand6.2 Need for Data Transparency are Expanding the Market.
6. What are the notable trends driving market growth?
Need for Greater Cloud Storage Capabilities to witness growth.
7. Are there any restraints impacting market growth?
7.1 Cloud Computing Skills Gap is Hindering the Market Growth.
8. Can you provide examples of recent developments in the market?
October 2022 - Oracle announced multi-cloud offerings for the Indian government as it doubles down on modernizing its infrastructure in the digital era; there is an excellent demand for multi-Cloud offerings among the government stakeholders, and by introducing the multi-cloud users can migrate or build new applications on Azure and then connect to high-performance and high-availability managed Oracle Database services such as Autonomous Database running on Oracle Cloud Infrastructure (OCI).
9. What pricing options are available for accessing the report?
Pricing options include single-user, multi-user, and enterprise licenses priced at USD 4750, USD 5250, and USD 8750 respectively.
10. Is the market size provided in terms of value or volume?
The market size is provided in terms of value, measured in Million and volume, measured in K Unit.
11. Are there any specific market keywords associated with the report?
Yes, the market keyword associated with the report is "Government Cloud Market," which aids in identifying and referencing the specific market segment covered.
12. How do I determine which pricing option suits my needs best?
The pricing options vary based on user requirements and access needs. Individual users may opt for single-user licenses, while businesses requiring broader access may choose multi-user or enterprise licenses for cost-effective access to the report.
13. Are there any additional resources or data provided in the Government Cloud Market report?
While the report offers comprehensive insights, it's advisable to review the specific contents or supplementary materials provided to ascertain if additional resources or data are available.
14. How can I stay updated on further developments or reports in the Government Cloud Market?
To stay informed about further developments, trends, and reports in the Government Cloud Market, consider subscribing to industry newsletters, following relevant companies and organizations, or regularly checking reputable industry news sources and publications.
Methodology
Step 1 - Identification of Relevant Samples Size from Population Database


Step 2 - Approaches for Defining Global Market Size (Value, Volume* & Price*)

Note*: In applicable scenarios
Step 3 - Data Sources
Primary Research
- Web Analytics
- Survey Reports
- Research Institute
- Latest Research Reports
- Opinion Leaders
Secondary Research
- Annual Reports
- White Paper
- Latest Press Release
- Industry Association
- Paid Database
- Investor Presentations

Step 4 - Data Triangulation
Involves using different sources of information in order to increase the validity of a study
These sources are likely to be stakeholders in a program - participants, other researchers, program staff, other community members, and so on.
Then we put all data in single framework & apply various statistical tools to find out the dynamic on the market.
During the analysis stage, feedback from the stakeholder groups would be compared to determine areas of agreement as well as areas of divergence


