
Key Insights
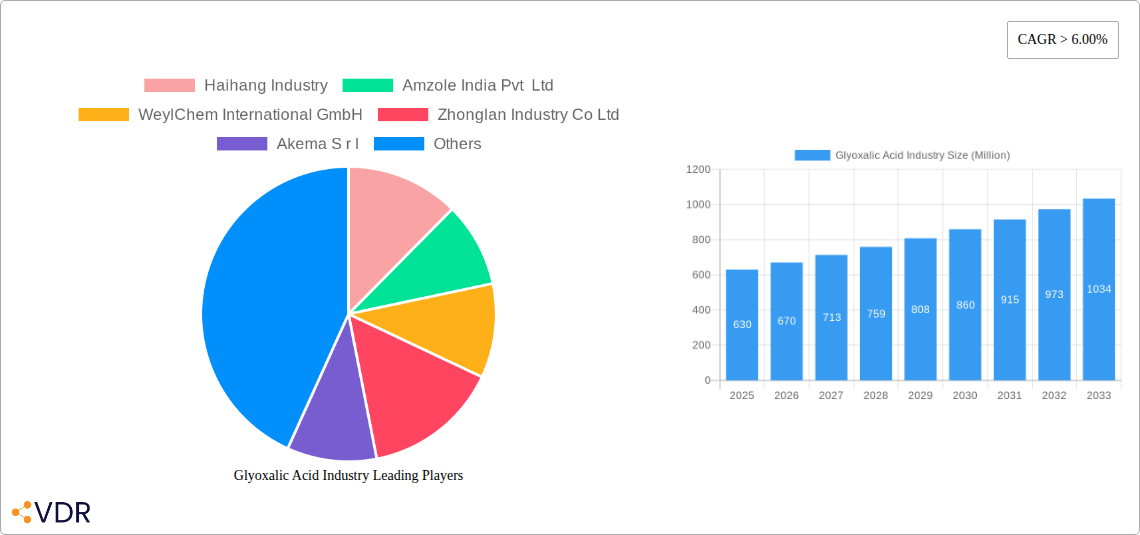
The global glyoxalic acid market, currently valued at $630 million in 2025, is projected to experience robust growth, exceeding a 6% CAGR through 2033. This expansion is driven by increasing demand across diverse end-use sectors. The personal care and cosmetics industry utilizes glyoxalic acid as a key ingredient in various formulations, contributing significantly to market growth. Simultaneously, the pharmaceutical industry leverages its properties in drug synthesis, further fueling market demand. The agrochemical sector also represents a substantial market segment, employing glyoxalic acid as a vital component in herbicides and pesticides. The flavor industry's use of glyoxalic acid as a flavor enhancer also adds to the overall market expansion. Other significant application areas include the food and beverage industry, where it functions as a preservative and processing aid. Growth is further supported by advancements in production technologies leading to improved efficiency and reduced costs. However, potential regulatory hurdles related to environmental concerns and safety protocols could pose challenges. The Asia-Pacific region, particularly China and India, dominates the market due to rapid industrialization and a burgeoning demand across multiple sectors. North America and Europe also contribute significantly, fueled by robust pharmaceutical and personal care industries.
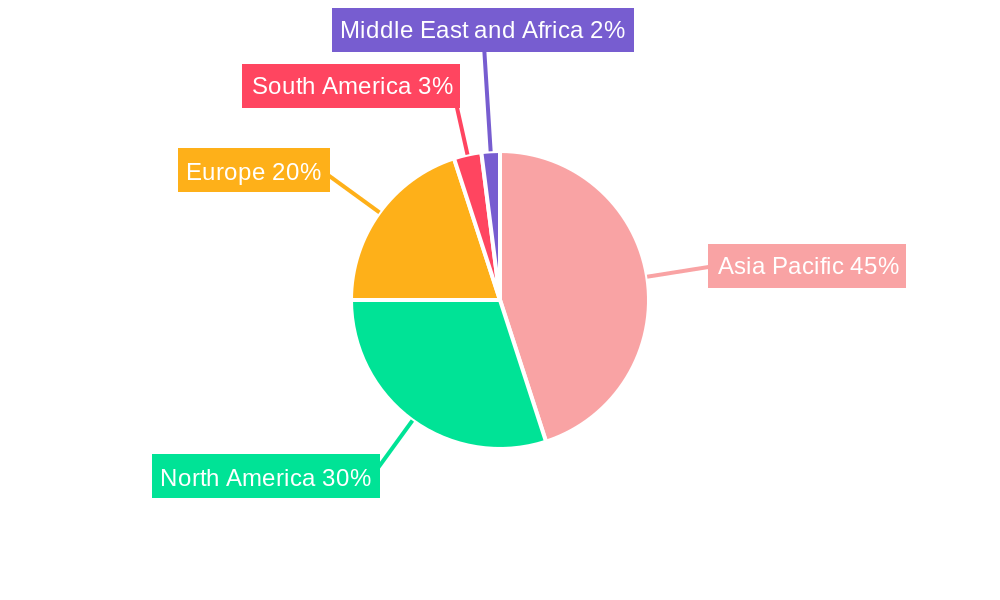
Geographical distribution reveals a strong concentration in the Asia-Pacific region, driven by the large-scale manufacturing and consumption in China and India. North America and Europe follow, propelled by established chemical industries and strong demand from various sectors. The South American and Middle Eastern & African markets are projected to witness significant growth potential, although currently representing a smaller market share. Key players in the glyoxalic acid market include Haihang Industry, Amzole India Pvt Ltd, WeylChem International GmbH, and others. These companies are actively engaged in expanding their production capacities and exploring new applications to meet growing market demand. Competitive dynamics are characterized by both price competition and product differentiation based on purity and specific applications. Future growth will be shaped by innovations in production methods, a stronger focus on sustainability, and regulatory landscape developments.
Glyoxalic Acid Industry Market Report: 2019-2033
This comprehensive report provides an in-depth analysis of the global glyoxalic acid market, encompassing market size, growth trends, competitive landscape, and future outlook. The report covers the period from 2019 to 2033, with a focus on the forecast period from 2025 to 2033. This detailed analysis serves as an invaluable resource for industry professionals, investors, and researchers seeking to understand and capitalize on opportunities within the glyoxalic acid market and its parent and child markets (chemicals and specific end-use industries). The report analyzes key players, including Haihang Industry, Amzole India Pvt Ltd, WeylChem International GmbH, Zhonglan Industry Co Ltd, Akema S r l, JIAXING ZHONGHUA CHEMICAL Co Ltd, Hubei Hongyuan Pharmaceutical Technology Co Ltd, Xinjiang Guolin New Materials Co Ltd, STAN Chemical Co Ltd, and Ensince Industry Co Ltd, but the list is not exhaustive.
The market is segmented by end-user industries including Personal Care and Cosmetics, Pharmaceuticals, Agrochemicals, Flavour Industry, and Others (Food and Beverage, etc.). The report provides granular data on market size and growth projections for each segment and across key geographies.
Glyoxalic Acid Industry Market Dynamics & Structure
This section analyzes the market structure, competitive landscape, and influencing factors shaping the glyoxalic acid industry. We delve into market concentration, identifying the top players and their market share (xx%), technological innovations driving growth, and regulatory frameworks impacting production and distribution. We also examine the competitive threat from substitute products, analyze end-user demographics, and explore M&A trends within the industry. The analysis incorporates both quantitative data (e.g., deal volumes exceeding xx million USD in the last 5 years) and qualitative factors such as innovation barriers and their impact on market competitiveness.
- Market Concentration: Highly fragmented with xx% market share held by the top 5 players.
- Technological Innovation: Focus on sustainable production methods and higher purity grades.
- Regulatory Landscape: Stringent environmental regulations driving cleaner production technologies.
- Competitive Substitutes: Limited direct substitutes, but alternative chemicals compete in specific applications.
- M&A Activity: Moderate M&A activity, with xx deals recorded between 2019-2024.
Glyoxalic Acid Industry Growth Trends & Insights
This section provides a detailed analysis of glyoxalic acid market growth trends, using XXX to calculate historical and projected market sizes (in million units) and adoption rates. We examine technological disruptions that are reshaping the industry and analyze consumer behavior shifts impacting demand. Specific metrics such as the Compound Annual Growth Rate (CAGR) and market penetration rates are included to provide deeper insight into market evolution and growth potential. The analysis covers market size evolution (from xx million units in 2019 to xx million units in 2024), adoption rate variations across segments, the impact of technological breakthroughs on market dynamics, and a detailed study of shifts in consumer preference impacting demand patterns. The projected CAGR for 2025-2033 is xx%.

Dominant Regions, Countries, or Segments in Glyoxalic Acid Industry
This section identifies the leading regions, countries, or market segments within the glyoxalic acid industry driving market growth. A comprehensive analysis explores the dominance factors of each leading region/segment, including market share and growth potential. The analysis evaluates the growth drivers such as economic policies, infrastructure, and regulatory landscape, and the specific end-user application (e.g., Pharmaceuticals, Agrochemicals) leading the market.
- Leading Region/Segment: [Identify leading region/segment based on analysis – e.g., Asia-Pacific/Pharmaceuticals].
- Key Drivers: [List key drivers using bullet points – e.g., increasing demand for pharmaceuticals in emerging economies, government support for agrochemical industry, etc.]
- Dominance Factors: [Describe dominance factors in paragraphs – e.g., established manufacturing base, favorable government policies, strong technological capabilities, etc.]
Glyoxalic Acid Industry Product Landscape
This section details the product innovations, applications, and performance metrics of glyoxalic acid. We highlight unique selling propositions and technological advancements in the market. The focus is on various grades of glyoxalic acid, their specific applications (e.g., high-purity grade used in pharmaceuticals), and improved performance characteristics contributing to enhanced efficacy and widespread adoption.
Key Drivers, Barriers & Challenges in Glyoxalic Acid Industry
This section outlines the key drivers and challenges influencing the glyoxalic acid market. We identify technological advancements, economic factors, and policy influences that are accelerating market growth. Conversely, we detail the challenges and restraints, quantifying their impact on market expansion. The challenges discussed include supply chain issues, regulatory hurdles, and competitive pressures.
Key Drivers:
- Increasing demand from the pharmaceutical and agrochemical industries.
- Technological advancements leading to more efficient and sustainable production methods.
- Favorable government policies and incentives promoting the growth of the chemical industry.
Key Challenges:
- Fluctuations in raw material prices impacting profitability.
- Stringent environmental regulations increasing production costs.
- Intense competition from existing and new market entrants.
Emerging Opportunities in Glyoxalic Acid Industry
This section highlights emerging opportunities within the glyoxalic acid market. We focus on untapped markets, innovative applications of glyoxalic acid in niche areas, and evolving consumer preferences driving demand in certain segments.
Growth Accelerators in the Glyoxalic Acid Industry Industry
This section discusses the catalysts driving long-term growth in the glyoxalic acid market. We emphasize technological breakthroughs, strategic partnerships, and market expansion strategies that will shape the future of the industry.
Key Players Shaping the Glyoxalic Acid Industry Market
- Haihang Industry
- Amzole India Pvt Ltd
- WeylChem International GmbH
- Zhonglan Industry Co Ltd
- Akema S r l
- JIAXING ZHONGHUA CHEMICAL Co Ltd
- Hubei Hongyuan Pharmaceutical Technology Co Ltd
- Xinjiang Guolin New Materials Co Ltd
- STAN Chemical Co Ltd
- Ensince Industry Co Ltd
- List Not Exhaustive
Notable Milestones in Glyoxalic Acid Industry Sector
- August 2023: Chemours completes the sale of its glycolic acid business to Iron Path Capital-backed PureTech Scientific, LLC for USD 137 million. This signifies consolidation within the broader chemical sector and could impact the glyoxalic acid market indirectly through competitive dynamics.
- August 2023: Guolin New Materials announced the expansion of its high-quality glyoxalic acid business to the European market. This move enhances the company's global reach and potentially increases competition within the European market.
In-Depth Glyoxalic Acid Industry Market Outlook
The glyoxalic acid market is poised for significant growth driven by increasing demand from key end-use sectors. Technological advancements and strategic partnerships will continue to shape the industry landscape, creating new opportunities for market expansion and innovation. The future holds substantial potential for players who embrace sustainable practices and focus on developing high-value applications.
Glyoxalic Acid Industry Segmentation
-
1. End-user
- 1.1. Personal Care and Cosmetics
- 1.2. Pharmaceuticals
- 1.3. Agrochemicals
- 1.4. Flavour Industry
- 1.5. Others (Food and Beverage, etc.)
Glyoxalic Acid Industry Segmentation By Geography
-
1. Asia Pacific
- 1.1. China
- 1.2. India
- 1.3. Japan
- 1.4. South Korea
- 1.5. Rest of Asia Pacific
-
2. North America
- 2.1. United States
- 2.2. Canada
- 2.3. Mexico
-
3. Europe
- 3.1. Germany
- 3.2. United Kingdom
- 3.3. Italy
- 3.4. France
- 3.5. Rest of Europe
-
4. South America
- 4.1. Brazil
- 4.2. Argentina
- 4.3. Rest of South America
-
5. Middle East and Africa
- 5.1. Saudi Arabia
- 5.2. South Africa
- 5.3. Rest of Middle East and Africa
Glyoxalic Acid Industry REPORT HIGHLIGHTS
| Aspects | Details |
|---|---|
| Study Period | 2019-2033 |
| Base Year | 2024 |
| Estimated Year | 2025 |
| Forecast Period | 2025-2033 |
| Historical Period | 2019-2024 |
| Growth Rate | CAGR of > 6.00% from 2019-2033 |
| Segmentation |
|
Table of Contents
- 1. Introduction
- 1.1. Research Scope
- 1.2. Market Segmentation
- 1.3. Research Methodology
- 1.4. Definitions and Assumptions
- 2. Executive Summary
- 2.1. Introduction
- 3. Market Dynamics
- 3.1. Introduction
- 3.2. Market Drivers
- 3.2.1. Increasing Demand from Agrochemicals Sector; Growing Applications from Personal Care and Cosmetic Industry; Other Drivers
- 3.3. Market Restrains
- 3.3.1. Stringent Regulation Regarding Emission Control and Waste Disposal; Other Restraints
- 3.4. Market Trends
- 3.4.1. Increasing demand from Personal Care and Cosmetics Sector
- 4. Market Factor Analysis
- 4.1. Porters Five Forces
- 4.2. Supply/Value Chain
- 4.3. PESTEL analysis
- 4.4. Market Entropy
- 4.5. Patent/Trademark Analysis
- 5. Global Glyoxalic Acid Industry Analysis, Insights and Forecast, 2019-2031
- 5.1. Market Analysis, Insights and Forecast - by End-user
- 5.1.1. Personal Care and Cosmetics
- 5.1.2. Pharmaceuticals
- 5.1.3. Agrochemicals
- 5.1.4. Flavour Industry
- 5.1.5. Others (Food and Beverage, etc.)
- 5.2. Market Analysis, Insights and Forecast - by Region
- 5.2.1. Asia Pacific
- 5.2.2. North America
- 5.2.3. Europe
- 5.2.4. South America
- 5.2.5. Middle East and Africa
- 5.1. Market Analysis, Insights and Forecast - by End-user
- 6. Asia Pacific Glyoxalic Acid Industry Analysis, Insights and Forecast, 2019-2031
- 6.1. Market Analysis, Insights and Forecast - by End-user
- 6.1.1. Personal Care and Cosmetics
- 6.1.2. Pharmaceuticals
- 6.1.3. Agrochemicals
- 6.1.4. Flavour Industry
- 6.1.5. Others (Food and Beverage, etc.)
- 6.1. Market Analysis, Insights and Forecast - by End-user
- 7. North America Glyoxalic Acid Industry Analysis, Insights and Forecast, 2019-2031
- 7.1. Market Analysis, Insights and Forecast - by End-user
- 7.1.1. Personal Care and Cosmetics
- 7.1.2. Pharmaceuticals
- 7.1.3. Agrochemicals
- 7.1.4. Flavour Industry
- 7.1.5. Others (Food and Beverage, etc.)
- 7.1. Market Analysis, Insights and Forecast - by End-user
- 8. Europe Glyoxalic Acid Industry Analysis, Insights and Forecast, 2019-2031
- 8.1. Market Analysis, Insights and Forecast - by End-user
- 8.1.1. Personal Care and Cosmetics
- 8.1.2. Pharmaceuticals
- 8.1.3. Agrochemicals
- 8.1.4. Flavour Industry
- 8.1.5. Others (Food and Beverage, etc.)
- 8.1. Market Analysis, Insights and Forecast - by End-user
- 9. South America Glyoxalic Acid Industry Analysis, Insights and Forecast, 2019-2031
- 9.1. Market Analysis, Insights and Forecast - by End-user
- 9.1.1. Personal Care and Cosmetics
- 9.1.2. Pharmaceuticals
- 9.1.3. Agrochemicals
- 9.1.4. Flavour Industry
- 9.1.5. Others (Food and Beverage, etc.)
- 9.1. Market Analysis, Insights and Forecast - by End-user
- 10. Middle East and Africa Glyoxalic Acid Industry Analysis, Insights and Forecast, 2019-2031
- 10.1. Market Analysis, Insights and Forecast - by End-user
- 10.1.1. Personal Care and Cosmetics
- 10.1.2. Pharmaceuticals
- 10.1.3. Agrochemicals
- 10.1.4. Flavour Industry
- 10.1.5. Others (Food and Beverage, etc.)
- 10.1. Market Analysis, Insights and Forecast - by End-user
- 11. Asia Pacific Glyoxalic Acid Industry Analysis, Insights and Forecast, 2019-2031
- 11.1. Market Analysis, Insights and Forecast - By Country/Sub-region
- 11.1.1 China
- 11.1.2 India
- 11.1.3 Japan
- 11.1.4 South Korea
- 11.1.5 Rest of Asia Pacific
- 12. North America Glyoxalic Acid Industry Analysis, Insights and Forecast, 2019-2031
- 12.1. Market Analysis, Insights and Forecast - By Country/Sub-region
- 12.1.1 United States
- 12.1.2 Canada
- 12.1.3 Mexico
- 13. Europe Glyoxalic Acid Industry Analysis, Insights and Forecast, 2019-2031
- 13.1. Market Analysis, Insights and Forecast - By Country/Sub-region
- 13.1.1 Germany
- 13.1.2 United Kingdom
- 13.1.3 Italy
- 13.1.4 France
- 13.1.5 Rest of Europe
- 14. South America Glyoxalic Acid Industry Analysis, Insights and Forecast, 2019-2031
- 14.1. Market Analysis, Insights and Forecast - By Country/Sub-region
- 14.1.1 Brazil
- 14.1.2 Argentina
- 14.1.3 Rest of South America
- 15. Middle East and Africa Glyoxalic Acid Industry Analysis, Insights and Forecast, 2019-2031
- 15.1. Market Analysis, Insights and Forecast - By Country/Sub-region
- 15.1.1 Saudi Arabia
- 15.1.2 South Africa
- 15.1.3 Rest of Middle East and Africa
- 16. Competitive Analysis
- 16.1. Global Market Share Analysis 2024
- 16.2. Company Profiles
- 16.2.1 Haihang Industry
- 16.2.1.1. Overview
- 16.2.1.2. Products
- 16.2.1.3. SWOT Analysis
- 16.2.1.4. Recent Developments
- 16.2.1.5. Financials (Based on Availability)
- 16.2.2 Amzole India Pvt Ltd
- 16.2.2.1. Overview
- 16.2.2.2. Products
- 16.2.2.3. SWOT Analysis
- 16.2.2.4. Recent Developments
- 16.2.2.5. Financials (Based on Availability)
- 16.2.3 WeylChem International GmbH
- 16.2.3.1. Overview
- 16.2.3.2. Products
- 16.2.3.3. SWOT Analysis
- 16.2.3.4. Recent Developments
- 16.2.3.5. Financials (Based on Availability)
- 16.2.4 Zhonglan Industry Co Ltd
- 16.2.4.1. Overview
- 16.2.4.2. Products
- 16.2.4.3. SWOT Analysis
- 16.2.4.4. Recent Developments
- 16.2.4.5. Financials (Based on Availability)
- 16.2.5 Akema S r l
- 16.2.5.1. Overview
- 16.2.5.2. Products
- 16.2.5.3. SWOT Analysis
- 16.2.5.4. Recent Developments
- 16.2.5.5. Financials (Based on Availability)
- 16.2.6 JIAXING ZHONGHUA CHEMICAL Co Ltd
- 16.2.6.1. Overview
- 16.2.6.2. Products
- 16.2.6.3. SWOT Analysis
- 16.2.6.4. Recent Developments
- 16.2.6.5. Financials (Based on Availability)
- 16.2.7 Hubei Hongyuan Pharmaceutical Technology Co Ltd
- 16.2.7.1. Overview
- 16.2.7.2. Products
- 16.2.7.3. SWOT Analysis
- 16.2.7.4. Recent Developments
- 16.2.7.5. Financials (Based on Availability)
- 16.2.8 Xinjiang Guolin New Materials Co Ltd
- 16.2.8.1. Overview
- 16.2.8.2. Products
- 16.2.8.3. SWOT Analysis
- 16.2.8.4. Recent Developments
- 16.2.8.5. Financials (Based on Availability)
- 16.2.9 STAN Chemical Co Ltd
- 16.2.9.1. Overview
- 16.2.9.2. Products
- 16.2.9.3. SWOT Analysis
- 16.2.9.4. Recent Developments
- 16.2.9.5. Financials (Based on Availability)
- 16.2.10 Ensince Industry Co Ltd *List Not Exhaustive
- 16.2.10.1. Overview
- 16.2.10.2. Products
- 16.2.10.3. SWOT Analysis
- 16.2.10.4. Recent Developments
- 16.2.10.5. Financials (Based on Availability)
- 16.2.1 Haihang Industry
List of Figures
- Figure 1: Global Glyoxalic Acid Industry Revenue Breakdown (Million, %) by Region 2024 & 2032
- Figure 2: Global Glyoxalic Acid Industry Volume Breakdown (kilotons, %) by Region 2024 & 2032
- Figure 3: Asia Pacific Glyoxalic Acid Industry Revenue (Million), by Country 2024 & 2032
- Figure 4: Asia Pacific Glyoxalic Acid Industry Volume (kilotons), by Country 2024 & 2032
- Figure 5: Asia Pacific Glyoxalic Acid Industry Revenue Share (%), by Country 2024 & 2032
- Figure 6: Asia Pacific Glyoxalic Acid Industry Volume Share (%), by Country 2024 & 2032
- Figure 7: North America Glyoxalic Acid Industry Revenue (Million), by Country 2024 & 2032
- Figure 8: North America Glyoxalic Acid Industry Volume (kilotons), by Country 2024 & 2032
- Figure 9: North America Glyoxalic Acid Industry Revenue Share (%), by Country 2024 & 2032
- Figure 10: North America Glyoxalic Acid Industry Volume Share (%), by Country 2024 & 2032
- Figure 11: Europe Glyoxalic Acid Industry Revenue (Million), by Country 2024 & 2032
- Figure 12: Europe Glyoxalic Acid Industry Volume (kilotons), by Country 2024 & 2032
- Figure 13: Europe Glyoxalic Acid Industry Revenue Share (%), by Country 2024 & 2032
- Figure 14: Europe Glyoxalic Acid Industry Volume Share (%), by Country 2024 & 2032
- Figure 15: South America Glyoxalic Acid Industry Revenue (Million), by Country 2024 & 2032
- Figure 16: South America Glyoxalic Acid Industry Volume (kilotons), by Country 2024 & 2032
- Figure 17: South America Glyoxalic Acid Industry Revenue Share (%), by Country 2024 & 2032
- Figure 18: South America Glyoxalic Acid Industry Volume Share (%), by Country 2024 & 2032
- Figure 19: Middle East and Africa Glyoxalic Acid Industry Revenue (Million), by Country 2024 & 2032
- Figure 20: Middle East and Africa Glyoxalic Acid Industry Volume (kilotons), by Country 2024 & 2032
- Figure 21: Middle East and Africa Glyoxalic Acid Industry Revenue Share (%), by Country 2024 & 2032
- Figure 22: Middle East and Africa Glyoxalic Acid Industry Volume Share (%), by Country 2024 & 2032
- Figure 23: Asia Pacific Glyoxalic Acid Industry Revenue (Million), by End-user 2024 & 2032
- Figure 24: Asia Pacific Glyoxalic Acid Industry Volume (kilotons), by End-user 2024 & 2032
- Figure 25: Asia Pacific Glyoxalic Acid Industry Revenue Share (%), by End-user 2024 & 2032
- Figure 26: Asia Pacific Glyoxalic Acid Industry Volume Share (%), by End-user 2024 & 2032
- Figure 27: Asia Pacific Glyoxalic Acid Industry Revenue (Million), by Country 2024 & 2032
- Figure 28: Asia Pacific Glyoxalic Acid Industry Volume (kilotons), by Country 2024 & 2032
- Figure 29: Asia Pacific Glyoxalic Acid Industry Revenue Share (%), by Country 2024 & 2032
- Figure 30: Asia Pacific Glyoxalic Acid Industry Volume Share (%), by Country 2024 & 2032
- Figure 31: North America Glyoxalic Acid Industry Revenue (Million), by End-user 2024 & 2032
- Figure 32: North America Glyoxalic Acid Industry Volume (kilotons), by End-user 2024 & 2032
- Figure 33: North America Glyoxalic Acid Industry Revenue Share (%), by End-user 2024 & 2032
- Figure 34: North America Glyoxalic Acid Industry Volume Share (%), by End-user 2024 & 2032
- Figure 35: North America Glyoxalic Acid Industry Revenue (Million), by Country 2024 & 2032
- Figure 36: North America Glyoxalic Acid Industry Volume (kilotons), by Country 2024 & 2032
- Figure 37: North America Glyoxalic Acid Industry Revenue Share (%), by Country 2024 & 2032
- Figure 38: North America Glyoxalic Acid Industry Volume Share (%), by Country 2024 & 2032
- Figure 39: Europe Glyoxalic Acid Industry Revenue (Million), by End-user 2024 & 2032
- Figure 40: Europe Glyoxalic Acid Industry Volume (kilotons), by End-user 2024 & 2032
- Figure 41: Europe Glyoxalic Acid Industry Revenue Share (%), by End-user 2024 & 2032
- Figure 42: Europe Glyoxalic Acid Industry Volume Share (%), by End-user 2024 & 2032
- Figure 43: Europe Glyoxalic Acid Industry Revenue (Million), by Country 2024 & 2032
- Figure 44: Europe Glyoxalic Acid Industry Volume (kilotons), by Country 2024 & 2032
- Figure 45: Europe Glyoxalic Acid Industry Revenue Share (%), by Country 2024 & 2032
- Figure 46: Europe Glyoxalic Acid Industry Volume Share (%), by Country 2024 & 2032
- Figure 47: South America Glyoxalic Acid Industry Revenue (Million), by End-user 2024 & 2032
- Figure 48: South America Glyoxalic Acid Industry Volume (kilotons), by End-user 2024 & 2032
- Figure 49: South America Glyoxalic Acid Industry Revenue Share (%), by End-user 2024 & 2032
- Figure 50: South America Glyoxalic Acid Industry Volume Share (%), by End-user 2024 & 2032
- Figure 51: South America Glyoxalic Acid Industry Revenue (Million), by Country 2024 & 2032
- Figure 52: South America Glyoxalic Acid Industry Volume (kilotons), by Country 2024 & 2032
- Figure 53: South America Glyoxalic Acid Industry Revenue Share (%), by Country 2024 & 2032
- Figure 54: South America Glyoxalic Acid Industry Volume Share (%), by Country 2024 & 2032
- Figure 55: Middle East and Africa Glyoxalic Acid Industry Revenue (Million), by End-user 2024 & 2032
- Figure 56: Middle East and Africa Glyoxalic Acid Industry Volume (kilotons), by End-user 2024 & 2032
- Figure 57: Middle East and Africa Glyoxalic Acid Industry Revenue Share (%), by End-user 2024 & 2032
- Figure 58: Middle East and Africa Glyoxalic Acid Industry Volume Share (%), by End-user 2024 & 2032
- Figure 59: Middle East and Africa Glyoxalic Acid Industry Revenue (Million), by Country 2024 & 2032
- Figure 60: Middle East and Africa Glyoxalic Acid Industry Volume (kilotons), by Country 2024 & 2032
- Figure 61: Middle East and Africa Glyoxalic Acid Industry Revenue Share (%), by Country 2024 & 2032
- Figure 62: Middle East and Africa Glyoxalic Acid Industry Volume Share (%), by Country 2024 & 2032
List of Tables
- Table 1: Global Glyoxalic Acid Industry Revenue Million Forecast, by Region 2019 & 2032
- Table 2: Global Glyoxalic Acid Industry Volume kilotons Forecast, by Region 2019 & 2032
- Table 3: Global Glyoxalic Acid Industry Revenue Million Forecast, by End-user 2019 & 2032
- Table 4: Global Glyoxalic Acid Industry Volume kilotons Forecast, by End-user 2019 & 2032
- Table 5: Global Glyoxalic Acid Industry Revenue Million Forecast, by Region 2019 & 2032
- Table 6: Global Glyoxalic Acid Industry Volume kilotons Forecast, by Region 2019 & 2032
- Table 7: Global Glyoxalic Acid Industry Revenue Million Forecast, by Country 2019 & 2032
- Table 8: Global Glyoxalic Acid Industry Volume kilotons Forecast, by Country 2019 & 2032
- Table 9: China Glyoxalic Acid Industry Revenue (Million) Forecast, by Application 2019 & 2032
- Table 10: China Glyoxalic Acid Industry Volume (kilotons) Forecast, by Application 2019 & 2032
- Table 11: India Glyoxalic Acid Industry Revenue (Million) Forecast, by Application 2019 & 2032
- Table 12: India Glyoxalic Acid Industry Volume (kilotons) Forecast, by Application 2019 & 2032
- Table 13: Japan Glyoxalic Acid Industry Revenue (Million) Forecast, by Application 2019 & 2032
- Table 14: Japan Glyoxalic Acid Industry Volume (kilotons) Forecast, by Application 2019 & 2032
- Table 15: South Korea Glyoxalic Acid Industry Revenue (Million) Forecast, by Application 2019 & 2032
- Table 16: South Korea Glyoxalic Acid Industry Volume (kilotons) Forecast, by Application 2019 & 2032
- Table 17: Rest of Asia Pacific Glyoxalic Acid Industry Revenue (Million) Forecast, by Application 2019 & 2032
- Table 18: Rest of Asia Pacific Glyoxalic Acid Industry Volume (kilotons) Forecast, by Application 2019 & 2032
- Table 19: Global Glyoxalic Acid Industry Revenue Million Forecast, by Country 2019 & 2032
- Table 20: Global Glyoxalic Acid Industry Volume kilotons Forecast, by Country 2019 & 2032
- Table 21: United States Glyoxalic Acid Industry Revenue (Million) Forecast, by Application 2019 & 2032
- Table 22: United States Glyoxalic Acid Industry Volume (kilotons) Forecast, by Application 2019 & 2032
- Table 23: Canada Glyoxalic Acid Industry Revenue (Million) Forecast, by Application 2019 & 2032
- Table 24: Canada Glyoxalic Acid Industry Volume (kilotons) Forecast, by Application 2019 & 2032
- Table 25: Mexico Glyoxalic Acid Industry Revenue (Million) Forecast, by Application 2019 & 2032
- Table 26: Mexico Glyoxalic Acid Industry Volume (kilotons) Forecast, by Application 2019 & 2032
- Table 27: Global Glyoxalic Acid Industry Revenue Million Forecast, by Country 2019 & 2032
- Table 28: Global Glyoxalic Acid Industry Volume kilotons Forecast, by Country 2019 & 2032
- Table 29: Germany Glyoxalic Acid Industry Revenue (Million) Forecast, by Application 2019 & 2032
- Table 30: Germany Glyoxalic Acid Industry Volume (kilotons) Forecast, by Application 2019 & 2032
- Table 31: United Kingdom Glyoxalic Acid Industry Revenue (Million) Forecast, by Application 2019 & 2032
- Table 32: United Kingdom Glyoxalic Acid Industry Volume (kilotons) Forecast, by Application 2019 & 2032
- Table 33: Italy Glyoxalic Acid Industry Revenue (Million) Forecast, by Application 2019 & 2032
- Table 34: Italy Glyoxalic Acid Industry Volume (kilotons) Forecast, by Application 2019 & 2032
- Table 35: France Glyoxalic Acid Industry Revenue (Million) Forecast, by Application 2019 & 2032
- Table 36: France Glyoxalic Acid Industry Volume (kilotons) Forecast, by Application 2019 & 2032
- Table 37: Rest of Europe Glyoxalic Acid Industry Revenue (Million) Forecast, by Application 2019 & 2032
- Table 38: Rest of Europe Glyoxalic Acid Industry Volume (kilotons) Forecast, by Application 2019 & 2032
- Table 39: Global Glyoxalic Acid Industry Revenue Million Forecast, by Country 2019 & 2032
- Table 40: Global Glyoxalic Acid Industry Volume kilotons Forecast, by Country 2019 & 2032
- Table 41: Brazil Glyoxalic Acid Industry Revenue (Million) Forecast, by Application 2019 & 2032
- Table 42: Brazil Glyoxalic Acid Industry Volume (kilotons) Forecast, by Application 2019 & 2032
- Table 43: Argentina Glyoxalic Acid Industry Revenue (Million) Forecast, by Application 2019 & 2032
- Table 44: Argentina Glyoxalic Acid Industry Volume (kilotons) Forecast, by Application 2019 & 2032
- Table 45: Rest of South America Glyoxalic Acid Industry Revenue (Million) Forecast, by Application 2019 & 2032
- Table 46: Rest of South America Glyoxalic Acid Industry Volume (kilotons) Forecast, by Application 2019 & 2032
- Table 47: Global Glyoxalic Acid Industry Revenue Million Forecast, by Country 2019 & 2032
- Table 48: Global Glyoxalic Acid Industry Volume kilotons Forecast, by Country 2019 & 2032
- Table 49: Saudi Arabia Glyoxalic Acid Industry Revenue (Million) Forecast, by Application 2019 & 2032
- Table 50: Saudi Arabia Glyoxalic Acid Industry Volume (kilotons) Forecast, by Application 2019 & 2032
- Table 51: South Africa Glyoxalic Acid Industry Revenue (Million) Forecast, by Application 2019 & 2032
- Table 52: South Africa Glyoxalic Acid Industry Volume (kilotons) Forecast, by Application 2019 & 2032
- Table 53: Rest of Middle East and Africa Glyoxalic Acid Industry Revenue (Million) Forecast, by Application 2019 & 2032
- Table 54: Rest of Middle East and Africa Glyoxalic Acid Industry Volume (kilotons) Forecast, by Application 2019 & 2032
- Table 55: Global Glyoxalic Acid Industry Revenue Million Forecast, by End-user 2019 & 2032
- Table 56: Global Glyoxalic Acid Industry Volume kilotons Forecast, by End-user 2019 & 2032
- Table 57: Global Glyoxalic Acid Industry Revenue Million Forecast, by Country 2019 & 2032
- Table 58: Global Glyoxalic Acid Industry Volume kilotons Forecast, by Country 2019 & 2032
- Table 59: China Glyoxalic Acid Industry Revenue (Million) Forecast, by Application 2019 & 2032
- Table 60: China Glyoxalic Acid Industry Volume (kilotons) Forecast, by Application 2019 & 2032
- Table 61: India Glyoxalic Acid Industry Revenue (Million) Forecast, by Application 2019 & 2032
- Table 62: India Glyoxalic Acid Industry Volume (kilotons) Forecast, by Application 2019 & 2032
- Table 63: Japan Glyoxalic Acid Industry Revenue (Million) Forecast, by Application 2019 & 2032
- Table 64: Japan Glyoxalic Acid Industry Volume (kilotons) Forecast, by Application 2019 & 2032
- Table 65: South Korea Glyoxalic Acid Industry Revenue (Million) Forecast, by Application 2019 & 2032
- Table 66: South Korea Glyoxalic Acid Industry Volume (kilotons) Forecast, by Application 2019 & 2032
- Table 67: Rest of Asia Pacific Glyoxalic Acid Industry Revenue (Million) Forecast, by Application 2019 & 2032
- Table 68: Rest of Asia Pacific Glyoxalic Acid Industry Volume (kilotons) Forecast, by Application 2019 & 2032
- Table 69: Global Glyoxalic Acid Industry Revenue Million Forecast, by End-user 2019 & 2032
- Table 70: Global Glyoxalic Acid Industry Volume kilotons Forecast, by End-user 2019 & 2032
- Table 71: Global Glyoxalic Acid Industry Revenue Million Forecast, by Country 2019 & 2032
- Table 72: Global Glyoxalic Acid Industry Volume kilotons Forecast, by Country 2019 & 2032
- Table 73: United States Glyoxalic Acid Industry Revenue (Million) Forecast, by Application 2019 & 2032
- Table 74: United States Glyoxalic Acid Industry Volume (kilotons) Forecast, by Application 2019 & 2032
- Table 75: Canada Glyoxalic Acid Industry Revenue (Million) Forecast, by Application 2019 & 2032
- Table 76: Canada Glyoxalic Acid Industry Volume (kilotons) Forecast, by Application 2019 & 2032
- Table 77: Mexico Glyoxalic Acid Industry Revenue (Million) Forecast, by Application 2019 & 2032
- Table 78: Mexico Glyoxalic Acid Industry Volume (kilotons) Forecast, by Application 2019 & 2032
- Table 79: Global Glyoxalic Acid Industry Revenue Million Forecast, by End-user 2019 & 2032
- Table 80: Global Glyoxalic Acid Industry Volume kilotons Forecast, by End-user 2019 & 2032
- Table 81: Global Glyoxalic Acid Industry Revenue Million Forecast, by Country 2019 & 2032
- Table 82: Global Glyoxalic Acid Industry Volume kilotons Forecast, by Country 2019 & 2032
- Table 83: Germany Glyoxalic Acid Industry Revenue (Million) Forecast, by Application 2019 & 2032
- Table 84: Germany Glyoxalic Acid Industry Volume (kilotons) Forecast, by Application 2019 & 2032
- Table 85: United Kingdom Glyoxalic Acid Industry Revenue (Million) Forecast, by Application 2019 & 2032
- Table 86: United Kingdom Glyoxalic Acid Industry Volume (kilotons) Forecast, by Application 2019 & 2032
- Table 87: Italy Glyoxalic Acid Industry Revenue (Million) Forecast, by Application 2019 & 2032
- Table 88: Italy Glyoxalic Acid Industry Volume (kilotons) Forecast, by Application 2019 & 2032
- Table 89: France Glyoxalic Acid Industry Revenue (Million) Forecast, by Application 2019 & 2032
- Table 90: France Glyoxalic Acid Industry Volume (kilotons) Forecast, by Application 2019 & 2032
- Table 91: Rest of Europe Glyoxalic Acid Industry Revenue (Million) Forecast, by Application 2019 & 2032
- Table 92: Rest of Europe Glyoxalic Acid Industry Volume (kilotons) Forecast, by Application 2019 & 2032
- Table 93: Global Glyoxalic Acid Industry Revenue Million Forecast, by End-user 2019 & 2032
- Table 94: Global Glyoxalic Acid Industry Volume kilotons Forecast, by End-user 2019 & 2032
- Table 95: Global Glyoxalic Acid Industry Revenue Million Forecast, by Country 2019 & 2032
- Table 96: Global Glyoxalic Acid Industry Volume kilotons Forecast, by Country 2019 & 2032
- Table 97: Brazil Glyoxalic Acid Industry Revenue (Million) Forecast, by Application 2019 & 2032
- Table 98: Brazil Glyoxalic Acid Industry Volume (kilotons) Forecast, by Application 2019 & 2032
- Table 99: Argentina Glyoxalic Acid Industry Revenue (Million) Forecast, by Application 2019 & 2032
- Table 100: Argentina Glyoxalic Acid Industry Volume (kilotons) Forecast, by Application 2019 & 2032
- Table 101: Rest of South America Glyoxalic Acid Industry Revenue (Million) Forecast, by Application 2019 & 2032
- Table 102: Rest of South America Glyoxalic Acid Industry Volume (kilotons) Forecast, by Application 2019 & 2032
- Table 103: Global Glyoxalic Acid Industry Revenue Million Forecast, by End-user 2019 & 2032
- Table 104: Global Glyoxalic Acid Industry Volume kilotons Forecast, by End-user 2019 & 2032
- Table 105: Global Glyoxalic Acid Industry Revenue Million Forecast, by Country 2019 & 2032
- Table 106: Global Glyoxalic Acid Industry Volume kilotons Forecast, by Country 2019 & 2032
- Table 107: Saudi Arabia Glyoxalic Acid Industry Revenue (Million) Forecast, by Application 2019 & 2032
- Table 108: Saudi Arabia Glyoxalic Acid Industry Volume (kilotons) Forecast, by Application 2019 & 2032
- Table 109: South Africa Glyoxalic Acid Industry Revenue (Million) Forecast, by Application 2019 & 2032
- Table 110: South Africa Glyoxalic Acid Industry Volume (kilotons) Forecast, by Application 2019 & 2032
- Table 111: Rest of Middle East and Africa Glyoxalic Acid Industry Revenue (Million) Forecast, by Application 2019 & 2032
- Table 112: Rest of Middle East and Africa Glyoxalic Acid Industry Volume (kilotons) Forecast, by Application 2019 & 2032
Frequently Asked Questions
1. What is the projected Compound Annual Growth Rate (CAGR) of the Glyoxalic Acid Industry?
The projected CAGR is approximately > 6.00%.
2. Which companies are prominent players in the Glyoxalic Acid Industry?
Key companies in the market include Haihang Industry, Amzole India Pvt Ltd, WeylChem International GmbH, Zhonglan Industry Co Ltd, Akema S r l, JIAXING ZHONGHUA CHEMICAL Co Ltd, Hubei Hongyuan Pharmaceutical Technology Co Ltd, Xinjiang Guolin New Materials Co Ltd, STAN Chemical Co Ltd, Ensince Industry Co Ltd *List Not Exhaustive.
3. What are the main segments of the Glyoxalic Acid Industry?
The market segments include End-user.
4. Can you provide details about the market size?
The market size is estimated to be USD 630 Million as of 2022.
5. What are some drivers contributing to market growth?
Increasing Demand from Agrochemicals Sector; Growing Applications from Personal Care and Cosmetic Industry; Other Drivers.
6. What are the notable trends driving market growth?
Increasing demand from Personal Care and Cosmetics Sector.
7. Are there any restraints impacting market growth?
Stringent Regulation Regarding Emission Control and Waste Disposal; Other Restraints.
8. Can you provide examples of recent developments in the market?
August 2023: Chemours completes the sale of glycolic acid business to Iron Path Capital-backed PureTech Scientific, LLC for USD 137 million.
9. What pricing options are available for accessing the report?
Pricing options include single-user, multi-user, and enterprise licenses priced at USD 4750, USD 5250, and USD 8750 respectively.
10. Is the market size provided in terms of value or volume?
The market size is provided in terms of value, measured in Million and volume, measured in kilotons.
11. Are there any specific market keywords associated with the report?
Yes, the market keyword associated with the report is "Glyoxalic Acid Industry," which aids in identifying and referencing the specific market segment covered.
12. How do I determine which pricing option suits my needs best?
The pricing options vary based on user requirements and access needs. Individual users may opt for single-user licenses, while businesses requiring broader access may choose multi-user or enterprise licenses for cost-effective access to the report.
13. Are there any additional resources or data provided in the Glyoxalic Acid Industry report?
While the report offers comprehensive insights, it's advisable to review the specific contents or supplementary materials provided to ascertain if additional resources or data are available.
14. How can I stay updated on further developments or reports in the Glyoxalic Acid Industry?
To stay informed about further developments, trends, and reports in the Glyoxalic Acid Industry, consider subscribing to industry newsletters, following relevant companies and organizations, or regularly checking reputable industry news sources and publications.
Methodology
Step 1 - Identification of Relevant Samples Size from Population Database


Step 2 - Approaches for Defining Global Market Size (Value, Volume* & Price*)

Note*: In applicable scenarios
Step 3 - Data Sources
Primary Research
- Web Analytics
- Survey Reports
- Research Institute
- Latest Research Reports
- Opinion Leaders
Secondary Research
- Annual Reports
- White Paper
- Latest Press Release
- Industry Association
- Paid Database
- Investor Presentations

Step 4 - Data Triangulation
Involves using different sources of information in order to increase the validity of a study
These sources are likely to be stakeholders in a program - participants, other researchers, program staff, other community members, and so on.
Then we put all data in single framework & apply various statistical tools to find out the dynamic on the market.
During the analysis stage, feedback from the stakeholder groups would be compared to determine areas of agreement as well as areas of divergence


