
Key Insights
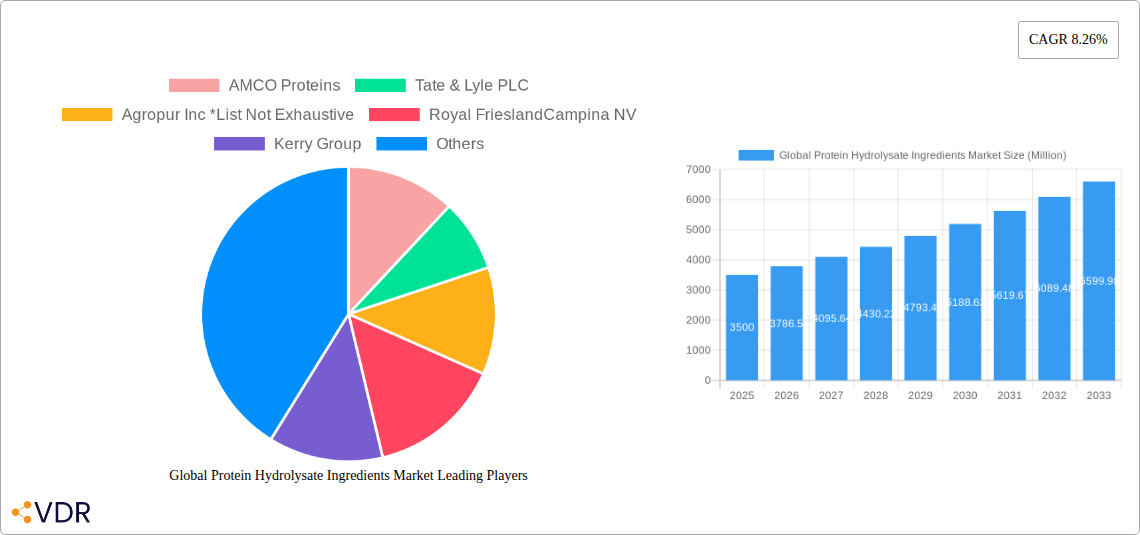
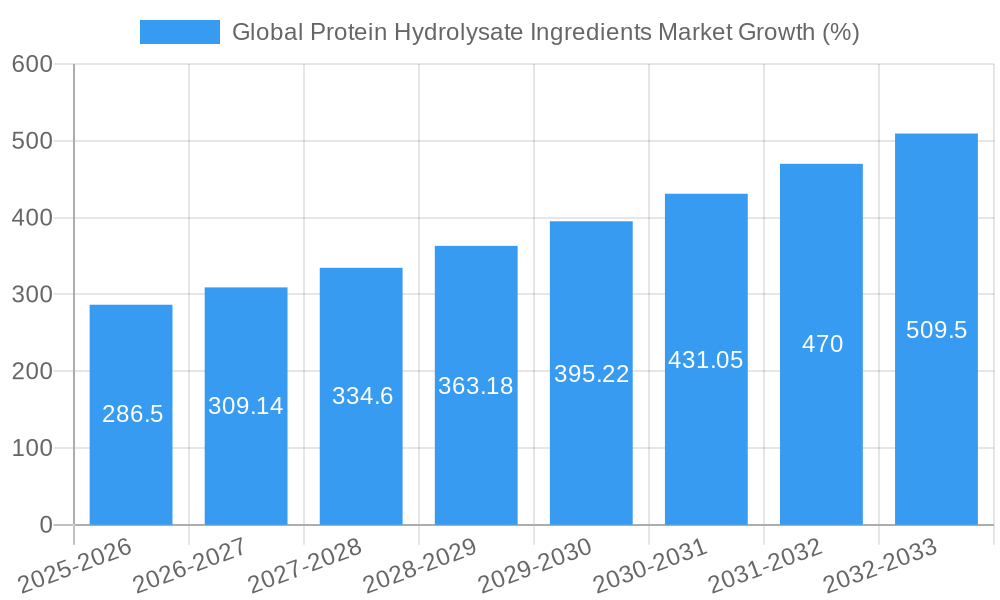
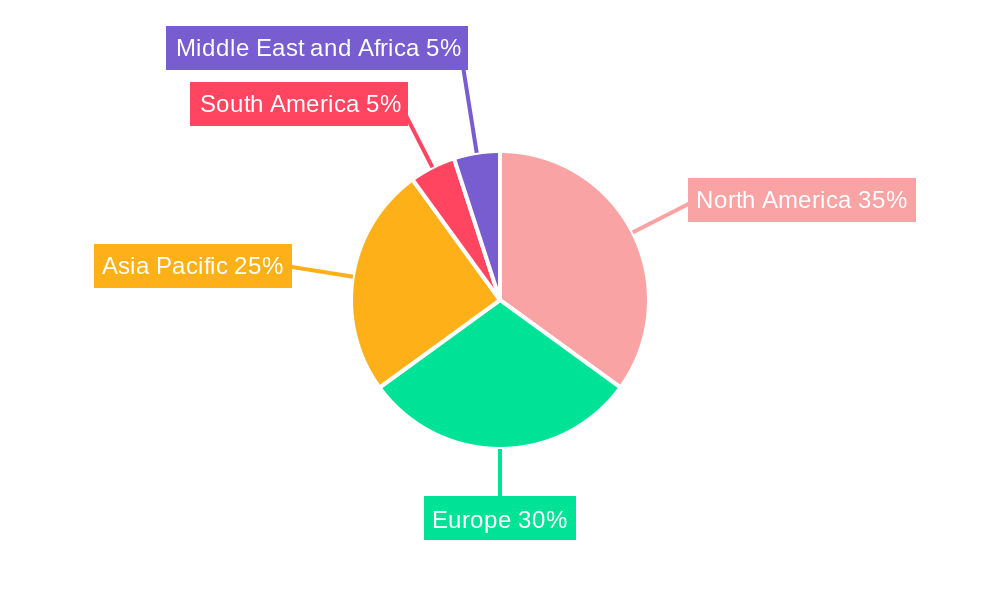
The global protein hydrolysate ingredients market, valued at approximately $3.5 billion in 2025, is projected to experience robust growth, exhibiting a compound annual growth rate (CAGR) of 8.26% from 2025 to 2033. This expansion is driven by several key factors. The increasing demand for convenient, high-protein foods and beverages fuels the market, particularly within the sports nutrition and infant nutrition sectors. Growing health consciousness among consumers, coupled with the rising prevalence of health conditions like lactose intolerance, is also a significant driver. Furthermore, the functional properties of protein hydrolysates, such as improved digestibility, enhanced solubility, and emulsifying capabilities, are increasingly sought after by food manufacturers, further bolstering market growth. The market's segmentation reflects this diversity, with milk protein hydrolysate and casein dominating the type segment, and food and beverage applications leading in the application segment. The market is geographically diversified, with North America and Europe currently holding significant shares, while Asia-Pacific presents a promising growth opportunity due to its expanding middle class and increasing protein consumption. However, potential restraints include fluctuating raw material prices and stringent regulatory requirements for food and dietary supplements.
Despite potential challenges, the long-term outlook for the global protein hydrolysate ingredients market remains positive. Continued innovation in protein hydrolysate technology, focusing on improved functionality and cost-effectiveness, is expected to drive market penetration. The development of novel applications across various sectors, including pharmaceuticals and cosmetics, presents further growth avenues. Major players in the market are strategically expanding their product portfolios and geographical reach through mergers, acquisitions, and partnerships to capitalize on emerging market opportunities. The ongoing research and development efforts focused on improving the sustainability and environmental impact of protein hydrolysate production further solidify its long-term potential. The continued focus on health and wellness, coupled with the increasing demand for convenient and functional food products, will ensure the sustained growth of this dynamic market segment.
Global Protein Hydrolysate Ingredients Market: A Comprehensive Report (2019-2033)
This comprehensive report provides an in-depth analysis of the global protein hydrolysate ingredients market, encompassing market dynamics, growth trends, regional segmentation, product landscape, key players, and future outlook. The study period covers 2019-2033, with 2025 as the base year and a forecast period of 2025-2033. The market is segmented by type (Milk Protein Hydrolysate, Casein, Plant Protein Hydrolysate, Other Plant Protein Hydrolysates, Animal Protein Hydrolysate) and application (Food and Beverage, Infant Nutrition, Sports Nutrition, Medical and Clinical Nutrition). The total market value in 2025 is estimated at xx Million.
Keywords: Protein Hydrolysate, Milk Protein Hydrolysate, Casein, Plant Protein Hydrolysate, Animal Protein Hydrolysate, Food and Beverage, Infant Nutrition, Sports Nutrition, Medical Nutrition, Market Size, Market Share, Market Growth, CAGR, Market Analysis, Market Forecast, Industry Trends, Competitive Landscape, Key Players, AMCO Proteins, Tate & Lyle PLC, Agropur Inc., Royal FrieslandCampina NV, Kerry Group, Fonterra, Milk Specialties Group, Arla Foods, Glanbia PLC, BASF SE.
Global Protein Hydrolysate Ingredients Market Market Dynamics & Structure
The global protein hydrolysate ingredients market is characterized by a moderately concentrated structure, with several large players holding significant market share. Market concentration is approximately xx% in 2025. Technological innovation, particularly in enzymatic hydrolysis and protein fractionation, is a key driver. Stringent regulatory frameworks, especially concerning food safety and labeling, influence market dynamics. Competitive substitutes, such as intact proteins and other protein sources, exert pressure. End-user demographics, including the growing health-conscious population and increasing demand for convenient and functional foods, are driving demand. Mergers and acquisitions (M&A) activity is relatively high, with major players consolidating their positions and expanding product portfolios. The total M&A deal value in the protein hydrolysate industry from 2019-2024 was approximately xx Million.
- Market Concentration: xx% in 2025 (Top 5 players)
- Technological Innovation: Enzymatic hydrolysis advancements, protein fractionation techniques.
- Regulatory Framework: Stringent food safety and labeling regulations impacting market entry and product development.
- Competitive Substitutes: Intact proteins, other protein sources.
- End-User Demographics: Growing health consciousness, demand for convenient and functional foods.
- M&A Activity: High level of consolidation among key players, driven by market expansion strategies. xx deals from 2019-2024.
- Innovation Barriers: High R&D costs, stringent regulatory approvals, and maintaining consistent product quality.
Global Protein Hydrolysate Ingredients Market Growth Trends & Insights
The global protein hydrolysate ingredients market is experiencing robust growth, driven by several factors. The market size is projected to reach xx Million by 2033, exhibiting a CAGR of xx% during the forecast period (2025-2033). Adoption rates are increasing across various applications, particularly in the food and beverage and sports nutrition segments. Technological disruptions, such as precision fermentation and plant-based protein extraction, are creating new opportunities and shaping market dynamics. Shifting consumer preferences towards healthier and more functional foods are further fueling market expansion. Market penetration in developing economies is expected to grow significantly due to increasing disposable incomes and growing awareness of health benefits. The historical period (2019-2024) saw a CAGR of xx%, indicating a strong upward trend.
Dominant Regions, Countries, or Segments in Global Protein Hydrolysate Ingredients Market
North America currently holds the largest market share in the global protein hydrolysate ingredients market, followed by Europe. Within the type segments, Milk Protein Hydrolysate dominates, accounting for approximately xx% of the total market in 2025. In terms of applications, the Food and Beverage sector is the leading segment, driven by increasing demand for protein-enriched food products. The high market share of North America is driven by several factors including a strong presence of established players, high consumer demand for protein-rich foods, and extensive research and development activities in the region. Europe’s dominance is influenced by well-developed food and beverage industries and significant investments in research and development. Asia-Pacific is expected to witness significant growth in the coming years, driven by rising disposable incomes and changing lifestyles.
- Key Drivers (North America): Strong presence of established players, high consumer demand for protein-rich foods, extensive R&D activities.
- Key Drivers (Europe): Well-developed food and beverage industries, significant investments in R&D, strong regulatory frameworks.
- Key Drivers (Asia-Pacific): Rising disposable incomes, changing lifestyles, growing health-consciousness.
- Milk Protein Hydrolysate Dominance: High demand from food and beverage, infant nutrition, and sports nutrition sectors.
- Food and Beverage Sector Dominance: Growing demand for protein-enriched foods and beverages, health and wellness trends.
Global Protein Hydrolysate Ingredients Market Product Landscape
The protein hydrolysate ingredient market offers a wide range of products tailored to diverse applications. Innovations focus on improved functionalities, such as enhanced solubility, emulsification, and foaming properties. Advancements in enzymatic hydrolysis technology enable the production of hydrolysates with specific peptide profiles and functionalities. The market sees a growing emphasis on clean-label ingredients and sustainable sourcing practices. Plant-based protein hydrolysates are gaining traction due to increasing consumer demand for vegetarian and vegan options. Performance metrics, such as protein content, degree of hydrolysis, and functional properties, are key considerations for product selection.
Key Drivers, Barriers & Challenges in Global Protein Hydrolysate Ingredients Market
Key Drivers: Growing demand for functional foods and beverages, increasing health consciousness, rising protein intake requirements in sports nutrition and medical nutrition, and technological advancements in protein hydrolysis.
Key Challenges: Fluctuations in raw material prices (e.g., milk, soy), stringent regulatory requirements, competition from alternative protein sources (e.g., pea protein, soy protein), supply chain disruptions, and maintaining consistent product quality across diverse production processes. The impact of supply chain disruptions on pricing is estimated at approximately xx% in 2024.
Emerging Opportunities in Global Protein Hydrolysate Ingredients Market
Emerging opportunities lie in untapped markets, particularly in developing economies with growing middle classes. Innovative applications, such as in pet food and pharmaceuticals, present significant potential. Evolving consumer preferences towards clean label ingredients and sustainable sourcing open avenues for specialized hydrolysates. The development of hypoallergenic and tailored protein hydrolysates is another key area for expansion. Personalized nutrition solutions using tailored protein hydrolysates are emerging as a significant opportunity in the future.
Growth Accelerators in the Global Protein Hydrolysate Ingredients Market Industry
Long-term growth will be propelled by technological breakthroughs in protein engineering and processing, resulting in higher yields and improved functionalities. Strategic partnerships between ingredient suppliers and food manufacturers will drive innovation and market penetration. Market expansion strategies focusing on emerging economies and niche applications will contribute to overall market growth.
Key Players Shaping the Global Protein Hydrolysate Ingredients Market Market
- AMCO Proteins
- Tate & Lyle PLC (Tate & Lyle PLC)
- Agropur Inc.
- Royal FrieslandCampina NV (FrieslandCampina)
- Kerry Group (Kerry Group)
- Fonterra Co-operative Group Limited (Fonterra)
- Milk Specialties Group
- Arla Foods Ingredients Group PS (Arla Foods Ingredients)
- Glanbia PLC (Glanbia)
- BASF SE (BASF)
Notable Milestones in Global Protein Hydrolysate Ingredients Market Sector
- 2019 (Month unavailable): Agropur Inc. opened a new protein hydrolysate production facility in Canada.
- 2020 (Month unavailable): Tate & Lyle PLC launched a new line of plant-based protein hydrolysates.
- 2021 (Month unavailable): AMCO Proteins acquired Proliant Health, a leading manufacturer of plant-based protein ingredients.
In-Depth Global Protein Hydrolysate Ingredients Market Market Outlook
The future of the global protein hydrolysate ingredients market is bright, fueled by sustained demand for convenient, functional, and healthy food products. Strategic opportunities lie in developing sustainable and innovative protein sources, catering to the growing demand for plant-based alternatives. Continued investment in R&D will lead to the development of higher-quality hydrolysates with enhanced functionalities, broadening market applications and driving long-term growth. The market is poised for considerable expansion, driven by technological advancements, strategic alliances, and expanding consumer preferences.
Global Protein Hydrolysate Ingredients Market Segmentation
-
1. Type
-
1.1. Milk Protein Hydrolysate
- 1.1.1. Whey
- 1.1.2. Caesin
-
1.2. Plant Protein Hydrolysate
- 1.2.1. Soy
- 1.2.2. Other Plant Protein Hydrolysates
- 1.3. Animal Protein Hydrolysate
-
1.1. Milk Protein Hydrolysate
-
2. Application
-
2.1. Food and Beverage
- 2.1.1. Functional Food and Beverage
- 2.1.2. Infant Nutrition
- 2.2. Sports Nutrition
- 2.3. Medical and Clinical Nutrition
-
2.1. Food and Beverage
Global Protein Hydrolysate Ingredients Market Segmentation By Geography
-
1. North America
- 1.1. United States
- 1.2. Canada
- 1.3. Mexico
- 1.4. Rest of North America
-
2. Europe
- 2.1. Germany
- 2.2. United Kingdom
- 2.3. Spain
- 2.4. France
- 2.5. Italy
- 2.6. Rest of Europe
-
3. Asia Pacific
- 3.1. China
- 3.2. Japan
- 3.3. India
- 3.4. Australia
- 3.5. Rest of Asia Pacific
-
4. South America
- 4.1. Brazil
- 4.2. Argentina
- 4.3. Rest of South America
-
5. Middle East and Africa
- 5.1. Saudi Arabia
- 5.2. South Africa
- 5.3. Rest of Middle East
Global Protein Hydrolysate Ingredients Market REPORT HIGHLIGHTS
| Aspects | Details |
|---|---|
| Study Period | 2019-2033 |
| Base Year | 2024 |
| Estimated Year | 2025 |
| Forecast Period | 2025-2033 |
| Historical Period | 2019-2024 |
| Growth Rate | CAGR of 8.26% from 2019-2033 |
| Segmentation |
|
Table of Contents
- 1. Introduction
- 1.1. Research Scope
- 1.2. Market Segmentation
- 1.3. Research Methodology
- 1.4. Definitions and Assumptions
- 2. Executive Summary
- 2.1. Introduction
- 3. Market Dynamics
- 3.1. Introduction
- 3.2. Market Drivers
- 3.2.1. Increasing Demand For Baby Food and Infant Formula; Growing Application of Casein and Caseinates in Protein-rich Food Products
- 3.3. Market Restrains
- 3.3.1. Increasing Manufacturing Costs and Raw Materials Price Hamper the Market Growth
- 3.4. Market Trends
- 3.4.1. Growing Influence Of Healthy Lifestyle Trends And Rising Non-traditional Users
- 4. Market Factor Analysis
- 4.1. Porters Five Forces
- 4.2. Supply/Value Chain
- 4.3. PESTEL analysis
- 4.4. Market Entropy
- 4.5. Patent/Trademark Analysis
- 5. Global Protein Hydrolysate Ingredients Market Analysis, Insights and Forecast, 2019-2031
- 5.1. Market Analysis, Insights and Forecast - by Type
- 5.1.1. Milk Protein Hydrolysate
- 5.1.1.1. Whey
- 5.1.1.2. Caesin
- 5.1.2. Plant Protein Hydrolysate
- 5.1.2.1. Soy
- 5.1.2.2. Other Plant Protein Hydrolysates
- 5.1.3. Animal Protein Hydrolysate
- 5.1.1. Milk Protein Hydrolysate
- 5.2. Market Analysis, Insights and Forecast - by Application
- 5.2.1. Food and Beverage
- 5.2.1.1. Functional Food and Beverage
- 5.2.1.2. Infant Nutrition
- 5.2.2. Sports Nutrition
- 5.2.3. Medical and Clinical Nutrition
- 5.2.1. Food and Beverage
- 5.3. Market Analysis, Insights and Forecast - by Region
- 5.3.1. North America
- 5.3.2. Europe
- 5.3.3. Asia Pacific
- 5.3.4. South America
- 5.3.5. Middle East and Africa
- 5.1. Market Analysis, Insights and Forecast - by Type
- 6. North America Global Protein Hydrolysate Ingredients Market Analysis, Insights and Forecast, 2019-2031
- 6.1. Market Analysis, Insights and Forecast - by Type
- 6.1.1. Milk Protein Hydrolysate
- 6.1.1.1. Whey
- 6.1.1.2. Caesin
- 6.1.2. Plant Protein Hydrolysate
- 6.1.2.1. Soy
- 6.1.2.2. Other Plant Protein Hydrolysates
- 6.1.3. Animal Protein Hydrolysate
- 6.1.1. Milk Protein Hydrolysate
- 6.2. Market Analysis, Insights and Forecast - by Application
- 6.2.1. Food and Beverage
- 6.2.1.1. Functional Food and Beverage
- 6.2.1.2. Infant Nutrition
- 6.2.2. Sports Nutrition
- 6.2.3. Medical and Clinical Nutrition
- 6.2.1. Food and Beverage
- 6.1. Market Analysis, Insights and Forecast - by Type
- 7. Europe Global Protein Hydrolysate Ingredients Market Analysis, Insights and Forecast, 2019-2031
- 7.1. Market Analysis, Insights and Forecast - by Type
- 7.1.1. Milk Protein Hydrolysate
- 7.1.1.1. Whey
- 7.1.1.2. Caesin
- 7.1.2. Plant Protein Hydrolysate
- 7.1.2.1. Soy
- 7.1.2.2. Other Plant Protein Hydrolysates
- 7.1.3. Animal Protein Hydrolysate
- 7.1.1. Milk Protein Hydrolysate
- 7.2. Market Analysis, Insights and Forecast - by Application
- 7.2.1. Food and Beverage
- 7.2.1.1. Functional Food and Beverage
- 7.2.1.2. Infant Nutrition
- 7.2.2. Sports Nutrition
- 7.2.3. Medical and Clinical Nutrition
- 7.2.1. Food and Beverage
- 7.1. Market Analysis, Insights and Forecast - by Type
- 8. Asia Pacific Global Protein Hydrolysate Ingredients Market Analysis, Insights and Forecast, 2019-2031
- 8.1. Market Analysis, Insights and Forecast - by Type
- 8.1.1. Milk Protein Hydrolysate
- 8.1.1.1. Whey
- 8.1.1.2. Caesin
- 8.1.2. Plant Protein Hydrolysate
- 8.1.2.1. Soy
- 8.1.2.2. Other Plant Protein Hydrolysates
- 8.1.3. Animal Protein Hydrolysate
- 8.1.1. Milk Protein Hydrolysate
- 8.2. Market Analysis, Insights and Forecast - by Application
- 8.2.1. Food and Beverage
- 8.2.1.1. Functional Food and Beverage
- 8.2.1.2. Infant Nutrition
- 8.2.2. Sports Nutrition
- 8.2.3. Medical and Clinical Nutrition
- 8.2.1. Food and Beverage
- 8.1. Market Analysis, Insights and Forecast - by Type
- 9. South America Global Protein Hydrolysate Ingredients Market Analysis, Insights and Forecast, 2019-2031
- 9.1. Market Analysis, Insights and Forecast - by Type
- 9.1.1. Milk Protein Hydrolysate
- 9.1.1.1. Whey
- 9.1.1.2. Caesin
- 9.1.2. Plant Protein Hydrolysate
- 9.1.2.1. Soy
- 9.1.2.2. Other Plant Protein Hydrolysates
- 9.1.3. Animal Protein Hydrolysate
- 9.1.1. Milk Protein Hydrolysate
- 9.2. Market Analysis, Insights and Forecast - by Application
- 9.2.1. Food and Beverage
- 9.2.1.1. Functional Food and Beverage
- 9.2.1.2. Infant Nutrition
- 9.2.2. Sports Nutrition
- 9.2.3. Medical and Clinical Nutrition
- 9.2.1. Food and Beverage
- 9.1. Market Analysis, Insights and Forecast - by Type
- 10. Middle East and Africa Global Protein Hydrolysate Ingredients Market Analysis, Insights and Forecast, 2019-2031
- 10.1. Market Analysis, Insights and Forecast - by Type
- 10.1.1. Milk Protein Hydrolysate
- 10.1.1.1. Whey
- 10.1.1.2. Caesin
- 10.1.2. Plant Protein Hydrolysate
- 10.1.2.1. Soy
- 10.1.2.2. Other Plant Protein Hydrolysates
- 10.1.3. Animal Protein Hydrolysate
- 10.1.1. Milk Protein Hydrolysate
- 10.2. Market Analysis, Insights and Forecast - by Application
- 10.2.1. Food and Beverage
- 10.2.1.1. Functional Food and Beverage
- 10.2.1.2. Infant Nutrition
- 10.2.2. Sports Nutrition
- 10.2.3. Medical and Clinical Nutrition
- 10.2.1. Food and Beverage
- 10.1. Market Analysis, Insights and Forecast - by Type
- 11. North America Global Protein Hydrolysate Ingredients Market Analysis, Insights and Forecast, 2019-2031
- 11.1. Market Analysis, Insights and Forecast - By Country/Sub-region
- 11.1.1 United States
- 11.1.2 Canada
- 11.1.3 Mexico
- 11.1.4 Rest of North America
- 12. Europe Global Protein Hydrolysate Ingredients Market Analysis, Insights and Forecast, 2019-2031
- 12.1. Market Analysis, Insights and Forecast - By Country/Sub-region
- 12.1.1 Germany
- 12.1.2 United Kingdom
- 12.1.3 Spain
- 12.1.4 France
- 12.1.5 Italy
- 12.1.6 Rest of Europe
- 13. Asia Pacific Global Protein Hydrolysate Ingredients Market Analysis, Insights and Forecast, 2019-2031
- 13.1. Market Analysis, Insights and Forecast - By Country/Sub-region
- 13.1.1 China
- 13.1.2 Japan
- 13.1.3 India
- 13.1.4 Australia
- 13.1.5 Rest of Asia Pacific
- 14. South America Global Protein Hydrolysate Ingredients Market Analysis, Insights and Forecast, 2019-2031
- 14.1. Market Analysis, Insights and Forecast - By Country/Sub-region
- 14.1.1 Brazil
- 14.1.2 Argentina
- 14.1.3 Rest of South America
- 15. Middle East and Africa Global Protein Hydrolysate Ingredients Market Analysis, Insights and Forecast, 2019-2031
- 15.1. Market Analysis, Insights and Forecast - By Country/Sub-region
- 15.1.1 Saudi Arabia
- 15.1.2 South Africa
- 15.1.3 Rest of Middle East
- 16. Competitive Analysis
- 16.1. Market Share Analysis 2024
- 16.2. Company Profiles
- 16.2.1 AMCO Proteins
- 16.2.1.1. Overview
- 16.2.1.2. Products
- 16.2.1.3. SWOT Analysis
- 16.2.1.4. Recent Developments
- 16.2.1.5. Financials (Based on Availability)
- 16.2.2 Tate & Lyle PLC
- 16.2.2.1. Overview
- 16.2.2.2. Products
- 16.2.2.3. SWOT Analysis
- 16.2.2.4. Recent Developments
- 16.2.2.5. Financials (Based on Availability)
- 16.2.3 Agropur Inc *List Not Exhaustive
- 16.2.3.1. Overview
- 16.2.3.2. Products
- 16.2.3.3. SWOT Analysis
- 16.2.3.4. Recent Developments
- 16.2.3.5. Financials (Based on Availability)
- 16.2.4 Royal FrieslandCampina NV
- 16.2.4.1. Overview
- 16.2.4.2. Products
- 16.2.4.3. SWOT Analysis
- 16.2.4.4. Recent Developments
- 16.2.4.5. Financials (Based on Availability)
- 16.2.5 Kerry Group
- 16.2.5.1. Overview
- 16.2.5.2. Products
- 16.2.5.3. SWOT Analysis
- 16.2.5.4. Recent Developments
- 16.2.5.5. Financials (Based on Availability)
- 16.2.6 Fonterra Co-operative Group Limited
- 16.2.6.1. Overview
- 16.2.6.2. Products
- 16.2.6.3. SWOT Analysis
- 16.2.6.4. Recent Developments
- 16.2.6.5. Financials (Based on Availability)
- 16.2.7 Milk Specialties Group
- 16.2.7.1. Overview
- 16.2.7.2. Products
- 16.2.7.3. SWOT Analysis
- 16.2.7.4. Recent Developments
- 16.2.7.5. Financials (Based on Availability)
- 16.2.8 Arla Foods Ingredients Group PS
- 16.2.8.1. Overview
- 16.2.8.2. Products
- 16.2.8.3. SWOT Analysis
- 16.2.8.4. Recent Developments
- 16.2.8.5. Financials (Based on Availability)
- 16.2.9 Glanbia PLC
- 16.2.9.1. Overview
- 16.2.9.2. Products
- 16.2.9.3. SWOT Analysis
- 16.2.9.4. Recent Developments
- 16.2.9.5. Financials (Based on Availability)
- 16.2.10 BASF SE
- 16.2.10.1. Overview
- 16.2.10.2. Products
- 16.2.10.3. SWOT Analysis
- 16.2.10.4. Recent Developments
- 16.2.10.5. Financials (Based on Availability)
- 16.2.1 AMCO Proteins
List of Figures
- Figure 1: Global Global Protein Hydrolysate Ingredients Market Revenue Breakdown (Million, %) by Region 2024 & 2032
- Figure 2: Global Global Protein Hydrolysate Ingredients Market Volume Breakdown (K Tons, %) by Region 2024 & 2032
- Figure 3: North America Global Protein Hydrolysate Ingredients Market Revenue (Million), by Country 2024 & 2032
- Figure 4: North America Global Protein Hydrolysate Ingredients Market Volume (K Tons), by Country 2024 & 2032
- Figure 5: North America Global Protein Hydrolysate Ingredients Market Revenue Share (%), by Country 2024 & 2032
- Figure 6: North America Global Protein Hydrolysate Ingredients Market Volume Share (%), by Country 2024 & 2032
- Figure 7: Europe Global Protein Hydrolysate Ingredients Market Revenue (Million), by Country 2024 & 2032
- Figure 8: Europe Global Protein Hydrolysate Ingredients Market Volume (K Tons), by Country 2024 & 2032
- Figure 9: Europe Global Protein Hydrolysate Ingredients Market Revenue Share (%), by Country 2024 & 2032
- Figure 10: Europe Global Protein Hydrolysate Ingredients Market Volume Share (%), by Country 2024 & 2032
- Figure 11: Asia Pacific Global Protein Hydrolysate Ingredients Market Revenue (Million), by Country 2024 & 2032
- Figure 12: Asia Pacific Global Protein Hydrolysate Ingredients Market Volume (K Tons), by Country 2024 & 2032
- Figure 13: Asia Pacific Global Protein Hydrolysate Ingredients Market Revenue Share (%), by Country 2024 & 2032
- Figure 14: Asia Pacific Global Protein Hydrolysate Ingredients Market Volume Share (%), by Country 2024 & 2032
- Figure 15: South America Global Protein Hydrolysate Ingredients Market Revenue (Million), by Country 2024 & 2032
- Figure 16: South America Global Protein Hydrolysate Ingredients Market Volume (K Tons), by Country 2024 & 2032
- Figure 17: South America Global Protein Hydrolysate Ingredients Market Revenue Share (%), by Country 2024 & 2032
- Figure 18: South America Global Protein Hydrolysate Ingredients Market Volume Share (%), by Country 2024 & 2032
- Figure 19: Middle East and Africa Global Protein Hydrolysate Ingredients Market Revenue (Million), by Country 2024 & 2032
- Figure 20: Middle East and Africa Global Protein Hydrolysate Ingredients Market Volume (K Tons), by Country 2024 & 2032
- Figure 21: Middle East and Africa Global Protein Hydrolysate Ingredients Market Revenue Share (%), by Country 2024 & 2032
- Figure 22: Middle East and Africa Global Protein Hydrolysate Ingredients Market Volume Share (%), by Country 2024 & 2032
- Figure 23: North America Global Protein Hydrolysate Ingredients Market Revenue (Million), by Type 2024 & 2032
- Figure 24: North America Global Protein Hydrolysate Ingredients Market Volume (K Tons), by Type 2024 & 2032
- Figure 25: North America Global Protein Hydrolysate Ingredients Market Revenue Share (%), by Type 2024 & 2032
- Figure 26: North America Global Protein Hydrolysate Ingredients Market Volume Share (%), by Type 2024 & 2032
- Figure 27: North America Global Protein Hydrolysate Ingredients Market Revenue (Million), by Application 2024 & 2032
- Figure 28: North America Global Protein Hydrolysate Ingredients Market Volume (K Tons), by Application 2024 & 2032
- Figure 29: North America Global Protein Hydrolysate Ingredients Market Revenue Share (%), by Application 2024 & 2032
- Figure 30: North America Global Protein Hydrolysate Ingredients Market Volume Share (%), by Application 2024 & 2032
- Figure 31: North America Global Protein Hydrolysate Ingredients Market Revenue (Million), by Country 2024 & 2032
- Figure 32: North America Global Protein Hydrolysate Ingredients Market Volume (K Tons), by Country 2024 & 2032
- Figure 33: North America Global Protein Hydrolysate Ingredients Market Revenue Share (%), by Country 2024 & 2032
- Figure 34: North America Global Protein Hydrolysate Ingredients Market Volume Share (%), by Country 2024 & 2032
- Figure 35: Europe Global Protein Hydrolysate Ingredients Market Revenue (Million), by Type 2024 & 2032
- Figure 36: Europe Global Protein Hydrolysate Ingredients Market Volume (K Tons), by Type 2024 & 2032
- Figure 37: Europe Global Protein Hydrolysate Ingredients Market Revenue Share (%), by Type 2024 & 2032
- Figure 38: Europe Global Protein Hydrolysate Ingredients Market Volume Share (%), by Type 2024 & 2032
- Figure 39: Europe Global Protein Hydrolysate Ingredients Market Revenue (Million), by Application 2024 & 2032
- Figure 40: Europe Global Protein Hydrolysate Ingredients Market Volume (K Tons), by Application 2024 & 2032
- Figure 41: Europe Global Protein Hydrolysate Ingredients Market Revenue Share (%), by Application 2024 & 2032
- Figure 42: Europe Global Protein Hydrolysate Ingredients Market Volume Share (%), by Application 2024 & 2032
- Figure 43: Europe Global Protein Hydrolysate Ingredients Market Revenue (Million), by Country 2024 & 2032
- Figure 44: Europe Global Protein Hydrolysate Ingredients Market Volume (K Tons), by Country 2024 & 2032
- Figure 45: Europe Global Protein Hydrolysate Ingredients Market Revenue Share (%), by Country 2024 & 2032
- Figure 46: Europe Global Protein Hydrolysate Ingredients Market Volume Share (%), by Country 2024 & 2032
- Figure 47: Asia Pacific Global Protein Hydrolysate Ingredients Market Revenue (Million), by Type 2024 & 2032
- Figure 48: Asia Pacific Global Protein Hydrolysate Ingredients Market Volume (K Tons), by Type 2024 & 2032
- Figure 49: Asia Pacific Global Protein Hydrolysate Ingredients Market Revenue Share (%), by Type 2024 & 2032
- Figure 50: Asia Pacific Global Protein Hydrolysate Ingredients Market Volume Share (%), by Type 2024 & 2032
- Figure 51: Asia Pacific Global Protein Hydrolysate Ingredients Market Revenue (Million), by Application 2024 & 2032
- Figure 52: Asia Pacific Global Protein Hydrolysate Ingredients Market Volume (K Tons), by Application 2024 & 2032
- Figure 53: Asia Pacific Global Protein Hydrolysate Ingredients Market Revenue Share (%), by Application 2024 & 2032
- Figure 54: Asia Pacific Global Protein Hydrolysate Ingredients Market Volume Share (%), by Application 2024 & 2032
- Figure 55: Asia Pacific Global Protein Hydrolysate Ingredients Market Revenue (Million), by Country 2024 & 2032
- Figure 56: Asia Pacific Global Protein Hydrolysate Ingredients Market Volume (K Tons), by Country 2024 & 2032
- Figure 57: Asia Pacific Global Protein Hydrolysate Ingredients Market Revenue Share (%), by Country 2024 & 2032
- Figure 58: Asia Pacific Global Protein Hydrolysate Ingredients Market Volume Share (%), by Country 2024 & 2032
- Figure 59: South America Global Protein Hydrolysate Ingredients Market Revenue (Million), by Type 2024 & 2032
- Figure 60: South America Global Protein Hydrolysate Ingredients Market Volume (K Tons), by Type 2024 & 2032
- Figure 61: South America Global Protein Hydrolysate Ingredients Market Revenue Share (%), by Type 2024 & 2032
- Figure 62: South America Global Protein Hydrolysate Ingredients Market Volume Share (%), by Type 2024 & 2032
- Figure 63: South America Global Protein Hydrolysate Ingredients Market Revenue (Million), by Application 2024 & 2032
- Figure 64: South America Global Protein Hydrolysate Ingredients Market Volume (K Tons), by Application 2024 & 2032
- Figure 65: South America Global Protein Hydrolysate Ingredients Market Revenue Share (%), by Application 2024 & 2032
- Figure 66: South America Global Protein Hydrolysate Ingredients Market Volume Share (%), by Application 2024 & 2032
- Figure 67: South America Global Protein Hydrolysate Ingredients Market Revenue (Million), by Country 2024 & 2032
- Figure 68: South America Global Protein Hydrolysate Ingredients Market Volume (K Tons), by Country 2024 & 2032
- Figure 69: South America Global Protein Hydrolysate Ingredients Market Revenue Share (%), by Country 2024 & 2032
- Figure 70: South America Global Protein Hydrolysate Ingredients Market Volume Share (%), by Country 2024 & 2032
- Figure 71: Middle East and Africa Global Protein Hydrolysate Ingredients Market Revenue (Million), by Type 2024 & 2032
- Figure 72: Middle East and Africa Global Protein Hydrolysate Ingredients Market Volume (K Tons), by Type 2024 & 2032
- Figure 73: Middle East and Africa Global Protein Hydrolysate Ingredients Market Revenue Share (%), by Type 2024 & 2032
- Figure 74: Middle East and Africa Global Protein Hydrolysate Ingredients Market Volume Share (%), by Type 2024 & 2032
- Figure 75: Middle East and Africa Global Protein Hydrolysate Ingredients Market Revenue (Million), by Application 2024 & 2032
- Figure 76: Middle East and Africa Global Protein Hydrolysate Ingredients Market Volume (K Tons), by Application 2024 & 2032
- Figure 77: Middle East and Africa Global Protein Hydrolysate Ingredients Market Revenue Share (%), by Application 2024 & 2032
- Figure 78: Middle East and Africa Global Protein Hydrolysate Ingredients Market Volume Share (%), by Application 2024 & 2032
- Figure 79: Middle East and Africa Global Protein Hydrolysate Ingredients Market Revenue (Million), by Country 2024 & 2032
- Figure 80: Middle East and Africa Global Protein Hydrolysate Ingredients Market Volume (K Tons), by Country 2024 & 2032
- Figure 81: Middle East and Africa Global Protein Hydrolysate Ingredients Market Revenue Share (%), by Country 2024 & 2032
- Figure 82: Middle East and Africa Global Protein Hydrolysate Ingredients Market Volume Share (%), by Country 2024 & 2032
List of Tables
- Table 1: Global Protein Hydrolysate Ingredients Market Revenue Million Forecast, by Region 2019 & 2032
- Table 2: Global Protein Hydrolysate Ingredients Market Volume K Tons Forecast, by Region 2019 & 2032
- Table 3: Global Protein Hydrolysate Ingredients Market Revenue Million Forecast, by Type 2019 & 2032
- Table 4: Global Protein Hydrolysate Ingredients Market Volume K Tons Forecast, by Type 2019 & 2032
- Table 5: Global Protein Hydrolysate Ingredients Market Revenue Million Forecast, by Application 2019 & 2032
- Table 6: Global Protein Hydrolysate Ingredients Market Volume K Tons Forecast, by Application 2019 & 2032
- Table 7: Global Protein Hydrolysate Ingredients Market Revenue Million Forecast, by Region 2019 & 2032
- Table 8: Global Protein Hydrolysate Ingredients Market Volume K Tons Forecast, by Region 2019 & 2032
- Table 9: Global Protein Hydrolysate Ingredients Market Revenue Million Forecast, by Country 2019 & 2032
- Table 10: Global Protein Hydrolysate Ingredients Market Volume K Tons Forecast, by Country 2019 & 2032
- Table 11: United States Global Protein Hydrolysate Ingredients Market Revenue (Million) Forecast, by Application 2019 & 2032
- Table 12: United States Global Protein Hydrolysate Ingredients Market Volume (K Tons) Forecast, by Application 2019 & 2032
- Table 13: Canada Global Protein Hydrolysate Ingredients Market Revenue (Million) Forecast, by Application 2019 & 2032
- Table 14: Canada Global Protein Hydrolysate Ingredients Market Volume (K Tons) Forecast, by Application 2019 & 2032
- Table 15: Mexico Global Protein Hydrolysate Ingredients Market Revenue (Million) Forecast, by Application 2019 & 2032
- Table 16: Mexico Global Protein Hydrolysate Ingredients Market Volume (K Tons) Forecast, by Application 2019 & 2032
- Table 17: Rest of North America Global Protein Hydrolysate Ingredients Market Revenue (Million) Forecast, by Application 2019 & 2032
- Table 18: Rest of North America Global Protein Hydrolysate Ingredients Market Volume (K Tons) Forecast, by Application 2019 & 2032
- Table 19: Global Protein Hydrolysate Ingredients Market Revenue Million Forecast, by Country 2019 & 2032
- Table 20: Global Protein Hydrolysate Ingredients Market Volume K Tons Forecast, by Country 2019 & 2032
- Table 21: Germany Global Protein Hydrolysate Ingredients Market Revenue (Million) Forecast, by Application 2019 & 2032
- Table 22: Germany Global Protein Hydrolysate Ingredients Market Volume (K Tons) Forecast, by Application 2019 & 2032
- Table 23: United Kingdom Global Protein Hydrolysate Ingredients Market Revenue (Million) Forecast, by Application 2019 & 2032
- Table 24: United Kingdom Global Protein Hydrolysate Ingredients Market Volume (K Tons) Forecast, by Application 2019 & 2032
- Table 25: Spain Global Protein Hydrolysate Ingredients Market Revenue (Million) Forecast, by Application 2019 & 2032
- Table 26: Spain Global Protein Hydrolysate Ingredients Market Volume (K Tons) Forecast, by Application 2019 & 2032
- Table 27: France Global Protein Hydrolysate Ingredients Market Revenue (Million) Forecast, by Application 2019 & 2032
- Table 28: France Global Protein Hydrolysate Ingredients Market Volume (K Tons) Forecast, by Application 2019 & 2032
- Table 29: Italy Global Protein Hydrolysate Ingredients Market Revenue (Million) Forecast, by Application 2019 & 2032
- Table 30: Italy Global Protein Hydrolysate Ingredients Market Volume (K Tons) Forecast, by Application 2019 & 2032
- Table 31: Rest of Europe Global Protein Hydrolysate Ingredients Market Revenue (Million) Forecast, by Application 2019 & 2032
- Table 32: Rest of Europe Global Protein Hydrolysate Ingredients Market Volume (K Tons) Forecast, by Application 2019 & 2032
- Table 33: Global Protein Hydrolysate Ingredients Market Revenue Million Forecast, by Country 2019 & 2032
- Table 34: Global Protein Hydrolysate Ingredients Market Volume K Tons Forecast, by Country 2019 & 2032
- Table 35: China Global Protein Hydrolysate Ingredients Market Revenue (Million) Forecast, by Application 2019 & 2032
- Table 36: China Global Protein Hydrolysate Ingredients Market Volume (K Tons) Forecast, by Application 2019 & 2032
- Table 37: Japan Global Protein Hydrolysate Ingredients Market Revenue (Million) Forecast, by Application 2019 & 2032
- Table 38: Japan Global Protein Hydrolysate Ingredients Market Volume (K Tons) Forecast, by Application 2019 & 2032
- Table 39: India Global Protein Hydrolysate Ingredients Market Revenue (Million) Forecast, by Application 2019 & 2032
- Table 40: India Global Protein Hydrolysate Ingredients Market Volume (K Tons) Forecast, by Application 2019 & 2032
- Table 41: Australia Global Protein Hydrolysate Ingredients Market Revenue (Million) Forecast, by Application 2019 & 2032
- Table 42: Australia Global Protein Hydrolysate Ingredients Market Volume (K Tons) Forecast, by Application 2019 & 2032
- Table 43: Rest of Asia Pacific Global Protein Hydrolysate Ingredients Market Revenue (Million) Forecast, by Application 2019 & 2032
- Table 44: Rest of Asia Pacific Global Protein Hydrolysate Ingredients Market Volume (K Tons) Forecast, by Application 2019 & 2032
- Table 45: Global Protein Hydrolysate Ingredients Market Revenue Million Forecast, by Country 2019 & 2032
- Table 46: Global Protein Hydrolysate Ingredients Market Volume K Tons Forecast, by Country 2019 & 2032
- Table 47: Brazil Global Protein Hydrolysate Ingredients Market Revenue (Million) Forecast, by Application 2019 & 2032
- Table 48: Brazil Global Protein Hydrolysate Ingredients Market Volume (K Tons) Forecast, by Application 2019 & 2032
- Table 49: Argentina Global Protein Hydrolysate Ingredients Market Revenue (Million) Forecast, by Application 2019 & 2032
- Table 50: Argentina Global Protein Hydrolysate Ingredients Market Volume (K Tons) Forecast, by Application 2019 & 2032
- Table 51: Rest of South America Global Protein Hydrolysate Ingredients Market Revenue (Million) Forecast, by Application 2019 & 2032
- Table 52: Rest of South America Global Protein Hydrolysate Ingredients Market Volume (K Tons) Forecast, by Application 2019 & 2032
- Table 53: Global Protein Hydrolysate Ingredients Market Revenue Million Forecast, by Country 2019 & 2032
- Table 54: Global Protein Hydrolysate Ingredients Market Volume K Tons Forecast, by Country 2019 & 2032
- Table 55: Saudi Arabia Global Protein Hydrolysate Ingredients Market Revenue (Million) Forecast, by Application 2019 & 2032
- Table 56: Saudi Arabia Global Protein Hydrolysate Ingredients Market Volume (K Tons) Forecast, by Application 2019 & 2032
- Table 57: South Africa Global Protein Hydrolysate Ingredients Market Revenue (Million) Forecast, by Application 2019 & 2032
- Table 58: South Africa Global Protein Hydrolysate Ingredients Market Volume (K Tons) Forecast, by Application 2019 & 2032
- Table 59: Rest of Middle East Global Protein Hydrolysate Ingredients Market Revenue (Million) Forecast, by Application 2019 & 2032
- Table 60: Rest of Middle East Global Protein Hydrolysate Ingredients Market Volume (K Tons) Forecast, by Application 2019 & 2032
- Table 61: Global Protein Hydrolysate Ingredients Market Revenue Million Forecast, by Type 2019 & 2032
- Table 62: Global Protein Hydrolysate Ingredients Market Volume K Tons Forecast, by Type 2019 & 2032
- Table 63: Global Protein Hydrolysate Ingredients Market Revenue Million Forecast, by Application 2019 & 2032
- Table 64: Global Protein Hydrolysate Ingredients Market Volume K Tons Forecast, by Application 2019 & 2032
- Table 65: Global Protein Hydrolysate Ingredients Market Revenue Million Forecast, by Country 2019 & 2032
- Table 66: Global Protein Hydrolysate Ingredients Market Volume K Tons Forecast, by Country 2019 & 2032
- Table 67: United States Global Protein Hydrolysate Ingredients Market Revenue (Million) Forecast, by Application 2019 & 2032
- Table 68: United States Global Protein Hydrolysate Ingredients Market Volume (K Tons) Forecast, by Application 2019 & 2032
- Table 69: Canada Global Protein Hydrolysate Ingredients Market Revenue (Million) Forecast, by Application 2019 & 2032
- Table 70: Canada Global Protein Hydrolysate Ingredients Market Volume (K Tons) Forecast, by Application 2019 & 2032
- Table 71: Mexico Global Protein Hydrolysate Ingredients Market Revenue (Million) Forecast, by Application 2019 & 2032
- Table 72: Mexico Global Protein Hydrolysate Ingredients Market Volume (K Tons) Forecast, by Application 2019 & 2032
- Table 73: Rest of North America Global Protein Hydrolysate Ingredients Market Revenue (Million) Forecast, by Application 2019 & 2032
- Table 74: Rest of North America Global Protein Hydrolysate Ingredients Market Volume (K Tons) Forecast, by Application 2019 & 2032
- Table 75: Global Protein Hydrolysate Ingredients Market Revenue Million Forecast, by Type 2019 & 2032
- Table 76: Global Protein Hydrolysate Ingredients Market Volume K Tons Forecast, by Type 2019 & 2032
- Table 77: Global Protein Hydrolysate Ingredients Market Revenue Million Forecast, by Application 2019 & 2032
- Table 78: Global Protein Hydrolysate Ingredients Market Volume K Tons Forecast, by Application 2019 & 2032
- Table 79: Global Protein Hydrolysate Ingredients Market Revenue Million Forecast, by Country 2019 & 2032
- Table 80: Global Protein Hydrolysate Ingredients Market Volume K Tons Forecast, by Country 2019 & 2032
- Table 81: Germany Global Protein Hydrolysate Ingredients Market Revenue (Million) Forecast, by Application 2019 & 2032
- Table 82: Germany Global Protein Hydrolysate Ingredients Market Volume (K Tons) Forecast, by Application 2019 & 2032
- Table 83: United Kingdom Global Protein Hydrolysate Ingredients Market Revenue (Million) Forecast, by Application 2019 & 2032
- Table 84: United Kingdom Global Protein Hydrolysate Ingredients Market Volume (K Tons) Forecast, by Application 2019 & 2032
- Table 85: Spain Global Protein Hydrolysate Ingredients Market Revenue (Million) Forecast, by Application 2019 & 2032
- Table 86: Spain Global Protein Hydrolysate Ingredients Market Volume (K Tons) Forecast, by Application 2019 & 2032
- Table 87: France Global Protein Hydrolysate Ingredients Market Revenue (Million) Forecast, by Application 2019 & 2032
- Table 88: France Global Protein Hydrolysate Ingredients Market Volume (K Tons) Forecast, by Application 2019 & 2032
- Table 89: Italy Global Protein Hydrolysate Ingredients Market Revenue (Million) Forecast, by Application 2019 & 2032
- Table 90: Italy Global Protein Hydrolysate Ingredients Market Volume (K Tons) Forecast, by Application 2019 & 2032
- Table 91: Rest of Europe Global Protein Hydrolysate Ingredients Market Revenue (Million) Forecast, by Application 2019 & 2032
- Table 92: Rest of Europe Global Protein Hydrolysate Ingredients Market Volume (K Tons) Forecast, by Application 2019 & 2032
- Table 93: Global Protein Hydrolysate Ingredients Market Revenue Million Forecast, by Type 2019 & 2032
- Table 94: Global Protein Hydrolysate Ingredients Market Volume K Tons Forecast, by Type 2019 & 2032
- Table 95: Global Protein Hydrolysate Ingredients Market Revenue Million Forecast, by Application 2019 & 2032
- Table 96: Global Protein Hydrolysate Ingredients Market Volume K Tons Forecast, by Application 2019 & 2032
- Table 97: Global Protein Hydrolysate Ingredients Market Revenue Million Forecast, by Country 2019 & 2032
- Table 98: Global Protein Hydrolysate Ingredients Market Volume K Tons Forecast, by Country 2019 & 2032
- Table 99: China Global Protein Hydrolysate Ingredients Market Revenue (Million) Forecast, by Application 2019 & 2032
- Table 100: China Global Protein Hydrolysate Ingredients Market Volume (K Tons) Forecast, by Application 2019 & 2032
- Table 101: Japan Global Protein Hydrolysate Ingredients Market Revenue (Million) Forecast, by Application 2019 & 2032
- Table 102: Japan Global Protein Hydrolysate Ingredients Market Volume (K Tons) Forecast, by Application 2019 & 2032
- Table 103: India Global Protein Hydrolysate Ingredients Market Revenue (Million) Forecast, by Application 2019 & 2032
- Table 104: India Global Protein Hydrolysate Ingredients Market Volume (K Tons) Forecast, by Application 2019 & 2032
- Table 105: Australia Global Protein Hydrolysate Ingredients Market Revenue (Million) Forecast, by Application 2019 & 2032
- Table 106: Australia Global Protein Hydrolysate Ingredients Market Volume (K Tons) Forecast, by Application 2019 & 2032
- Table 107: Rest of Asia Pacific Global Protein Hydrolysate Ingredients Market Revenue (Million) Forecast, by Application 2019 & 2032
- Table 108: Rest of Asia Pacific Global Protein Hydrolysate Ingredients Market Volume (K Tons) Forecast, by Application 2019 & 2032
- Table 109: Global Protein Hydrolysate Ingredients Market Revenue Million Forecast, by Type 2019 & 2032
- Table 110: Global Protein Hydrolysate Ingredients Market Volume K Tons Forecast, by Type 2019 & 2032
- Table 111: Global Protein Hydrolysate Ingredients Market Revenue Million Forecast, by Application 2019 & 2032
- Table 112: Global Protein Hydrolysate Ingredients Market Volume K Tons Forecast, by Application 2019 & 2032
- Table 113: Global Protein Hydrolysate Ingredients Market Revenue Million Forecast, by Country 2019 & 2032
- Table 114: Global Protein Hydrolysate Ingredients Market Volume K Tons Forecast, by Country 2019 & 2032
- Table 115: Brazil Global Protein Hydrolysate Ingredients Market Revenue (Million) Forecast, by Application 2019 & 2032
- Table 116: Brazil Global Protein Hydrolysate Ingredients Market Volume (K Tons) Forecast, by Application 2019 & 2032
- Table 117: Argentina Global Protein Hydrolysate Ingredients Market Revenue (Million) Forecast, by Application 2019 & 2032
- Table 118: Argentina Global Protein Hydrolysate Ingredients Market Volume (K Tons) Forecast, by Application 2019 & 2032
- Table 119: Rest of South America Global Protein Hydrolysate Ingredients Market Revenue (Million) Forecast, by Application 2019 & 2032
- Table 120: Rest of South America Global Protein Hydrolysate Ingredients Market Volume (K Tons) Forecast, by Application 2019 & 2032
- Table 121: Global Protein Hydrolysate Ingredients Market Revenue Million Forecast, by Type 2019 & 2032
- Table 122: Global Protein Hydrolysate Ingredients Market Volume K Tons Forecast, by Type 2019 & 2032
- Table 123: Global Protein Hydrolysate Ingredients Market Revenue Million Forecast, by Application 2019 & 2032
- Table 124: Global Protein Hydrolysate Ingredients Market Volume K Tons Forecast, by Application 2019 & 2032
- Table 125: Global Protein Hydrolysate Ingredients Market Revenue Million Forecast, by Country 2019 & 2032
- Table 126: Global Protein Hydrolysate Ingredients Market Volume K Tons Forecast, by Country 2019 & 2032
- Table 127: Saudi Arabia Global Protein Hydrolysate Ingredients Market Revenue (Million) Forecast, by Application 2019 & 2032
- Table 128: Saudi Arabia Global Protein Hydrolysate Ingredients Market Volume (K Tons) Forecast, by Application 2019 & 2032
- Table 129: South Africa Global Protein Hydrolysate Ingredients Market Revenue (Million) Forecast, by Application 2019 & 2032
- Table 130: South Africa Global Protein Hydrolysate Ingredients Market Volume (K Tons) Forecast, by Application 2019 & 2032
- Table 131: Rest of Middle East Global Protein Hydrolysate Ingredients Market Revenue (Million) Forecast, by Application 2019 & 2032
- Table 132: Rest of Middle East Global Protein Hydrolysate Ingredients Market Volume (K Tons) Forecast, by Application 2019 & 2032
Frequently Asked Questions
1. What is the projected Compound Annual Growth Rate (CAGR) of the Global Protein Hydrolysate Ingredients Market?
The projected CAGR is approximately 8.26%.
2. Which companies are prominent players in the Global Protein Hydrolysate Ingredients Market?
Key companies in the market include AMCO Proteins, Tate & Lyle PLC, Agropur Inc *List Not Exhaustive, Royal FrieslandCampina NV, Kerry Group, Fonterra Co-operative Group Limited, Milk Specialties Group, Arla Foods Ingredients Group PS, Glanbia PLC, BASF SE.
3. What are the main segments of the Global Protein Hydrolysate Ingredients Market?
The market segments include Type, Application.
4. Can you provide details about the market size?
The market size is estimated to be USD 3500 Million as of 2022.
5. What are some drivers contributing to market growth?
Increasing Demand For Baby Food and Infant Formula; Growing Application of Casein and Caseinates in Protein-rich Food Products.
6. What are the notable trends driving market growth?
Growing Influence Of Healthy Lifestyle Trends And Rising Non-traditional Users.
7. Are there any restraints impacting market growth?
Increasing Manufacturing Costs and Raw Materials Price Hamper the Market Growth.
8. Can you provide examples of recent developments in the market?
In 2021, AMCO Proteins acquired Proliant Health, a leading manufacturer of plant-based protein ingredients.
9. What pricing options are available for accessing the report?
Pricing options include single-user, multi-user, and enterprise licenses priced at USD 4750, USD 5250, and USD 8750 respectively.
10. Is the market size provided in terms of value or volume?
The market size is provided in terms of value, measured in Million and volume, measured in K Tons.
11. Are there any specific market keywords associated with the report?
Yes, the market keyword associated with the report is "Global Protein Hydrolysate Ingredients Market," which aids in identifying and referencing the specific market segment covered.
12. How do I determine which pricing option suits my needs best?
The pricing options vary based on user requirements and access needs. Individual users may opt for single-user licenses, while businesses requiring broader access may choose multi-user or enterprise licenses for cost-effective access to the report.
13. Are there any additional resources or data provided in the Global Protein Hydrolysate Ingredients Market report?
While the report offers comprehensive insights, it's advisable to review the specific contents or supplementary materials provided to ascertain if additional resources or data are available.
14. How can I stay updated on further developments or reports in the Global Protein Hydrolysate Ingredients Market?
To stay informed about further developments, trends, and reports in the Global Protein Hydrolysate Ingredients Market, consider subscribing to industry newsletters, following relevant companies and organizations, or regularly checking reputable industry news sources and publications.
Methodology
Step 1 - Identification of Relevant Samples Size from Population Database


Step 2 - Approaches for Defining Global Market Size (Value, Volume* & Price*)

Note*: In applicable scenarios
Step 3 - Data Sources
Primary Research
- Web Analytics
- Survey Reports
- Research Institute
- Latest Research Reports
- Opinion Leaders
Secondary Research
- Annual Reports
- White Paper
- Latest Press Release
- Industry Association
- Paid Database
- Investor Presentations

Step 4 - Data Triangulation
Involves using different sources of information in order to increase the validity of a study
These sources are likely to be stakeholders in a program - participants, other researchers, program staff, other community members, and so on.
Then we put all data in single framework & apply various statistical tools to find out the dynamic on the market.
During the analysis stage, feedback from the stakeholder groups would be compared to determine areas of agreement as well as areas of divergence


