

Key Insights
The global sour milk drinks market, valued at $9.03 billion in 2025, is projected for robust expansion. Driven by escalating consumer preference for healthful and functional beverages, the market is anticipated to grow at a Compound Annual Growth Rate (CAGR) of 5.19% from 2025 to 2033. Key growth drivers include heightened health consciousness, with consumers actively seeking probiotic-rich, high-protein alternatives to conventional sugary drinks. The increasing popularity of kefir, yogurt, and buttermilk, particularly among health-aware demographics, significantly fuels market growth. Product diversification, featuring flavored and specialized sour milk drinks catering to specific dietary needs like lactose-free options, further stimulates expansion. The market is segmented by product type (kefir, buttermilk, sour cream, yogurt, Laban), distribution channel (off-trade, on-trade), and end-use (household, foodservice, retail). Regional preferences and evolving food consumption trends will influence the prominence of specific product types and distribution channels. The on-trade segment, including cafes, restaurants, and bars, presents promising growth opportunities with anticipated increased demand for sour milk drinks in menu offerings. Competitive strategies involve established multinational corporations and regional dairy producers, each targeting distinct market segments and geographies. Product innovation and strategic marketing emphasizing health benefits are crucial for success in this expanding market.
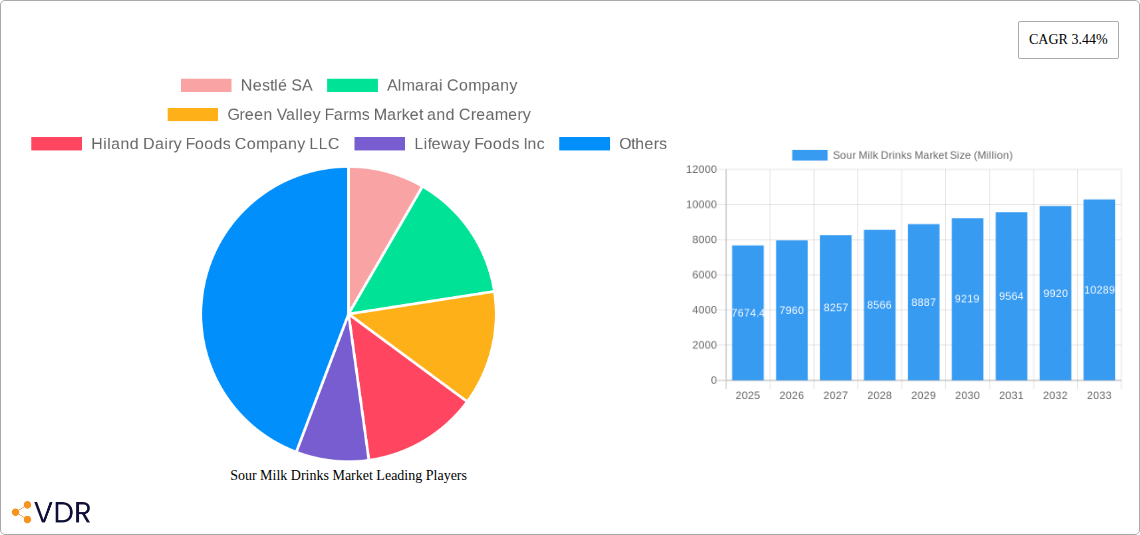
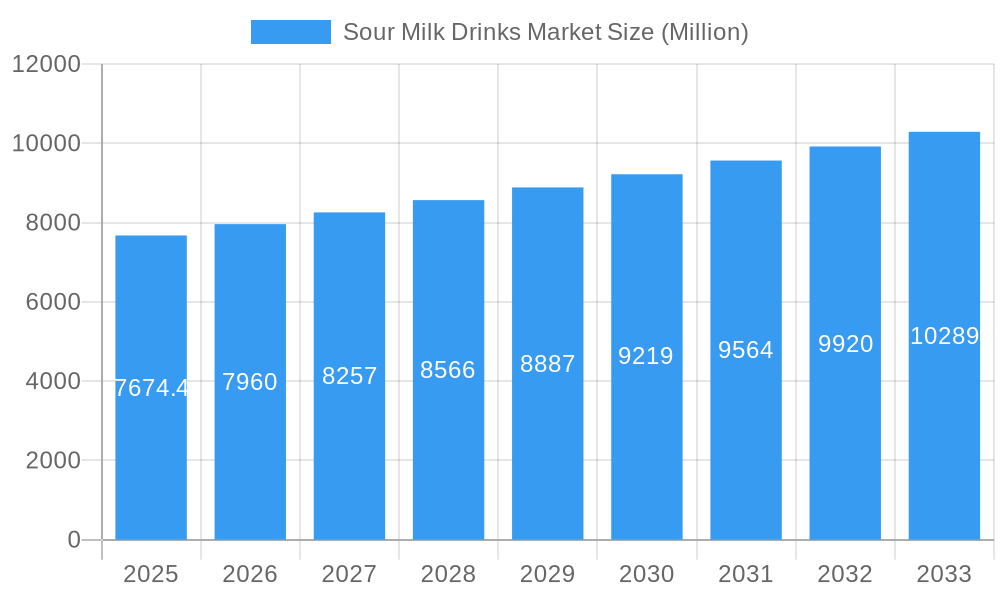
Sour Milk Drinks Market Market Size (In Billion)
Regional market dynamics are shaped by diverse consumer preferences and consumption patterns. North America and Europe are expected to maintain their significant market share due to established consumer bases and high per capita dairy consumption. However, the Asia-Pacific region offers substantial growth potential, driven by rising disposable incomes and increased awareness of the nutritional benefits of sour milk drinks. The Middle East and Africa region also presents expansion opportunities, albeit with potentially lower initial penetration rates compared to more mature markets. Sustained growth will hinge on factors such as competitive pricing, efficient supply chain management, and effectively addressing consumer concerns regarding sugar content and lactose intolerance. Companies prioritizing sustainability and ethical sourcing practices are likely to gain a competitive advantage, aligning with growing consumer interest in responsible consumption.
Sour Milk Drinks Market Company Market Share
Sour Milk Drinks Market: A Comprehensive Report (2019-2033)
This comprehensive report provides an in-depth analysis of the global Sour Milk Drinks market, encompassing market dynamics, growth trends, regional dominance, product landscape, key players, and future outlook. The study covers the historical period (2019-2024), base year (2025), and forecast period (2025-2033), offering invaluable insights for industry professionals, investors, and strategic decision-makers. The market is segmented by product type (kefir, buttermilk, sour cream, yogurt, laban), distribution channel (off-trade, on-trade), and end-use (household, foodservice, retail). The total market size is projected to reach xx Million units by 2033.
Sour Milk Drinks Market Dynamics & Structure
The sour milk drinks market is characterized by a moderately concentrated landscape, with key players such as Nestlé SA, Almarai Company, and Lifeway Foods Inc. holding significant market share. Technological advancements in fermentation processes, packaging, and product diversification are driving market growth. Stringent regulatory frameworks concerning food safety and labeling influence product development and market access. Competitive substitutes, such as plant-based alternatives, present challenges but also opportunities for innovation. Consumer preferences, particularly towards healthier and functional foods, are shifting market demand. The historical period witnessed several M&A activities, with an estimated xx number of deals, primarily focused on expanding product portfolios and geographical reach.
- Market Concentration: Moderately concentrated, with top 5 players holding approximately xx% market share in 2024.
- Technological Innovation: Focus on enhanced shelf-life, improved flavor profiles, and functional benefits (probiotics).
- Regulatory Landscape: Stringent food safety regulations and labeling requirements vary across regions.
- Competitive Substitutes: Plant-based alternatives and other fermented beverages pose competition.
- End-User Demographics: Growing demand from health-conscious consumers and evolving dietary habits.
- M&A Activity: xx M&A deals during 2019-2024, primarily for expansion and diversification.
Sour Milk Drinks Market Growth Trends & Insights
The global sour milk drinks market experienced a CAGR of xx% during 2019-2024, driven by increasing consumer awareness of the health benefits associated with probiotics and fermented dairy products. Market penetration is highest in developed regions, while emerging economies present significant growth opportunities. Technological disruptions, such as advancements in packaging and distribution, are enhancing product accessibility. Shifting consumer preferences towards convenient, on-the-go options and personalized nutrition are influencing product development and marketing strategies. The market is expected to maintain a robust growth trajectory, with a projected CAGR of xx% during 2025-2033, reaching xx Million units by 2033.
Dominant Regions, Countries, or Segments in Sour Milk Drinks Market
North America currently holds the largest market share in the sour milk drinks market, driven by high consumption rates of yogurt and kefir, and a strong preference for functional foods. Europe also demonstrates significant market presence, with established dairy industries and high consumer demand. Within product types, yogurt holds the largest market share, followed by kefir and buttermilk. The off-trade distribution channel dominates, reflecting the popularity of sour milk drinks in supermarkets and retail stores. The household end-use segment represents the largest market share, though foodservice applications are witnessing growth.
- Key Drivers (North America): High disposable incomes, health-conscious consumers, strong retail infrastructure.
- Key Drivers (Europe): Established dairy industry, diverse product offerings, high consumer awareness of probiotics.
- Dominant Product Type: Yogurt (xx% market share in 2024).
- Dominant Distribution Channel: Off-trade (xx% market share in 2024).
- Dominant End-Use: Household (xx% market share in 2024).
Sour Milk Drinks Market Product Landscape
Product innovation in the sour milk drinks market focuses on enhancing taste, texture, and functional benefits. New product launches emphasize natural ingredients, unique flavor combinations, and increased probiotic content. Manufacturers are investing in advanced packaging technologies to extend shelf life and maintain product freshness. Key performance metrics include consumer acceptance, shelf life, and probiotic viability. Unique selling propositions often highlight health benefits, such as improved gut health and immunity boost.
Key Drivers, Barriers & Challenges in Sour Milk Drinks Market
Key Drivers: Growing consumer demand for healthy and functional foods, increasing awareness of probiotic benefits, and expansion of distribution channels. Technological advancements in fermentation and packaging further contribute to market expansion.
Key Challenges: Fluctuations in raw material prices, intense competition from plant-based alternatives, and stringent regulatory requirements can impact market growth. Supply chain disruptions, particularly concerning dairy raw materials, represent a significant challenge. The competitive landscape also poses a significant threat, requiring companies to continuously innovate and differentiate their product offerings.
Emerging Opportunities in Sour Milk Drinks Market
Emerging opportunities include the expansion into untapped markets, particularly in developing economies, and the development of innovative products catering to specific dietary needs or preferences, such as organic, lactose-free, and plant-based options. Personalized nutrition and targeted health benefits, utilizing specific probiotic strains, represent further areas for growth. The development of new flavor profiles and convenient packaging options are also driving market expansion.
Growth Accelerators in the Sour Milk Drinks Market Industry
Strategic partnerships and collaborations, particularly among dairy producers and health food companies, are accelerating market growth. Technological breakthroughs in fermentation technologies and packaging innovations are enhancing product quality and extending shelf life. Expansion into new geographical markets and the development of niche product segments are also driving market expansion.
Key Players Shaping the Sour Milk Drinks Market Market
- Nestlé SA
- Almarai Company
- Green Valley Farms Market and Creamery
- Hiland Dairy Foods Company LLC
- Lifeway Foods Inc
- Dairy Farmers of America Inc
- Producers Dairy Foods Inc (Umpqua Dairy)
- Gujarat Co-operative Milk Marketing Federation Ltd
Notable Milestones in Sour Milk Drinks Market Sector
- July 2022: Gujarat Co-operative Milk Marketing Federation Ltd. invested USD 60 Million in a new dairy plant in Rajkot to expand its milk, curd, and buttermilk product lines.
- August 2021: Lifeway Foods Inc. expanded its kefir distribution to the Irish market through Tesco.
- July 2021: Lifeway Foods Inc. expanded its kefir distribution to the French market through Costco France.
In-Depth Sour Milk Drinks Market Market Outlook
The sour milk drinks market is poised for continued growth, driven by evolving consumer preferences, technological advancements, and strategic market expansion. Opportunities exist in developing innovative products, leveraging functional benefits, and penetrating new markets. Strategic partnerships and investments in research and development will be crucial for companies to maintain a competitive edge and capitalize on future growth prospects. The market is expected to show continued robust growth, exceeding xx Million units by 2033, driven by the increasing demand for healthy and convenient food options.
Sour Milk Drinks Market Segmentation
-
1. Distribution Channel
-
1.1. Off-Trade
- 1.1.1. Convenience Stores
- 1.1.2. Online Retail
- 1.1.3. Specialist Retailers
- 1.1.4. Supermarkets and Hypermarkets
- 1.1.5. Others (Warehouse clubs, gas stations, etc.)
- 1.2. On-Trade
-
1.1. Off-Trade
Sour Milk Drinks Market Segmentation By Geography
-
1. North America
- 1.1. United States
- 1.2. Canada
- 1.3. Mexico
-
2. South America
- 2.1. Brazil
- 2.2. Argentina
- 2.3. Rest of South America
-
3. Europe
- 3.1. United Kingdom
- 3.2. Germany
- 3.3. France
- 3.4. Italy
- 3.5. Spain
- 3.6. Russia
- 3.7. Benelux
- 3.8. Nordics
- 3.9. Rest of Europe
-
4. Middle East & Africa
- 4.1. Turkey
- 4.2. Israel
- 4.3. GCC
- 4.4. North Africa
- 4.5. South Africa
- 4.6. Rest of Middle East & Africa
-
5. Asia Pacific
- 5.1. China
- 5.2. India
- 5.3. Japan
- 5.4. South Korea
- 5.5. ASEAN
- 5.6. Oceania
- 5.7. Rest of Asia Pacific
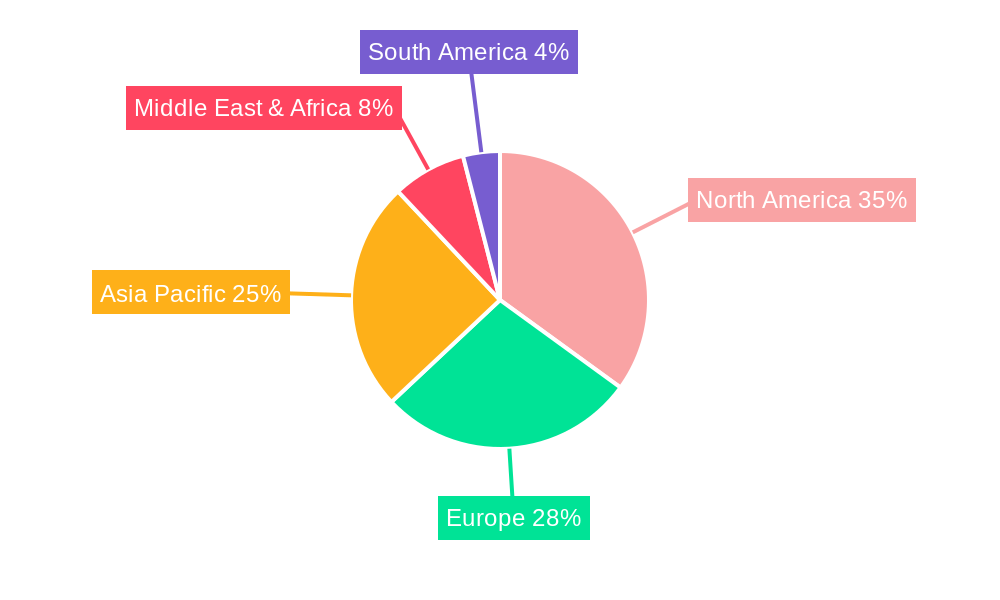
Sour Milk Drinks Market Regional Market Share
Geographic Coverage of Sour Milk Drinks Market
Sour Milk Drinks Market REPORT HIGHLIGHTS
| Aspects | Details |
|---|---|
| Study Period | 2020-2034 |
| Base Year | 2025 |
| Estimated Year | 2026 |
| Forecast Period | 2026-2034 |
| Historical Period | 2020-2025 |
| Growth Rate | CAGR of 5.19% from 2020-2034 |
| Segmentation |
|
Table of Contents
- 1. Introduction
- 1.1. Research Scope
- 1.2. Market Segmentation
- 1.3. Research Objective
- 1.4. Definitions and Assumptions
- 2. Executive Summary
- 2.1. Market Snapshot
- 3. Market Dynamics
- 3.1. Market Drivers
- 3.2. Market Restrains
- 3.3. Market Trends
- 3.4. Market Opportunities
- 4. Market Factor Analysis
- 4.1. Porters Five Forces
- 4.1.1. Bargaining Power of Suppliers
- 4.1.2. Bargaining Power of Buyers
- 4.1.3. Threat of New Entrants
- 4.1.4. Threat of Substitutes
- 4.1.5. Competitive Rivalry
- 4.2. PESTEL analysis
- 4.3. BCG Analysis
- 4.3.1. Stars (High Growth, High Market Share)
- 4.3.2. Cash Cows (Low Growth, High Market Share)
- 4.3.3. Question Mark (High Growth, Low Market Share)
- 4.3.4. Dogs (Low Growth, Low Market Share)
- 4.4. Ansoff Matrix Analysis
- 4.5. Supply Chain Analysis
- 4.6. Regulatory Landscape
- 4.7. Current Market Potential and Opportunity Assessment (TAM–SAM–SOM Framework)
- 4.8. VDR Analyst Note
- 4.1. Porters Five Forces
- 5. Market Analysis, Insights and Forecast 2021-2033
- 5.1. Market Analysis, Insights and Forecast - by Distribution Channel
- 5.1.1. Off-Trade
- 5.1.1.1. Convenience Stores
- 5.1.1.2. Online Retail
- 5.1.1.3. Specialist Retailers
- 5.1.1.4. Supermarkets and Hypermarkets
- 5.1.1.5. Others (Warehouse clubs, gas stations, etc.)
- 5.1.2. On-Trade
- 5.1.1. Off-Trade
- 5.2. Market Analysis, Insights and Forecast - by Region
- 5.2.1. North America
- 5.2.2. South America
- 5.2.3. Europe
- 5.2.4. Middle East & Africa
- 5.2.5. Asia Pacific
- 5.1. Market Analysis, Insights and Forecast - by Distribution Channel
- 6. Global Sour Milk Drinks Market Analysis, Insights and Forecast, 2021-2033
- 6.1. Market Analysis, Insights and Forecast - by Distribution Channel
- 6.1.1. Off-Trade
- 6.1.1.1. Convenience Stores
- 6.1.1.2. Online Retail
- 6.1.1.3. Specialist Retailers
- 6.1.1.4. Supermarkets and Hypermarkets
- 6.1.1.5. Others (Warehouse clubs, gas stations, etc.)
- 6.1.2. On-Trade
- 6.1.1. Off-Trade
- 6.1. Market Analysis, Insights and Forecast - by Distribution Channel
- 7. North America Sour Milk Drinks Market Analysis, Insights and Forecast, 2021-2033
- 7.1. Market Analysis, Insights and Forecast - by Distribution Channel
- 7.1.1. Off-Trade
- 7.1.1.1. Convenience Stores
- 7.1.1.2. Online Retail
- 7.1.1.3. Specialist Retailers
- 7.1.1.4. Supermarkets and Hypermarkets
- 7.1.1.5. Others (Warehouse clubs, gas stations, etc.)
- 7.1.2. On-Trade
- 7.1.1. Off-Trade
- 7.1. Market Analysis, Insights and Forecast - by Distribution Channel
- 8. South America Sour Milk Drinks Market Analysis, Insights and Forecast, 2021-2033
- 8.1. Market Analysis, Insights and Forecast - by Distribution Channel
- 8.1.1. Off-Trade
- 8.1.1.1. Convenience Stores
- 8.1.1.2. Online Retail
- 8.1.1.3. Specialist Retailers
- 8.1.1.4. Supermarkets and Hypermarkets
- 8.1.1.5. Others (Warehouse clubs, gas stations, etc.)
- 8.1.2. On-Trade
- 8.1.1. Off-Trade
- 8.1. Market Analysis, Insights and Forecast - by Distribution Channel
- 9. Europe Sour Milk Drinks Market Analysis, Insights and Forecast, 2021-2033
- 9.1. Market Analysis, Insights and Forecast - by Distribution Channel
- 9.1.1. Off-Trade
- 9.1.1.1. Convenience Stores
- 9.1.1.2. Online Retail
- 9.1.1.3. Specialist Retailers
- 9.1.1.4. Supermarkets and Hypermarkets
- 9.1.1.5. Others (Warehouse clubs, gas stations, etc.)
- 9.1.2. On-Trade
- 9.1.1. Off-Trade
- 9.1. Market Analysis, Insights and Forecast - by Distribution Channel
- 10. Middle East & Africa Sour Milk Drinks Market Analysis, Insights and Forecast, 2021-2033
- 10.1. Market Analysis, Insights and Forecast - by Distribution Channel
- 10.1.1. Off-Trade
- 10.1.1.1. Convenience Stores
- 10.1.1.2. Online Retail
- 10.1.1.3. Specialist Retailers
- 10.1.1.4. Supermarkets and Hypermarkets
- 10.1.1.5. Others (Warehouse clubs, gas stations, etc.)
- 10.1.2. On-Trade
- 10.1.1. Off-Trade
- 10.1. Market Analysis, Insights and Forecast - by Distribution Channel
- 11. Asia Pacific Sour Milk Drinks Market Analysis, Insights and Forecast, 2021-2033
- 11.1. Market Analysis, Insights and Forecast - by Distribution Channel
- 11.1.1. Off-Trade
- 11.1.1.1. Convenience Stores
- 11.1.1.2. Online Retail
- 11.1.1.3. Specialist Retailers
- 11.1.1.4. Supermarkets and Hypermarkets
- 11.1.1.5. Others (Warehouse clubs, gas stations, etc.)
- 11.1.2. On-Trade
- 11.1.1. Off-Trade
- 11.1. Market Analysis, Insights and Forecast - by Distribution Channel
- 12. Competitive Analysis
- 12.1. Company Profiles
- 12.1.1 Nestlé SA
- 12.1.1.1. Company Overview
- 12.1.1.2. Products
- 12.1.1.3. Company Financials
- 12.1.1.4. SWOT Analysis
- 12.1.2 Almarai Company
- 12.1.2.1. Company Overview
- 12.1.2.2. Products
- 12.1.2.3. Company Financials
- 12.1.2.4. SWOT Analysis
- 12.1.3 Green Valley Farms Market and Creamery
- 12.1.3.1. Company Overview
- 12.1.3.2. Products
- 12.1.3.3. Company Financials
- 12.1.3.4. SWOT Analysis
- 12.1.4 Hiland Dairy Foods Company LLC
- 12.1.4.1. Company Overview
- 12.1.4.2. Products
- 12.1.4.3. Company Financials
- 12.1.4.4. SWOT Analysis
- 12.1.5 Lifeway Foods Inc
- 12.1.5.1. Company Overview
- 12.1.5.2. Products
- 12.1.5.3. Company Financials
- 12.1.5.4. SWOT Analysis
- 12.1.6 Dairy Farmers of America Inc
- 12.1.6.1. Company Overview
- 12.1.6.2. Products
- 12.1.6.3. Company Financials
- 12.1.6.4. SWOT Analysis
- 12.1.7 Producers Dairy Foods Inc (Umpqua Dairy
- 12.1.7.1. Company Overview
- 12.1.7.2. Products
- 12.1.7.3. Company Financials
- 12.1.7.4. SWOT Analysis
- 12.1.8 Gujarat Co-operative Milk Marketing Federation Ltd
- 12.1.8.1. Company Overview
- 12.1.8.2. Products
- 12.1.8.3. Company Financials
- 12.1.8.4. SWOT Analysis
- 12.1.1 Nestlé SA
- 12.2. Market Entropy
- 12.2.1 Company's Key Areas Served
- 12.2.2 Recent Developments
- 12.3. Company Market Share Analysis 2025
- 12.3.1 Top 5 Companies Market Share Analysis
- 12.3.2 Top 3 Companies Market Share Analysis
- 12.4. List of Potential Customers
- 13. Research Methodology
List of Figures
- Figure 1: Global Sour Milk Drinks Market Revenue Breakdown (billion, %) by Region 2025 & 2033
- Figure 2: Global Sour Milk Drinks Market Volume Breakdown (Liters, %) by Region 2025 & 2033
- Figure 3: North America Sour Milk Drinks Market Revenue (billion), by Distribution Channel 2025 & 2033
- Figure 4: North America Sour Milk Drinks Market Volume (Liters), by Distribution Channel 2025 & 2033
- Figure 5: North America Sour Milk Drinks Market Revenue Share (%), by Distribution Channel 2025 & 2033
- Figure 6: North America Sour Milk Drinks Market Volume Share (%), by Distribution Channel 2025 & 2033
- Figure 7: North America Sour Milk Drinks Market Revenue (billion), by Country 2025 & 2033
- Figure 8: North America Sour Milk Drinks Market Volume (Liters), by Country 2025 & 2033
- Figure 9: North America Sour Milk Drinks Market Revenue Share (%), by Country 2025 & 2033
- Figure 10: North America Sour Milk Drinks Market Volume Share (%), by Country 2025 & 2033
- Figure 11: South America Sour Milk Drinks Market Revenue (billion), by Distribution Channel 2025 & 2033
- Figure 12: South America Sour Milk Drinks Market Volume (Liters), by Distribution Channel 2025 & 2033
- Figure 13: South America Sour Milk Drinks Market Revenue Share (%), by Distribution Channel 2025 & 2033
- Figure 14: South America Sour Milk Drinks Market Volume Share (%), by Distribution Channel 2025 & 2033
- Figure 15: South America Sour Milk Drinks Market Revenue (billion), by Country 2025 & 2033
- Figure 16: South America Sour Milk Drinks Market Volume (Liters), by Country 2025 & 2033
- Figure 17: South America Sour Milk Drinks Market Revenue Share (%), by Country 2025 & 2033
- Figure 18: South America Sour Milk Drinks Market Volume Share (%), by Country 2025 & 2033
- Figure 19: Europe Sour Milk Drinks Market Revenue (billion), by Distribution Channel 2025 & 2033
- Figure 20: Europe Sour Milk Drinks Market Volume (Liters), by Distribution Channel 2025 & 2033
- Figure 21: Europe Sour Milk Drinks Market Revenue Share (%), by Distribution Channel 2025 & 2033
- Figure 22: Europe Sour Milk Drinks Market Volume Share (%), by Distribution Channel 2025 & 2033
- Figure 23: Europe Sour Milk Drinks Market Revenue (billion), by Country 2025 & 2033
- Figure 24: Europe Sour Milk Drinks Market Volume (Liters), by Country 2025 & 2033
- Figure 25: Europe Sour Milk Drinks Market Revenue Share (%), by Country 2025 & 2033
- Figure 26: Europe Sour Milk Drinks Market Volume Share (%), by Country 2025 & 2033
- Figure 27: Middle East & Africa Sour Milk Drinks Market Revenue (billion), by Distribution Channel 2025 & 2033
- Figure 28: Middle East & Africa Sour Milk Drinks Market Volume (Liters), by Distribution Channel 2025 & 2033
- Figure 29: Middle East & Africa Sour Milk Drinks Market Revenue Share (%), by Distribution Channel 2025 & 2033
- Figure 30: Middle East & Africa Sour Milk Drinks Market Volume Share (%), by Distribution Channel 2025 & 2033
- Figure 31: Middle East & Africa Sour Milk Drinks Market Revenue (billion), by Country 2025 & 2033
- Figure 32: Middle East & Africa Sour Milk Drinks Market Volume (Liters), by Country 2025 & 2033
- Figure 33: Middle East & Africa Sour Milk Drinks Market Revenue Share (%), by Country 2025 & 2033
- Figure 34: Middle East & Africa Sour Milk Drinks Market Volume Share (%), by Country 2025 & 2033
- Figure 35: Asia Pacific Sour Milk Drinks Market Revenue (billion), by Distribution Channel 2025 & 2033
- Figure 36: Asia Pacific Sour Milk Drinks Market Volume (Liters), by Distribution Channel 2025 & 2033
- Figure 37: Asia Pacific Sour Milk Drinks Market Revenue Share (%), by Distribution Channel 2025 & 2033
- Figure 38: Asia Pacific Sour Milk Drinks Market Volume Share (%), by Distribution Channel 2025 & 2033
- Figure 39: Asia Pacific Sour Milk Drinks Market Revenue (billion), by Country 2025 & 2033
- Figure 40: Asia Pacific Sour Milk Drinks Market Volume (Liters), by Country 2025 & 2033
- Figure 41: Asia Pacific Sour Milk Drinks Market Revenue Share (%), by Country 2025 & 2033
- Figure 42: Asia Pacific Sour Milk Drinks Market Volume Share (%), by Country 2025 & 2033
List of Tables
- Table 1: Global Sour Milk Drinks Market Revenue billion Forecast, by Distribution Channel 2020 & 2033
- Table 2: Global Sour Milk Drinks Market Volume Liters Forecast, by Distribution Channel 2020 & 2033
- Table 3: Global Sour Milk Drinks Market Revenue billion Forecast, by Region 2020 & 2033
- Table 4: Global Sour Milk Drinks Market Volume Liters Forecast, by Region 2020 & 2033
- Table 5: Global Sour Milk Drinks Market Revenue billion Forecast, by Distribution Channel 2020 & 2033
- Table 6: Global Sour Milk Drinks Market Volume Liters Forecast, by Distribution Channel 2020 & 2033
- Table 7: Global Sour Milk Drinks Market Revenue billion Forecast, by Country 2020 & 2033
- Table 8: Global Sour Milk Drinks Market Volume Liters Forecast, by Country 2020 & 2033
- Table 9: United States Sour Milk Drinks Market Revenue (billion) Forecast, by Application 2020 & 2033
- Table 10: United States Sour Milk Drinks Market Volume (Liters) Forecast, by Application 2020 & 2033
- Table 11: Canada Sour Milk Drinks Market Revenue (billion) Forecast, by Application 2020 & 2033
- Table 12: Canada Sour Milk Drinks Market Volume (Liters) Forecast, by Application 2020 & 2033
- Table 13: Mexico Sour Milk Drinks Market Revenue (billion) Forecast, by Application 2020 & 2033
- Table 14: Mexico Sour Milk Drinks Market Volume (Liters) Forecast, by Application 2020 & 2033
- Table 15: Global Sour Milk Drinks Market Revenue billion Forecast, by Distribution Channel 2020 & 2033
- Table 16: Global Sour Milk Drinks Market Volume Liters Forecast, by Distribution Channel 2020 & 2033
- Table 17: Global Sour Milk Drinks Market Revenue billion Forecast, by Country 2020 & 2033
- Table 18: Global Sour Milk Drinks Market Volume Liters Forecast, by Country 2020 & 2033
- Table 19: Brazil Sour Milk Drinks Market Revenue (billion) Forecast, by Application 2020 & 2033
- Table 20: Brazil Sour Milk Drinks Market Volume (Liters) Forecast, by Application 2020 & 2033
- Table 21: Argentina Sour Milk Drinks Market Revenue (billion) Forecast, by Application 2020 & 2033
- Table 22: Argentina Sour Milk Drinks Market Volume (Liters) Forecast, by Application 2020 & 2033
- Table 23: Rest of South America Sour Milk Drinks Market Revenue (billion) Forecast, by Application 2020 & 2033
- Table 24: Rest of South America Sour Milk Drinks Market Volume (Liters) Forecast, by Application 2020 & 2033
- Table 25: Global Sour Milk Drinks Market Revenue billion Forecast, by Distribution Channel 2020 & 2033
- Table 26: Global Sour Milk Drinks Market Volume Liters Forecast, by Distribution Channel 2020 & 2033
- Table 27: Global Sour Milk Drinks Market Revenue billion Forecast, by Country 2020 & 2033
- Table 28: Global Sour Milk Drinks Market Volume Liters Forecast, by Country 2020 & 2033
- Table 29: United Kingdom Sour Milk Drinks Market Revenue (billion) Forecast, by Application 2020 & 2033
- Table 30: United Kingdom Sour Milk Drinks Market Volume (Liters) Forecast, by Application 2020 & 2033
- Table 31: Germany Sour Milk Drinks Market Revenue (billion) Forecast, by Application 2020 & 2033
- Table 32: Germany Sour Milk Drinks Market Volume (Liters) Forecast, by Application 2020 & 2033
- Table 33: France Sour Milk Drinks Market Revenue (billion) Forecast, by Application 2020 & 2033
- Table 34: France Sour Milk Drinks Market Volume (Liters) Forecast, by Application 2020 & 2033
- Table 35: Italy Sour Milk Drinks Market Revenue (billion) Forecast, by Application 2020 & 2033
- Table 36: Italy Sour Milk Drinks Market Volume (Liters) Forecast, by Application 2020 & 2033
- Table 37: Spain Sour Milk Drinks Market Revenue (billion) Forecast, by Application 2020 & 2033
- Table 38: Spain Sour Milk Drinks Market Volume (Liters) Forecast, by Application 2020 & 2033
- Table 39: Russia Sour Milk Drinks Market Revenue (billion) Forecast, by Application 2020 & 2033
- Table 40: Russia Sour Milk Drinks Market Volume (Liters) Forecast, by Application 2020 & 2033
- Table 41: Benelux Sour Milk Drinks Market Revenue (billion) Forecast, by Application 2020 & 2033
- Table 42: Benelux Sour Milk Drinks Market Volume (Liters) Forecast, by Application 2020 & 2033
- Table 43: Nordics Sour Milk Drinks Market Revenue (billion) Forecast, by Application 2020 & 2033
- Table 44: Nordics Sour Milk Drinks Market Volume (Liters) Forecast, by Application 2020 & 2033
- Table 45: Rest of Europe Sour Milk Drinks Market Revenue (billion) Forecast, by Application 2020 & 2033
- Table 46: Rest of Europe Sour Milk Drinks Market Volume (Liters) Forecast, by Application 2020 & 2033
- Table 47: Global Sour Milk Drinks Market Revenue billion Forecast, by Distribution Channel 2020 & 2033
- Table 48: Global Sour Milk Drinks Market Volume Liters Forecast, by Distribution Channel 2020 & 2033
- Table 49: Global Sour Milk Drinks Market Revenue billion Forecast, by Country 2020 & 2033
- Table 50: Global Sour Milk Drinks Market Volume Liters Forecast, by Country 2020 & 2033
- Table 51: Turkey Sour Milk Drinks Market Revenue (billion) Forecast, by Application 2020 & 2033
- Table 52: Turkey Sour Milk Drinks Market Volume (Liters) Forecast, by Application 2020 & 2033
- Table 53: Israel Sour Milk Drinks Market Revenue (billion) Forecast, by Application 2020 & 2033
- Table 54: Israel Sour Milk Drinks Market Volume (Liters) Forecast, by Application 2020 & 2033
- Table 55: GCC Sour Milk Drinks Market Revenue (billion) Forecast, by Application 2020 & 2033
- Table 56: GCC Sour Milk Drinks Market Volume (Liters) Forecast, by Application 2020 & 2033
- Table 57: North Africa Sour Milk Drinks Market Revenue (billion) Forecast, by Application 2020 & 2033
- Table 58: North Africa Sour Milk Drinks Market Volume (Liters) Forecast, by Application 2020 & 2033
- Table 59: South Africa Sour Milk Drinks Market Revenue (billion) Forecast, by Application 2020 & 2033
- Table 60: South Africa Sour Milk Drinks Market Volume (Liters) Forecast, by Application 2020 & 2033
- Table 61: Rest of Middle East & Africa Sour Milk Drinks Market Revenue (billion) Forecast, by Application 2020 & 2033
- Table 62: Rest of Middle East & Africa Sour Milk Drinks Market Volume (Liters) Forecast, by Application 2020 & 2033
- Table 63: Global Sour Milk Drinks Market Revenue billion Forecast, by Distribution Channel 2020 & 2033
- Table 64: Global Sour Milk Drinks Market Volume Liters Forecast, by Distribution Channel 2020 & 2033
- Table 65: Global Sour Milk Drinks Market Revenue billion Forecast, by Country 2020 & 2033
- Table 66: Global Sour Milk Drinks Market Volume Liters Forecast, by Country 2020 & 2033
- Table 67: China Sour Milk Drinks Market Revenue (billion) Forecast, by Application 2020 & 2033
- Table 68: China Sour Milk Drinks Market Volume (Liters) Forecast, by Application 2020 & 2033
- Table 69: India Sour Milk Drinks Market Revenue (billion) Forecast, by Application 2020 & 2033
- Table 70: India Sour Milk Drinks Market Volume (Liters) Forecast, by Application 2020 & 2033
- Table 71: Japan Sour Milk Drinks Market Revenue (billion) Forecast, by Application 2020 & 2033
- Table 72: Japan Sour Milk Drinks Market Volume (Liters) Forecast, by Application 2020 & 2033
- Table 73: South Korea Sour Milk Drinks Market Revenue (billion) Forecast, by Application 2020 & 2033
- Table 74: South Korea Sour Milk Drinks Market Volume (Liters) Forecast, by Application 2020 & 2033
- Table 75: ASEAN Sour Milk Drinks Market Revenue (billion) Forecast, by Application 2020 & 2033
- Table 76: ASEAN Sour Milk Drinks Market Volume (Liters) Forecast, by Application 2020 & 2033
- Table 77: Oceania Sour Milk Drinks Market Revenue (billion) Forecast, by Application 2020 & 2033
- Table 78: Oceania Sour Milk Drinks Market Volume (Liters) Forecast, by Application 2020 & 2033
- Table 79: Rest of Asia Pacific Sour Milk Drinks Market Revenue (billion) Forecast, by Application 2020 & 2033
- Table 80: Rest of Asia Pacific Sour Milk Drinks Market Volume (Liters) Forecast, by Application 2020 & 2033
Frequently Asked Questions
1. What is the projected Compound Annual Growth Rate (CAGR) of the Sour Milk Drinks Market?
The projected CAGR is approximately 5.19%.
2. Which companies are prominent players in the Sour Milk Drinks Market?
Key companies in the market include Nestlé SA, Almarai Company, Green Valley Farms Market and Creamery, Hiland Dairy Foods Company LLC, Lifeway Foods Inc, Dairy Farmers of America Inc, Producers Dairy Foods Inc (Umpqua Dairy, Gujarat Co-operative Milk Marketing Federation Ltd.
3. What are the main segments of the Sour Milk Drinks Market?
The market segments include Distribution Channel.
4. Can you provide details about the market size?
The market size is estimated to be USD 9.03 billion as of 2022.
5. What are some drivers contributing to market growth?
Rising Demand for Clean Label Food & Beverage Products; Rising Demand for Dairy Products.
6. What are the notable trends driving market growth?
OTHER KEY INDUSTRY TRENDS COVERED IN THE REPORT.
7. Are there any restraints impacting market growth?
Presence of Preservatives in Ready Meals may Hamper the Market Growth.
8. Can you provide examples of recent developments in the market?
July 2022: Gujarat Co-operative Milk Marketing Federation Ltd. announced an investment of USD 60 Million for a new dairy plant in Rajkot to expand the milk, curd, and buttermilk products segment.August 2021: Lifeway Foods Inc., a manufacturer of kefir and fermented probiotic products, expanded its kefir distribution in the Irish market with a listing at Tesco.July 2021: Lifeway Foods Inc. expanded its distribution of kefir into the French market through the retailer Costco France.
9. What pricing options are available for accessing the report?
Pricing options include single-user, multi-user, and enterprise licenses priced at USD 3800, USD 4500, and USD 5800 respectively.
10. Is the market size provided in terms of value or volume?
The market size is provided in terms of value, measured in billion and volume, measured in Liters.
11. Are there any specific market keywords associated with the report?
Yes, the market keyword associated with the report is "Sour Milk Drinks Market," which aids in identifying and referencing the specific market segment covered.
12. How do I determine which pricing option suits my needs best?
The pricing options vary based on user requirements and access needs. Individual users may opt for single-user licenses, while businesses requiring broader access may choose multi-user or enterprise licenses for cost-effective access to the report.
13. Are there any additional resources or data provided in the Sour Milk Drinks Market report?
While the report offers comprehensive insights, it's advisable to review the specific contents or supplementary materials provided to ascertain if additional resources or data are available.
14. How can I stay updated on further developments or reports in the Sour Milk Drinks Market?
To stay informed about further developments, trends, and reports in the Sour Milk Drinks Market, consider subscribing to industry newsletters, following relevant companies and organizations, or regularly checking reputable industry news sources and publications.
Methodology
Step 1 - Identification of Relevant Samples Size from Population Database


Step 2 - Approaches for Defining Global Market Size (Value, Volume* & Price*)

Note*: In applicable scenarios
Step 3 - Data Sources
Primary Research
- Web Analytics
- Survey Reports
- Research Institute
- Latest Research Reports
- Opinion Leaders
Secondary Research
- Annual Reports
- White Paper
- Latest Press Release
- Industry Association
- Paid Database
- Investor Presentations

Step 4 - Data Triangulation
Involves using different sources of information in order to increase the validity of a study
These sources are likely to be stakeholders in a program - participants, other researchers, program staff, other community members, and so on.
Then we put all data in single framework & apply various statistical tools to find out the dynamic on the market.
During the analysis stage, feedback from the stakeholder groups would be compared to determine areas of agreement as well as areas of divergence