
Key Insights
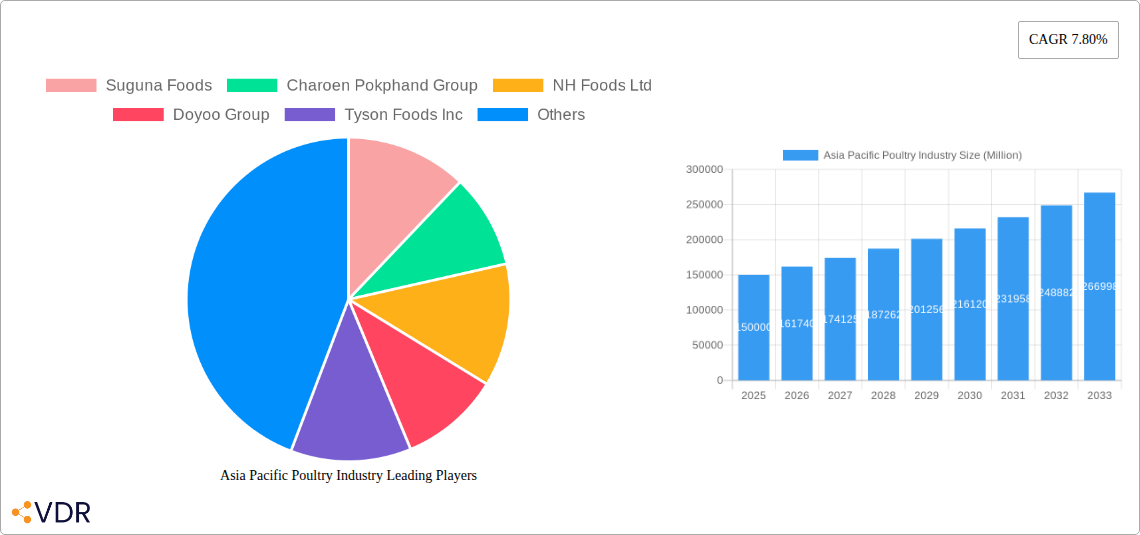
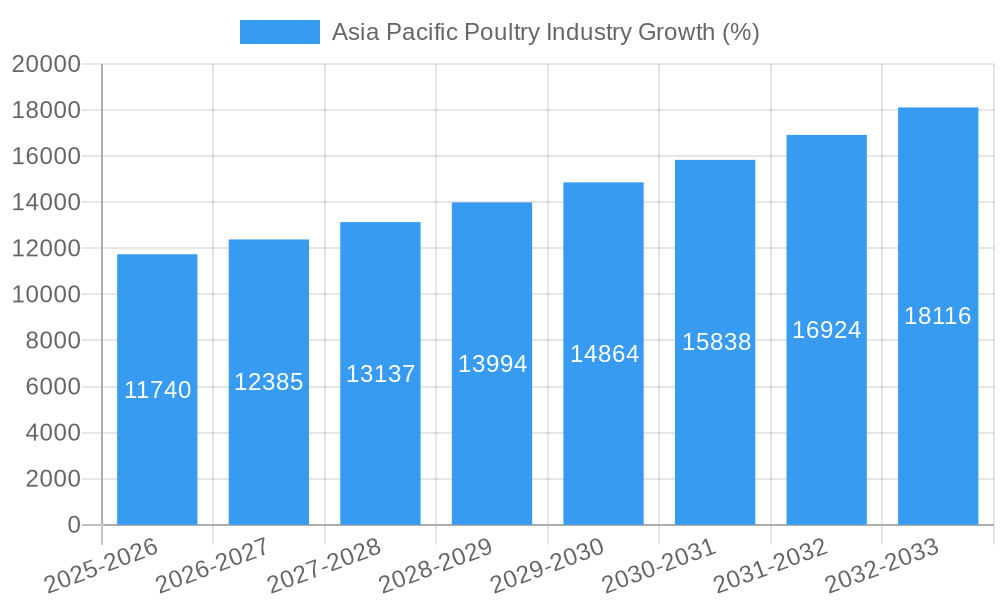
The Asia Pacific poultry industry, a significant contributor to the global food supply, is experiencing robust growth, projected at a 7.80% CAGR from 2025 to 2033. This expansion is fueled by several key factors. Firstly, the rising population, particularly in rapidly developing economies like India and China, is driving increased demand for protein-rich poultry products. Secondly, increasing urbanization and changing dietary habits are shifting consumption patterns towards more convenient and affordable protein sources like chicken meat and eggs. The industry benefits from advancements in poultry farming techniques, leading to improved efficiency and higher yields. However, challenges such as fluctuations in feed prices, avian influenza outbreaks, and stringent regulations regarding animal welfare and food safety pose potential restraints to growth. The market is segmented by product type (table eggs and chicken meat), distribution channel (on-trade and off-trade), and geography (China, India, Japan, Australia, and the Rest of Asia Pacific). Major players such as Suguna Foods, Charoen Pokphand Group, and Tyson Foods are shaping the competitive landscape through strategic investments, technological innovations, and expansion strategies. The Rest of Asia Pacific region, encompassing countries with burgeoning economies and growing middle classes, presents a promising growth avenue for the industry.
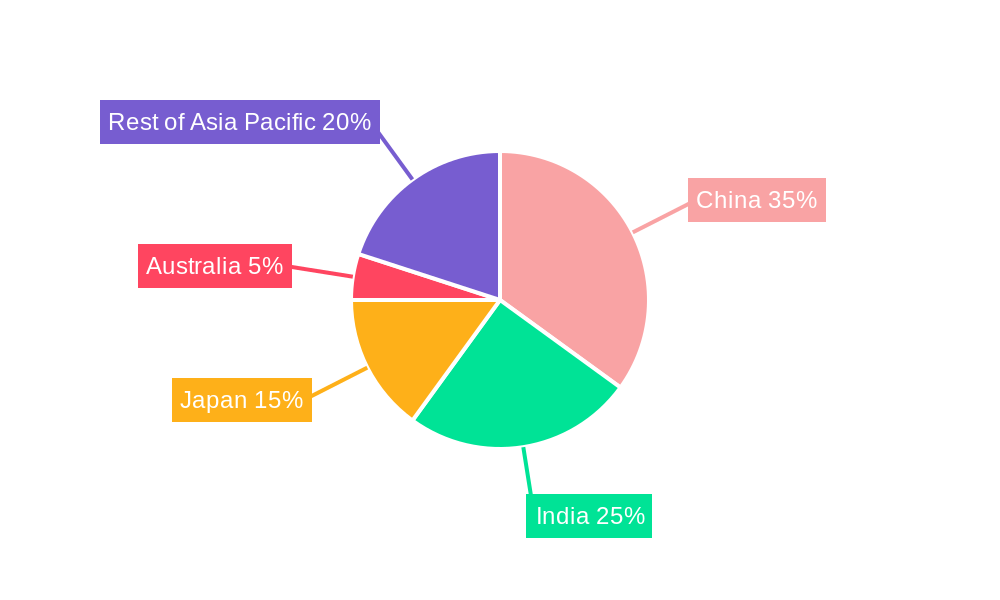
The regional distribution of the market is heavily influenced by the size and consumption patterns of China and India, which represent significant market shares. Japan and Australia, with their developed economies and established poultry industries, contribute substantial value but exhibit potentially lower growth rates compared to the rapidly expanding markets in other parts of Asia Pacific. While the on-trade segment (restaurants, hotels, etc.) is recovering post-pandemic, the off-trade segment (supermarkets, retail stores) continues to experience strong growth driven by consumers' increasing preference for home consumption. Future market success will rely on companies' ability to adapt to shifting consumer preferences, enhance supply chain efficiency, and navigate regulatory complexities while prioritizing sustainability and animal welfare.
Asia Pacific Poultry Industry Market Report: 2019-2033
This comprehensive report provides an in-depth analysis of the Asia Pacific poultry industry, covering market dynamics, growth trends, dominant segments, and key players. With a study period spanning 2019-2033, a base year of 2025, and a forecast period of 2025-2033, this report offers invaluable insights for industry professionals, investors, and strategic decision-makers. The report analyzes parent markets (Poultry) and child markets (Table Eggs, Chicken Meat, On-Trade and Off-Trade Distribution Channels) across key Asia-Pacific countries including China, India, Japan, Australia, and the Rest of Asia Pacific. The report is valued at xx Million units.
Asia Pacific Poultry Industry Market Dynamics & Structure
The Asia Pacific poultry industry is characterized by a dynamic interplay of market concentration, technological innovation, regulatory frameworks, competitive substitutes, and evolving consumer demographics. The market is moderately concentrated, with key players like Suguna Foods, Charoen Pokphand Group, and Tyson Foods Inc. holding significant market share, though smaller regional players also thrive. Technological advancements, particularly in automation and feed efficiency, are driving productivity gains. Regulatory frameworks vary across countries, impacting production practices and trade flows. Plant-based and cultured meat alternatives pose a growing competitive threat, albeit from a relatively small base currently. M&A activity remains significant, with larger players seeking to consolidate market share and expand geographically.
- Market Concentration: Top 5 players hold approximately xx% market share (2024).
- Technological Innovation: Focus on automation, precision feeding, and disease control technologies.
- Regulatory Landscape: Varies significantly across countries, influencing production costs and trade.
- Competitive Substitutes: Growing presence of plant-based and cultured meat alternatives.
- M&A Activity: xx major deals recorded between 2019-2024, totaling xx Million units in value.
Asia Pacific Poultry Industry Growth Trends & Insights
The Asia Pacific poultry industry exhibits robust growth, driven by rising disposable incomes, changing dietary habits (increased meat consumption), and population growth, particularly in emerging economies like India and China. The market experienced a CAGR of xx% during the historical period (2019-2024) and is projected to maintain a CAGR of xx% during the forecast period (2025-2033). Technological advancements improve efficiency and reduce production costs, further fueling growth. However, challenges remain, including disease outbreaks, fluctuating feed prices, and environmental concerns. Consumer preferences are also shifting toward healthier and more sustainable poultry products.
Dominant Regions, Countries, or Segments in Asia Pacific Poultry Industry
China and India represent the largest markets within the Asia Pacific poultry industry, driven by immense population size and increasing per capita consumption. Within product types, chicken meat dominates, commanding xx% of the market in 2024, followed by table eggs at xx%. The off-trade channel (supermarkets, retail) accounts for a larger share than the on-trade (restaurants, hotels) due to broader accessibility.
- China: Largest market driven by high population and rising meat consumption. Growth hampered by environmental regulations and disease outbreaks.
- India: Rapid growth potential fueled by increasing disposable incomes and a young population. Challenges include infrastructure limitations and fragmented supply chains.
- Chicken Meat: Dominant product type due to affordability and versatility.
- Off-Trade Channel: Higher market share driven by increased accessibility and convenience.
Asia Pacific Poultry Industry Product Landscape
Product innovation focuses on enhancing taste, texture, convenience, and health benefits. Value-added products like ready-to-eat meals and processed poultry are gaining popularity. Technological advancements in breeding, feed formulation, and processing techniques contribute to improved product quality and consistency. Unique selling propositions often revolve around organic certifications, antibiotic-free claims, and specific flavour profiles.
Key Drivers, Barriers & Challenges in Asia Pacific Poultry Industry
Key Drivers: Rising disposable incomes, population growth, urbanization, changing dietary habits, and technological advancements.
Challenges: Disease outbreaks (e.g., Avian Influenza) impacting production and trade, fluctuating feed prices, environmental regulations, and competition from alternative protein sources. These factors negatively impacted the market by approximately xx Million units in 2022.
Emerging Opportunities in Asia Pacific Poultry Industry
Untapped markets in Southeast Asia, increasing demand for value-added products, the growth of e-commerce channels for poultry distribution, and rising consumer awareness of sustainable and ethical poultry farming practices present significant opportunities for growth.
Growth Accelerators in the Asia Pacific Poultry Industry
Technological breakthroughs in disease prevention, improved feed efficiency, and sustainable farming practices will drive long-term growth. Strategic partnerships across the value chain and expansion into new markets will further enhance industry performance.
Key Players Shaping the Asia Pacific Poultry Industry Market
- Suguna Foods
- Charoen Pokphand Group
- NH Foods Ltd
- Doyoo Group
- Tyson Foods Inc
- VH Group
- New Hope Liuhe
- Cargill Inc
- Wen's Food Group
- Sunner Development Co
Notable Milestones in Asia Pacific Poultry Industry Sector
- September 2022: Tyson Foods launched fully-cooked frozen chicken products in Malaysia using innovative cooking technology.
- October 2022: Tyson launched processed meat products in Malaysia, including halal-certified options.
- October 2022: Vow, an Australian cultured meat start-up, opened Factory 1, a 30-tonne per year cultured meat facility. Factory 2 is planned for 2H FY24 with a capacity approximately 100 times larger.
In-Depth Asia Pacific Poultry Industry Market Outlook
The Asia Pacific poultry industry is poised for continued expansion, driven by increasing demand, technological advancements, and strategic market development. Opportunities lie in expanding value-added product offerings, exploring new distribution channels, and addressing sustainability concerns. The industry will experience continued consolidation, with larger players leveraging technology and partnerships to drive efficiency and market share gains. The market is projected to reach xx Million units by 2033.
Asia Pacific Poultry Industry Segmentation
-
1. Product Type
- 1.1. Table Eggs
-
1.2. Chicken Meat
- 1.2.1. Fresh / Chilled
- 1.2.2. Frozen / Canned
- 1.2.3. Processed
-
2. Distribution Channel
- 2.1. On-Trade
-
2.2. Off-Trade
- 2.2.1. Supermarkets/Hypermarkets
- 2.2.2. Specialty Stores
- 2.2.3. Online Retail
- 2.2.4. Others
Asia Pacific Poultry Industry Segmentation By Geography
-
1. Asia Pacific
- 1.1. China
- 1.2. Japan
- 1.3. South Korea
- 1.4. India
- 1.5. Australia
- 1.6. New Zealand
- 1.7. Indonesia
- 1.8. Malaysia
- 1.9. Singapore
- 1.10. Thailand
- 1.11. Vietnam
- 1.12. Philippines
Asia Pacific Poultry Industry REPORT HIGHLIGHTS
| Aspects | Details |
|---|---|
| Study Period | 2019-2033 |
| Base Year | 2024 |
| Estimated Year | 2025 |
| Forecast Period | 2025-2033 |
| Historical Period | 2019-2024 |
| Growth Rate | CAGR of 7.80% from 2019-2033 |
| Segmentation |
|
Table of Contents
- 1. Introduction
- 1.1. Research Scope
- 1.2. Market Segmentation
- 1.3. Research Methodology
- 1.4. Definitions and Assumptions
- 2. Executive Summary
- 2.1. Introduction
- 3. Market Dynamics
- 3.1. Introduction
- 3.2. Market Drivers
- 3.2.1. Increasing Demand for Protein-Rich Food; Increasing Demand for Plant-Based and Organic Ingredients
- 3.3. Market Restrains
- 3.3.1. Presence of Alternative Proteins
- 3.4. Market Trends
- 3.4.1. Increasing Demand for Poultry Products
- 4. Market Factor Analysis
- 4.1. Porters Five Forces
- 4.2. Supply/Value Chain
- 4.3. PESTEL analysis
- 4.4. Market Entropy
- 4.5. Patent/Trademark Analysis
- 5. Asia Pacific Poultry Industry Analysis, Insights and Forecast, 2019-2031
- 5.1. Market Analysis, Insights and Forecast - by Product Type
- 5.1.1. Table Eggs
- 5.1.2. Chicken Meat
- 5.1.2.1. Fresh / Chilled
- 5.1.2.2. Frozen / Canned
- 5.1.2.3. Processed
- 5.2. Market Analysis, Insights and Forecast - by Distribution Channel
- 5.2.1. On-Trade
- 5.2.2. Off-Trade
- 5.2.2.1. Supermarkets/Hypermarkets
- 5.2.2.2. Specialty Stores
- 5.2.2.3. Online Retail
- 5.2.2.4. Others
- 5.3. Market Analysis, Insights and Forecast - by Region
- 5.3.1. Asia Pacific
- 5.1. Market Analysis, Insights and Forecast - by Product Type
- 6. China Asia Pacific Poultry Industry Analysis, Insights and Forecast, 2019-2031
- 7. Japan Asia Pacific Poultry Industry Analysis, Insights and Forecast, 2019-2031
- 8. India Asia Pacific Poultry Industry Analysis, Insights and Forecast, 2019-2031
- 9. South Korea Asia Pacific Poultry Industry Analysis, Insights and Forecast, 2019-2031
- 10. Taiwan Asia Pacific Poultry Industry Analysis, Insights and Forecast, 2019-2031
- 11. Australia Asia Pacific Poultry Industry Analysis, Insights and Forecast, 2019-2031
- 12. Rest of Asia-Pacific Asia Pacific Poultry Industry Analysis, Insights and Forecast, 2019-2031
- 13. Competitive Analysis
- 13.1. Market Share Analysis 2024
- 13.2. Company Profiles
- 13.2.1 Suguna Foods
- 13.2.1.1. Overview
- 13.2.1.2. Products
- 13.2.1.3. SWOT Analysis
- 13.2.1.4. Recent Developments
- 13.2.1.5. Financials (Based on Availability)
- 13.2.2 Charoen Pokphand Group
- 13.2.2.1. Overview
- 13.2.2.2. Products
- 13.2.2.3. SWOT Analysis
- 13.2.2.4. Recent Developments
- 13.2.2.5. Financials (Based on Availability)
- 13.2.3 NH Foods Ltd
- 13.2.3.1. Overview
- 13.2.3.2. Products
- 13.2.3.3. SWOT Analysis
- 13.2.3.4. Recent Developments
- 13.2.3.5. Financials (Based on Availability)
- 13.2.4 Doyoo Group
- 13.2.4.1. Overview
- 13.2.4.2. Products
- 13.2.4.3. SWOT Analysis
- 13.2.4.4. Recent Developments
- 13.2.4.5. Financials (Based on Availability)
- 13.2.5 Tyson Foods Inc
- 13.2.5.1. Overview
- 13.2.5.2. Products
- 13.2.5.3. SWOT Analysis
- 13.2.5.4. Recent Developments
- 13.2.5.5. Financials (Based on Availability)
- 13.2.6 VH Group
- 13.2.6.1. Overview
- 13.2.6.2. Products
- 13.2.6.3. SWOT Analysis
- 13.2.6.4. Recent Developments
- 13.2.6.5. Financials (Based on Availability)
- 13.2.7 New Hope Liuhe
- 13.2.7.1. Overview
- 13.2.7.2. Products
- 13.2.7.3. SWOT Analysis
- 13.2.7.4. Recent Developments
- 13.2.7.5. Financials (Based on Availability)
- 13.2.8 Cargill Inc
- 13.2.8.1. Overview
- 13.2.8.2. Products
- 13.2.8.3. SWOT Analysis
- 13.2.8.4. Recent Developments
- 13.2.8.5. Financials (Based on Availability)
- 13.2.9 Wen's Food Group
- 13.2.9.1. Overview
- 13.2.9.2. Products
- 13.2.9.3. SWOT Analysis
- 13.2.9.4. Recent Developments
- 13.2.9.5. Financials (Based on Availability)
- 13.2.10 Sunner Development Co*List Not Exhaustive
- 13.2.10.1. Overview
- 13.2.10.2. Products
- 13.2.10.3. SWOT Analysis
- 13.2.10.4. Recent Developments
- 13.2.10.5. Financials (Based on Availability)
- 13.2.1 Suguna Foods
List of Figures
- Figure 1: Asia Pacific Poultry Industry Revenue Breakdown (Million, %) by Product 2024 & 2032
- Figure 2: Asia Pacific Poultry Industry Share (%) by Company 2024
List of Tables
- Table 1: Asia Pacific Poultry Industry Revenue Million Forecast, by Region 2019 & 2032
- Table 2: Asia Pacific Poultry Industry Volume K Tons Forecast, by Region 2019 & 2032
- Table 3: Asia Pacific Poultry Industry Revenue Million Forecast, by Product Type 2019 & 2032
- Table 4: Asia Pacific Poultry Industry Volume K Tons Forecast, by Product Type 2019 & 2032
- Table 5: Asia Pacific Poultry Industry Revenue Million Forecast, by Distribution Channel 2019 & 2032
- Table 6: Asia Pacific Poultry Industry Volume K Tons Forecast, by Distribution Channel 2019 & 2032
- Table 7: Asia Pacific Poultry Industry Revenue Million Forecast, by Region 2019 & 2032
- Table 8: Asia Pacific Poultry Industry Volume K Tons Forecast, by Region 2019 & 2032
- Table 9: Asia Pacific Poultry Industry Revenue Million Forecast, by Country 2019 & 2032
- Table 10: Asia Pacific Poultry Industry Volume K Tons Forecast, by Country 2019 & 2032
- Table 11: China Asia Pacific Poultry Industry Revenue (Million) Forecast, by Application 2019 & 2032
- Table 12: China Asia Pacific Poultry Industry Volume (K Tons) Forecast, by Application 2019 & 2032
- Table 13: Japan Asia Pacific Poultry Industry Revenue (Million) Forecast, by Application 2019 & 2032
- Table 14: Japan Asia Pacific Poultry Industry Volume (K Tons) Forecast, by Application 2019 & 2032
- Table 15: India Asia Pacific Poultry Industry Revenue (Million) Forecast, by Application 2019 & 2032
- Table 16: India Asia Pacific Poultry Industry Volume (K Tons) Forecast, by Application 2019 & 2032
- Table 17: South Korea Asia Pacific Poultry Industry Revenue (Million) Forecast, by Application 2019 & 2032
- Table 18: South Korea Asia Pacific Poultry Industry Volume (K Tons) Forecast, by Application 2019 & 2032
- Table 19: Taiwan Asia Pacific Poultry Industry Revenue (Million) Forecast, by Application 2019 & 2032
- Table 20: Taiwan Asia Pacific Poultry Industry Volume (K Tons) Forecast, by Application 2019 & 2032
- Table 21: Australia Asia Pacific Poultry Industry Revenue (Million) Forecast, by Application 2019 & 2032
- Table 22: Australia Asia Pacific Poultry Industry Volume (K Tons) Forecast, by Application 2019 & 2032
- Table 23: Rest of Asia-Pacific Asia Pacific Poultry Industry Revenue (Million) Forecast, by Application 2019 & 2032
- Table 24: Rest of Asia-Pacific Asia Pacific Poultry Industry Volume (K Tons) Forecast, by Application 2019 & 2032
- Table 25: Asia Pacific Poultry Industry Revenue Million Forecast, by Product Type 2019 & 2032
- Table 26: Asia Pacific Poultry Industry Volume K Tons Forecast, by Product Type 2019 & 2032
- Table 27: Asia Pacific Poultry Industry Revenue Million Forecast, by Distribution Channel 2019 & 2032
- Table 28: Asia Pacific Poultry Industry Volume K Tons Forecast, by Distribution Channel 2019 & 2032
- Table 29: Asia Pacific Poultry Industry Revenue Million Forecast, by Country 2019 & 2032
- Table 30: Asia Pacific Poultry Industry Volume K Tons Forecast, by Country 2019 & 2032
- Table 31: China Asia Pacific Poultry Industry Revenue (Million) Forecast, by Application 2019 & 2032
- Table 32: China Asia Pacific Poultry Industry Volume (K Tons) Forecast, by Application 2019 & 2032
- Table 33: Japan Asia Pacific Poultry Industry Revenue (Million) Forecast, by Application 2019 & 2032
- Table 34: Japan Asia Pacific Poultry Industry Volume (K Tons) Forecast, by Application 2019 & 2032
- Table 35: South Korea Asia Pacific Poultry Industry Revenue (Million) Forecast, by Application 2019 & 2032
- Table 36: South Korea Asia Pacific Poultry Industry Volume (K Tons) Forecast, by Application 2019 & 2032
- Table 37: India Asia Pacific Poultry Industry Revenue (Million) Forecast, by Application 2019 & 2032
- Table 38: India Asia Pacific Poultry Industry Volume (K Tons) Forecast, by Application 2019 & 2032
- Table 39: Australia Asia Pacific Poultry Industry Revenue (Million) Forecast, by Application 2019 & 2032
- Table 40: Australia Asia Pacific Poultry Industry Volume (K Tons) Forecast, by Application 2019 & 2032
- Table 41: New Zealand Asia Pacific Poultry Industry Revenue (Million) Forecast, by Application 2019 & 2032
- Table 42: New Zealand Asia Pacific Poultry Industry Volume (K Tons) Forecast, by Application 2019 & 2032
- Table 43: Indonesia Asia Pacific Poultry Industry Revenue (Million) Forecast, by Application 2019 & 2032
- Table 44: Indonesia Asia Pacific Poultry Industry Volume (K Tons) Forecast, by Application 2019 & 2032
- Table 45: Malaysia Asia Pacific Poultry Industry Revenue (Million) Forecast, by Application 2019 & 2032
- Table 46: Malaysia Asia Pacific Poultry Industry Volume (K Tons) Forecast, by Application 2019 & 2032
- Table 47: Singapore Asia Pacific Poultry Industry Revenue (Million) Forecast, by Application 2019 & 2032
- Table 48: Singapore Asia Pacific Poultry Industry Volume (K Tons) Forecast, by Application 2019 & 2032
- Table 49: Thailand Asia Pacific Poultry Industry Revenue (Million) Forecast, by Application 2019 & 2032
- Table 50: Thailand Asia Pacific Poultry Industry Volume (K Tons) Forecast, by Application 2019 & 2032
- Table 51: Vietnam Asia Pacific Poultry Industry Revenue (Million) Forecast, by Application 2019 & 2032
- Table 52: Vietnam Asia Pacific Poultry Industry Volume (K Tons) Forecast, by Application 2019 & 2032
- Table 53: Philippines Asia Pacific Poultry Industry Revenue (Million) Forecast, by Application 2019 & 2032
- Table 54: Philippines Asia Pacific Poultry Industry Volume (K Tons) Forecast, by Application 2019 & 2032
Frequently Asked Questions
1. What is the projected Compound Annual Growth Rate (CAGR) of the Asia Pacific Poultry Industry?
The projected CAGR is approximately 7.80%.
2. Which companies are prominent players in the Asia Pacific Poultry Industry?
Key companies in the market include Suguna Foods, Charoen Pokphand Group, NH Foods Ltd, Doyoo Group, Tyson Foods Inc, VH Group, New Hope Liuhe, Cargill Inc, Wen's Food Group, Sunner Development Co*List Not Exhaustive.
3. What are the main segments of the Asia Pacific Poultry Industry?
The market segments include Product Type, Distribution Channel.
4. Can you provide details about the market size?
The market size is estimated to be USD XX Million as of 2022.
5. What are some drivers contributing to market growth?
Increasing Demand for Protein-Rich Food; Increasing Demand for Plant-Based and Organic Ingredients.
6. What are the notable trends driving market growth?
Increasing Demand for Poultry Products.
7. Are there any restraints impacting market growth?
Presence of Alternative Proteins.
8. Can you provide examples of recent developments in the market?
In October 2022, Vow, an Australian cultured meat start-up opened the first of two planned cultured meat facilities. The facility, Factory 1, can produce 30 tonnes of cultured meat a year, making it the largest plant in the Southern Hemisphere. Plans for Factory 2 were advanced, with the first stage of production scheduled for 2H FY24. It would be roughly 100 times the scale of Factory 1.
9. What pricing options are available for accessing the report?
Pricing options include single-user, multi-user, and enterprise licenses priced at USD 4750, USD 4950, and USD 6800 respectively.
10. Is the market size provided in terms of value or volume?
The market size is provided in terms of value, measured in Million and volume, measured in K Tons.
11. Are there any specific market keywords associated with the report?
Yes, the market keyword associated with the report is "Asia Pacific Poultry Industry," which aids in identifying and referencing the specific market segment covered.
12. How do I determine which pricing option suits my needs best?
The pricing options vary based on user requirements and access needs. Individual users may opt for single-user licenses, while businesses requiring broader access may choose multi-user or enterprise licenses for cost-effective access to the report.
13. Are there any additional resources or data provided in the Asia Pacific Poultry Industry report?
While the report offers comprehensive insights, it's advisable to review the specific contents or supplementary materials provided to ascertain if additional resources or data are available.
14. How can I stay updated on further developments or reports in the Asia Pacific Poultry Industry?
To stay informed about further developments, trends, and reports in the Asia Pacific Poultry Industry, consider subscribing to industry newsletters, following relevant companies and organizations, or regularly checking reputable industry news sources and publications.
Methodology
Step 1 - Identification of Relevant Samples Size from Population Database


Step 2 - Approaches for Defining Global Market Size (Value, Volume* & Price*)

Note*: In applicable scenarios
Step 3 - Data Sources
Primary Research
- Web Analytics
- Survey Reports
- Research Institute
- Latest Research Reports
- Opinion Leaders
Secondary Research
- Annual Reports
- White Paper
- Latest Press Release
- Industry Association
- Paid Database
- Investor Presentations

Step 4 - Data Triangulation
Involves using different sources of information in order to increase the validity of a study
These sources are likely to be stakeholders in a program - participants, other researchers, program staff, other community members, and so on.
Then we put all data in single framework & apply various statistical tools to find out the dynamic on the market.
During the analysis stage, feedback from the stakeholder groups would be compared to determine areas of agreement as well as areas of divergence


