
Key Insights
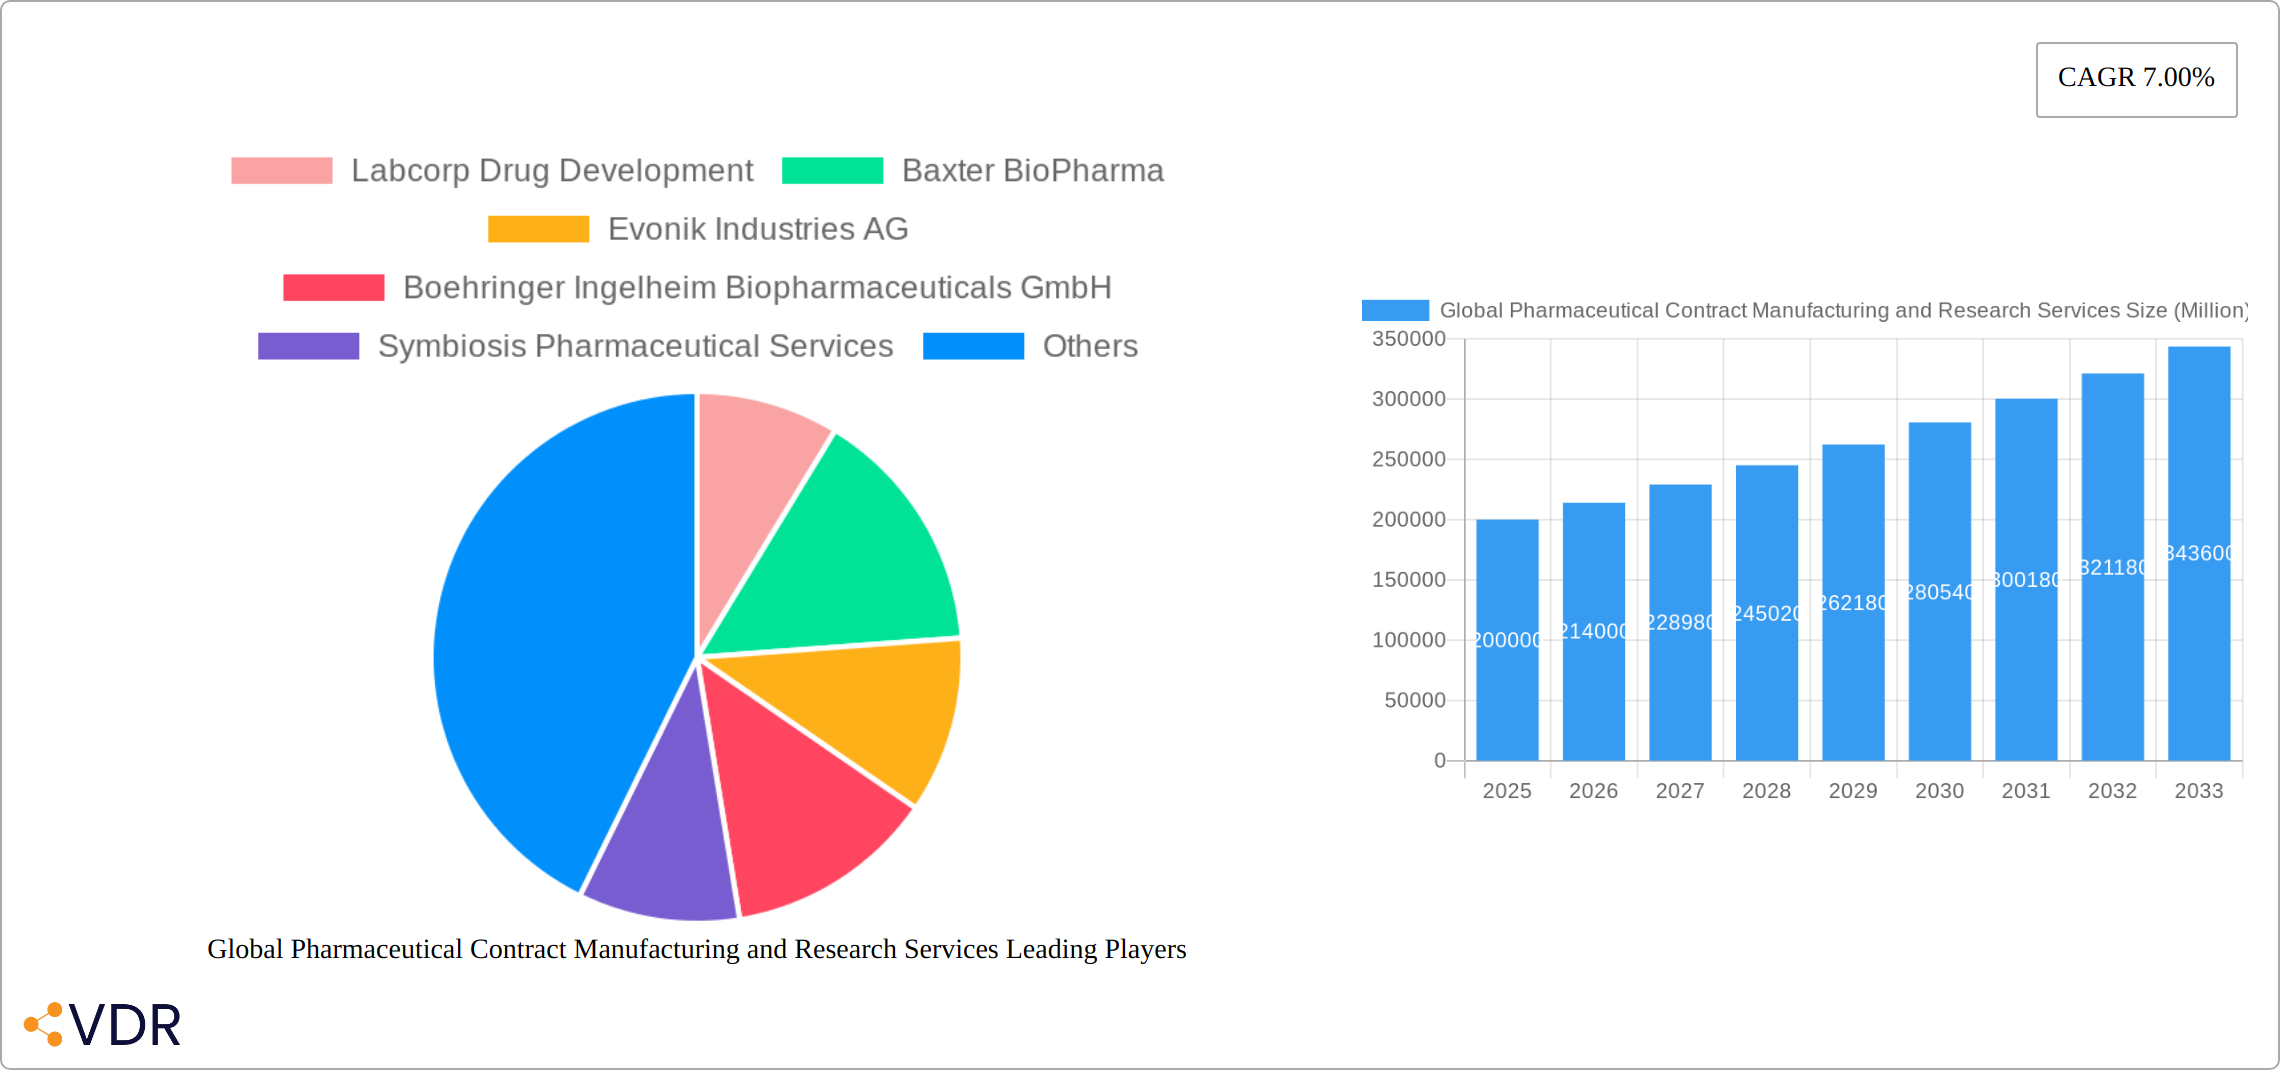
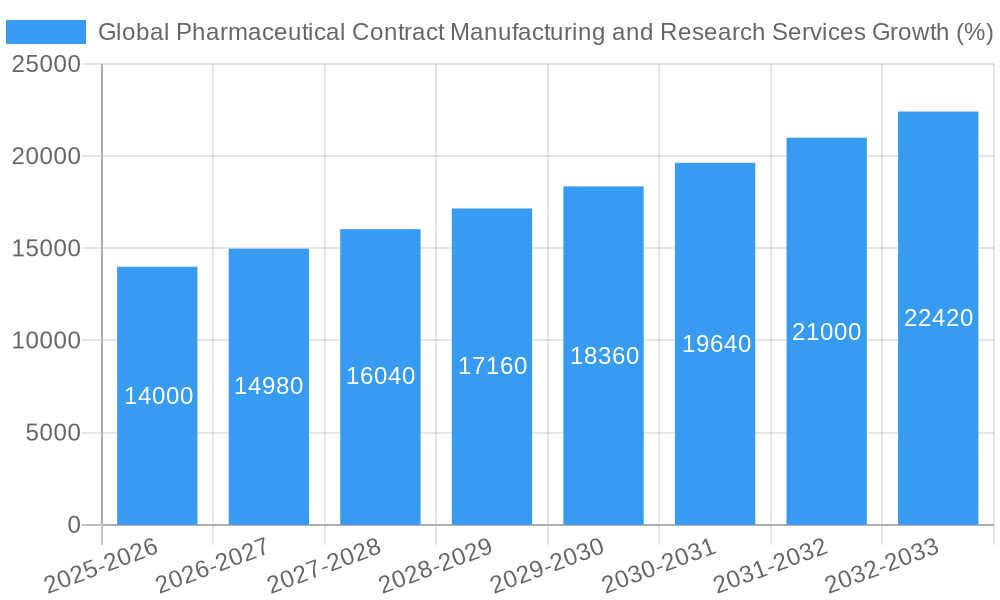
The global pharmaceutical contract manufacturing and research services (CMR) market is experiencing robust growth, driven by several key factors. The increasing complexity of drug development, coupled with the rising demand for specialized therapies like oncology and vaccines, is pushing pharmaceutical companies to outsource manufacturing and research activities. This allows them to focus on core competencies, reduce operational costs, and accelerate time-to-market. The market's expansion is further fueled by advancements in drug delivery technologies (like advanced drug delivery formulations), a growing need for efficient packaging solutions, and a surge in clinical trials across various therapeutic areas. The 7% CAGR indicates a sustained period of growth, projecting significant market expansion over the forecast period (2025-2033). Major players like Labcorp, Baxter, and Lonza are strategically investing in capacity expansion and technological advancements to capitalize on this growth.
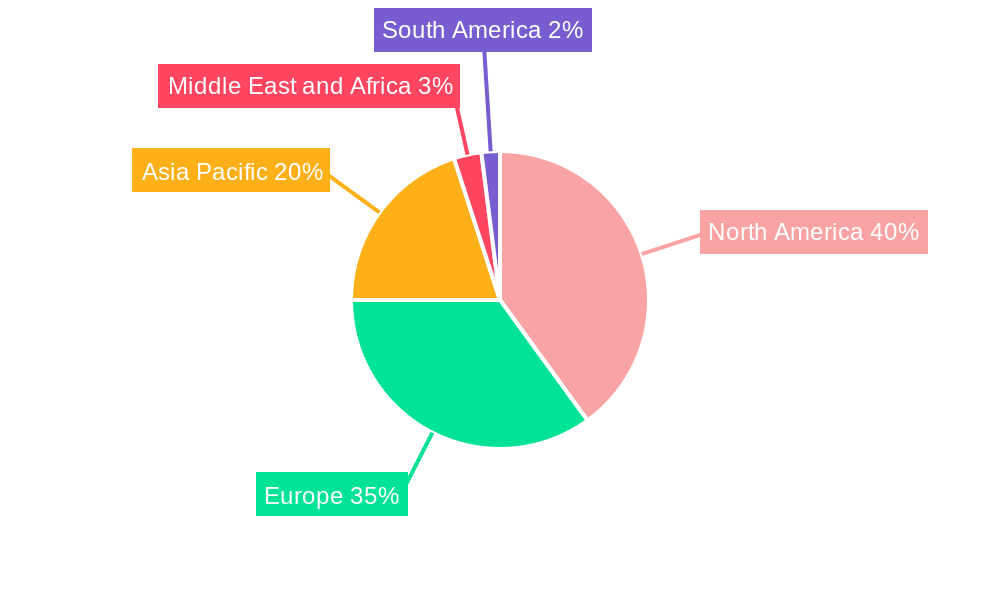
Geographical distribution shows a significant presence across North America and Europe, driven by established regulatory frameworks and a concentration of pharmaceutical companies. However, the Asia-Pacific region is emerging as a rapidly growing market, propelled by expanding manufacturing infrastructure, a rising middle class with increased healthcare spending, and supportive government initiatives. Despite the overall positive outlook, the market faces challenges like stringent regulatory compliance requirements, potential supply chain disruptions, and the need for continuous innovation to address evolving industry demands. The diverse service segments – from API/bulk drug manufacturing to specialized research services in oncology and immunology – offer opportunities for specialized players to establish themselves and cater to specific market needs. The long-term outlook remains positive, with continued expansion expected, driven by increasing outsourcing trends, technological innovations, and growing demand across various therapeutic areas.
Global Pharmaceutical Contract Manufacturing and Research Services Market Report: 2019-2033
This comprehensive report provides a detailed analysis of the global pharmaceutical contract manufacturing and research services market, offering invaluable insights for industry professionals, investors, and strategic decision-makers. The study period spans from 2019 to 2033, with 2025 serving as the base and estimated year. The forecast period covers 2025-2033, while the historical period encompasses 2019-2024. The market is segmented by Manufacturing Services (API/Bulk Drugs, Advanced Drug Delivery Formulations, Packaging, Finished Dose Formulations) and Research Services (Oncology, Vaccines, Inflammation and Immunology, Cardiology, Neuroscience, Other Research Services). Key players analyzed include Labcorp Drug Development, Baxter BioPharma, Evonik Industries AG, Boehringer Ingelheim Biopharmaceuticals GmbH, Symbiosis Pharmaceutical Services, Aurigene Pharmaceutical Services Ltd, Piramal Pharma Solutions, Thermo Fisher Scientific (PPD Inc.), AbbVie, Dalton Pharma Services, Sterling Pharma Solutions, and Lonza AG.
Global Pharmaceutical Contract Manufacturing and Research Services Market Dynamics & Structure
The global pharmaceutical contract manufacturing and research services market is characterized by moderate concentration, with a few large players dominating alongside numerous smaller, specialized firms. Technological innovation, particularly in areas like advanced drug delivery systems and personalized medicine, is a key driver. Stringent regulatory frameworks (e.g., FDA guidelines, GMP compliance) significantly influence market operations. The market faces competitive pressure from generic drug manufacturers and the increasing adoption of in-house capabilities by some pharmaceutical companies. Mergers and acquisitions (M&A) activity is prevalent, with larger companies seeking to expand their service portfolios and geographic reach.
- Market Concentration: Moderately concentrated, with the top 10 players holding an estimated xx% market share in 2025.
- Technological Innovation: Significant advancements in drug delivery systems, analytical technologies, and AI-driven research are driving growth.
- Regulatory Landscape: Stringent regulations increase compliance costs but ensure quality and safety.
- M&A Activity: A significant number of M&A deals (xx deals in 2024) are observed, indicating consolidation trends.
- Competitive Landscape: Intense competition exists among established players and emerging contract research organizations (CROs).
Global Pharmaceutical Contract Manufacturing and Research Services Growth Trends & Insights
The global pharmaceutical contract manufacturing and research services market experienced substantial growth during the historical period (2019-2024), driven by the increasing outsourcing of drug development and manufacturing activities by pharmaceutical companies. The market size expanded from xx million in 2019 to xx million in 2024, registering a CAGR of xx%. This trend is expected to continue during the forecast period (2025-2033), with the market size projected to reach xx million by 2033, exhibiting a CAGR of xx%. Technological advancements, such as the increasing adoption of automation and digitalization in manufacturing processes, coupled with rising demand for specialized research services, are major contributors to market growth. Shifting consumer preferences towards innovative therapies and personalized medicine are also fueling market expansion. The market penetration rate for contract manufacturing services is expected to increase from xx% in 2025 to xx% by 2033. Technological disruptions, like the application of AI and machine learning in drug discovery, are further accelerating market transformation.
Dominant Regions, Countries, or Segments in Global Pharmaceutical Contract Manufacturing and Research Services
The global pharmaceutical contract manufacturing and research services (CMR) market is a dynamic landscape shaped by regional strengths and specialized segments. North America currently holds the largest market share, fueled by a robust pharmaceutical industry, advanced infrastructure, substantial R&D investment, and the presence of numerous leading Contract Research Organizations (CROs). Within manufacturing, Finished Dose Formulations and Active Pharmaceutical Ingredient (API)/Bulk Drug manufacturing segments are particularly dominant. Simultaneously, the Research Services sector witnesses Oncology and Vaccine development as leading areas of focus.
- North America: A dominant force due to its advanced infrastructure, significant R&D investment, and a high concentration of major CROs and pharmaceutical companies.
- Europe: Maintains a strong presence, driven by established pharmaceutical companies, robust research institutions, and a history of pharmaceutical innovation.
- Asia Pacific: Experiencing the fastest growth, propelled by increasing healthcare spending, a rising demand for affordable medications, and a growing middle class.
- Dominant Segments (Manufacturing): Finished Dose Formulations and API/Bulk Drugs represent substantial market shares, reflecting the high demand for these essential components of pharmaceutical products.
- Dominant Segments (Research): Oncology and Vaccines are leading areas of research, driven by significant unmet medical needs and substantial investment in these therapeutic areas.
- Key Drivers: Favorable regulatory environments, robust healthcare infrastructure, and substantial, ongoing investments in research and development are crucial factors in market growth.
Global Pharmaceutical Contract Manufacturing and Research Services Product Landscape
The market offers a wide range of products and services, including API synthesis, formulation development, packaging solutions, analytical testing, clinical trial management, and regulatory support. Recent innovations include advanced drug delivery systems (e.g., liposomes, nanoparticles), personalized medicine solutions, and automation technologies. These advancements improve drug efficacy, reduce manufacturing costs, and enhance patient outcomes. Unique selling propositions for leading players often include specialized expertise, technological capabilities, and strong regulatory compliance track records.
Key Drivers, Barriers & Challenges in Global Pharmaceutical Contract Manufacturing and Research Services
Key Drivers: The CMR market is propelled by several key factors including: the increasing outsourcing of R&D by large pharmaceutical companies seeking cost efficiencies and specialized expertise; the growing demand for specialized therapies, such as cell and gene therapies and personalized medicines; significant technological advancements in drug development and manufacturing; and supportive government policies that encourage innovation and investment within the pharmaceutical industry.
Challenges: The industry faces significant hurdles. Stringent regulatory requirements, leading to high compliance costs, present a major challenge. Supply chain vulnerabilities and fluctuations in raw material prices pose ongoing risks to production and profitability. Intense competition, both from established players and emerging CROs, creates pressure on pricing and margins. Finally, the substantial average cost of bringing a new drug to market – encompassing research, development, manufacturing, and testing – creates a significant barrier to entry for smaller companies.
Emerging Opportunities in Global Pharmaceutical Contract Manufacturing and Research Services
Despite the challenges, the CMR market presents compelling opportunities. Untapped markets in emerging economies represent significant potential for growth. The increasing demand for advanced therapies such as cell and gene therapies, the rise of personalized medicine, and the expanding role of digitalization in clinical trials are creating new avenues for innovation and expansion. Key focus areas for future growth include biologics manufacturing, advanced analytics utilizing big data, and the application of artificial intelligence (AI) in drug discovery and development.
Growth Accelerators in the Global Pharmaceutical Contract Manufacturing and Research Services Industry
Several factors are accelerating growth within the CMR industry. Strategic partnerships between contract manufacturers and pharmaceutical companies foster collaboration and innovation. Technological advancements, such as automation and AI-driven processes, are enhancing efficiency and productivity. Geographic expansion into emerging markets is opening new avenues for growth. Furthermore, investments in innovative technologies such as continuous manufacturing and process analytical technology (PAT) are driving efficiency gains and improving product quality.
Key Players Shaping the Global Pharmaceutical Contract Manufacturing and Research Services Market
- Labcorp Drug Development
- Baxter BioPharma
- Evonik Industries AG
- Boehringer Ingelheim Biopharmaceuticals GmbH
- Symbiosis Pharmaceutical Services
- Aurigene Pharmaceutical Services Ltd
- Piramal Pharma Solutions
- Thermo Fisher Scientific (PPD Inc.)
- AbbVie
- Dalton Pharma Services
- Sterling Pharma Solutions
- Lonza AG
Notable Milestones in Global Pharmaceutical Contract Manufacturing and Research Services Sector
- 2021: Significant investment in digitalization by leading CROs, transforming data management and analysis within the drug development process.
- 2022: A wave of mergers and acquisitions (M&A) activity reshaped the market landscape, consolidating market share and driving further innovation.
- 2023: The launch of several innovative drug delivery platforms by key players, improving patient outcomes and treatment adherence.
- 2024: Increased adoption of AI in drug discovery and development, accelerating the identification and development of new therapies.
- Ongoing Trends: Continued focus on sustainability, increasing demand for specialized services (e.g., aseptic manufacturing), and the integration of advanced technologies will continue to shape the industry’s trajectory.
In-Depth Global Pharmaceutical Contract Manufacturing and Research Services Market Outlook
The global pharmaceutical contract manufacturing and research services market is poised for continued growth, driven by factors such as increasing R&D outsourcing, technological advancements, and the rise of innovative therapies. Strategic partnerships, investments in capacity expansion, and focusing on emerging markets will be crucial for companies to capitalize on future opportunities. The market's future success hinges on adaptability, innovation, and a commitment to high-quality services.
Global Pharmaceutical Contract Manufacturing and Research Services Segmentation
-
1. Manufacturing Services
- 1.1. API/Bulk Drugs
- 1.2. Advanced Drug Delivery Formulations Packaging
- 1.3. Finished Dose Formulations
-
2. Research Services
- 2.1. Oncology
- 2.2. Vaccines
- 2.3. Inflammation and Immunology
- 2.4. Cardiology
- 2.5. Neuroscience
- 2.6. Other Research Services
Global Pharmaceutical Contract Manufacturing and Research Services Segmentation By Geography
-
1. North America
- 1.1. United States
- 1.2. Canada
- 1.3. Mexico
-
2. Europe
- 2.1. Germany
- 2.2. United Kingdom
- 2.3. France
- 2.4. Italy
- 2.5. Spain
- 2.6. Rest of Europe
-
3. Asia Pacific
- 3.1. China
- 3.2. Japan
- 3.3. India
- 3.4. Australia
- 3.5. South Korea
- 3.6. Rest of Asia Pacific
-
4. Middle East and Africa
- 4.1. GCC
- 4.2. South Africa
- 4.3. Rest of Middle East and Africa
-
5. South America
- 5.1. Brazil
- 5.2. Argentina
- 5.3. Rest of South America
Global Pharmaceutical Contract Manufacturing and Research Services REPORT HIGHLIGHTS
| Aspects | Details |
|---|---|
| Study Period | 2019-2033 |
| Base Year | 2024 |
| Estimated Year | 2025 |
| Forecast Period | 2025-2033 |
| Historical Period | 2019-2024 |
| Growth Rate | CAGR of 7.00% from 2019-2033 |
| Segmentation |
|
Table of Contents
- 1. Introduction
- 1.1. Research Scope
- 1.2. Market Segmentation
- 1.3. Research Methodology
- 1.4. Definitions and Assumptions
- 2. Executive Summary
- 2.1. Introduction
- 3. Market Dynamics
- 3.1. Introduction
- 3.2. Market Drivers
- 3.2.1. Growing Demand To Develop Pharmaceutical Drugs; Low Manufacturing Cost And Improving Economic Condition of Developing Countries; Rising Use of Biologics
- 3.3. Market Restrains
- 3.3.1. Regulatory Issues Pertaining to the Drug Approval; Limited Outsourcing Opted by Pharmaceutical Companies
- 3.4. Market Trends
- 3.4.1. Oncology Segment is Expected to Hold a Major Market Share in the Pharmaceutical Contract Manufacturing and Research Services Market
- 4. Market Factor Analysis
- 4.1. Porters Five Forces
- 4.2. Supply/Value Chain
- 4.3. PESTEL analysis
- 4.4. Market Entropy
- 4.5. Patent/Trademark Analysis
- 5. Global Pharmaceutical Contract Manufacturing and Research Services Analysis, Insights and Forecast, 2019-2031
- 5.1. Market Analysis, Insights and Forecast - by Manufacturing Services
- 5.1.1. API/Bulk Drugs
- 5.1.2. Advanced Drug Delivery Formulations Packaging
- 5.1.3. Finished Dose Formulations
- 5.2. Market Analysis, Insights and Forecast - by Research Services
- 5.2.1. Oncology
- 5.2.2. Vaccines
- 5.2.3. Inflammation and Immunology
- 5.2.4. Cardiology
- 5.2.5. Neuroscience
- 5.2.6. Other Research Services
- 5.3. Market Analysis, Insights and Forecast - by Region
- 5.3.1. North America
- 5.3.2. Europe
- 5.3.3. Asia Pacific
- 5.3.4. Middle East and Africa
- 5.3.5. South America
- 5.1. Market Analysis, Insights and Forecast - by Manufacturing Services
- 6. North America Global Pharmaceutical Contract Manufacturing and Research Services Analysis, Insights and Forecast, 2019-2031
- 6.1. Market Analysis, Insights and Forecast - by Manufacturing Services
- 6.1.1. API/Bulk Drugs
- 6.1.2. Advanced Drug Delivery Formulations Packaging
- 6.1.3. Finished Dose Formulations
- 6.2. Market Analysis, Insights and Forecast - by Research Services
- 6.2.1. Oncology
- 6.2.2. Vaccines
- 6.2.3. Inflammation and Immunology
- 6.2.4. Cardiology
- 6.2.5. Neuroscience
- 6.2.6. Other Research Services
- 6.1. Market Analysis, Insights and Forecast - by Manufacturing Services
- 7. Europe Global Pharmaceutical Contract Manufacturing and Research Services Analysis, Insights and Forecast, 2019-2031
- 7.1. Market Analysis, Insights and Forecast - by Manufacturing Services
- 7.1.1. API/Bulk Drugs
- 7.1.2. Advanced Drug Delivery Formulations Packaging
- 7.1.3. Finished Dose Formulations
- 7.2. Market Analysis, Insights and Forecast - by Research Services
- 7.2.1. Oncology
- 7.2.2. Vaccines
- 7.2.3. Inflammation and Immunology
- 7.2.4. Cardiology
- 7.2.5. Neuroscience
- 7.2.6. Other Research Services
- 7.1. Market Analysis, Insights and Forecast - by Manufacturing Services
- 8. Asia Pacific Global Pharmaceutical Contract Manufacturing and Research Services Analysis, Insights and Forecast, 2019-2031
- 8.1. Market Analysis, Insights and Forecast - by Manufacturing Services
- 8.1.1. API/Bulk Drugs
- 8.1.2. Advanced Drug Delivery Formulations Packaging
- 8.1.3. Finished Dose Formulations
- 8.2. Market Analysis, Insights and Forecast - by Research Services
- 8.2.1. Oncology
- 8.2.2. Vaccines
- 8.2.3. Inflammation and Immunology
- 8.2.4. Cardiology
- 8.2.5. Neuroscience
- 8.2.6. Other Research Services
- 8.1. Market Analysis, Insights and Forecast - by Manufacturing Services
- 9. Middle East and Africa Global Pharmaceutical Contract Manufacturing and Research Services Analysis, Insights and Forecast, 2019-2031
- 9.1. Market Analysis, Insights and Forecast - by Manufacturing Services
- 9.1.1. API/Bulk Drugs
- 9.1.2. Advanced Drug Delivery Formulations Packaging
- 9.1.3. Finished Dose Formulations
- 9.2. Market Analysis, Insights and Forecast - by Research Services
- 9.2.1. Oncology
- 9.2.2. Vaccines
- 9.2.3. Inflammation and Immunology
- 9.2.4. Cardiology
- 9.2.5. Neuroscience
- 9.2.6. Other Research Services
- 9.1. Market Analysis, Insights and Forecast - by Manufacturing Services
- 10. South America Global Pharmaceutical Contract Manufacturing and Research Services Analysis, Insights and Forecast, 2019-2031
- 10.1. Market Analysis, Insights and Forecast - by Manufacturing Services
- 10.1.1. API/Bulk Drugs
- 10.1.2. Advanced Drug Delivery Formulations Packaging
- 10.1.3. Finished Dose Formulations
- 10.2. Market Analysis, Insights and Forecast - by Research Services
- 10.2.1. Oncology
- 10.2.2. Vaccines
- 10.2.3. Inflammation and Immunology
- 10.2.4. Cardiology
- 10.2.5. Neuroscience
- 10.2.6. Other Research Services
- 10.1. Market Analysis, Insights and Forecast - by Manufacturing Services
- 11. North America Global Pharmaceutical Contract Manufacturing and Research Services Analysis, Insights and Forecast, 2019-2031
- 11.1. Market Analysis, Insights and Forecast - By Country/Sub-region
- 11.1.1 United States
- 11.1.2 Canada
- 11.1.3 Mexico
- 12. Europe Global Pharmaceutical Contract Manufacturing and Research Services Analysis, Insights and Forecast, 2019-2031
- 12.1. Market Analysis, Insights and Forecast - By Country/Sub-region
- 12.1.1 Germany
- 12.1.2 United Kingdom
- 12.1.3 France
- 12.1.4 Italy
- 12.1.5 Spain
- 12.1.6 Rest of Europe
- 13. Asia Pacific Global Pharmaceutical Contract Manufacturing and Research Services Analysis, Insights and Forecast, 2019-2031
- 13.1. Market Analysis, Insights and Forecast - By Country/Sub-region
- 13.1.1 China
- 13.1.2 Japan
- 13.1.3 India
- 13.1.4 Australia
- 13.1.5 South Korea
- 13.1.6 Rest of Asia Pacific
- 14. Middle East and Africa Global Pharmaceutical Contract Manufacturing and Research Services Analysis, Insights and Forecast, 2019-2031
- 14.1. Market Analysis, Insights and Forecast - By Country/Sub-region
- 14.1.1 GCC
- 14.1.2 South Africa
- 14.1.3 Rest of Middle East and Africa
- 15. South America Global Pharmaceutical Contract Manufacturing and Research Services Analysis, Insights and Forecast, 2019-2031
- 15.1. Market Analysis, Insights and Forecast - By Country/Sub-region
- 15.1.1 Brazil
- 15.1.2 Argentina
- 15.1.3 Rest of South America
- 16. Competitive Analysis
- 16.1. Market Share Analysis 2024
- 16.2. Company Profiles
- 16.2.1 Labcorp Drug Development
- 16.2.1.1. Overview
- 16.2.1.2. Products
- 16.2.1.3. SWOT Analysis
- 16.2.1.4. Recent Developments
- 16.2.1.5. Financials (Based on Availability)
- 16.2.2 Baxter BioPharma
- 16.2.2.1. Overview
- 16.2.2.2. Products
- 16.2.2.3. SWOT Analysis
- 16.2.2.4. Recent Developments
- 16.2.2.5. Financials (Based on Availability)
- 16.2.3 Evonik Industries AG
- 16.2.3.1. Overview
- 16.2.3.2. Products
- 16.2.3.3. SWOT Analysis
- 16.2.3.4. Recent Developments
- 16.2.3.5. Financials (Based on Availability)
- 16.2.4 Boehringer Ingelheim Biopharmaceuticals GmbH
- 16.2.4.1. Overview
- 16.2.4.2. Products
- 16.2.4.3. SWOT Analysis
- 16.2.4.4. Recent Developments
- 16.2.4.5. Financials (Based on Availability)
- 16.2.5 Symbiosis Pharmaceutical Services
- 16.2.5.1. Overview
- 16.2.5.2. Products
- 16.2.5.3. SWOT Analysis
- 16.2.5.4. Recent Developments
- 16.2.5.5. Financials (Based on Availability)
- 16.2.6 Aurigene Pharmaceutical Services Ltd
- 16.2.6.1. Overview
- 16.2.6.2. Products
- 16.2.6.3. SWOT Analysis
- 16.2.6.4. Recent Developments
- 16.2.6.5. Financials (Based on Availability)
- 16.2.7 Piramal Pharma Solutions
- 16.2.7.1. Overview
- 16.2.7.2. Products
- 16.2.7.3. SWOT Analysis
- 16.2.7.4. Recent Developments
- 16.2.7.5. Financials (Based on Availability)
- 16.2.8 Thermo Fisher Scientific (PPD Inc )
- 16.2.8.1. Overview
- 16.2.8.2. Products
- 16.2.8.3. SWOT Analysis
- 16.2.8.4. Recent Developments
- 16.2.8.5. Financials (Based on Availability)
- 16.2.9 AbbVie
- 16.2.9.1. Overview
- 16.2.9.2. Products
- 16.2.9.3. SWOT Analysis
- 16.2.9.4. Recent Developments
- 16.2.9.5. Financials (Based on Availability)
- 16.2.10 Dalton Pharma Services
- 16.2.10.1. Overview
- 16.2.10.2. Products
- 16.2.10.3. SWOT Analysis
- 16.2.10.4. Recent Developments
- 16.2.10.5. Financials (Based on Availability)
- 16.2.11 Sterling Pharma Solutions
- 16.2.11.1. Overview
- 16.2.11.2. Products
- 16.2.11.3. SWOT Analysis
- 16.2.11.4. Recent Developments
- 16.2.11.5. Financials (Based on Availability)
- 16.2.12 Lonza AG
- 16.2.12.1. Overview
- 16.2.12.2. Products
- 16.2.12.3. SWOT Analysis
- 16.2.12.4. Recent Developments
- 16.2.12.5. Financials (Based on Availability)
- 16.2.1 Labcorp Drug Development
List of Figures
- Figure 1: Global Global Pharmaceutical Contract Manufacturing and Research Services Revenue Breakdown (Million, %) by Region 2024 & 2032
- Figure 2: Global Global Pharmaceutical Contract Manufacturing and Research Services Volume Breakdown (K Unit, %) by Region 2024 & 2032
- Figure 3: North America Global Pharmaceutical Contract Manufacturing and Research Services Revenue (Million), by Country 2024 & 2032
- Figure 4: North America Global Pharmaceutical Contract Manufacturing and Research Services Volume (K Unit), by Country 2024 & 2032
- Figure 5: North America Global Pharmaceutical Contract Manufacturing and Research Services Revenue Share (%), by Country 2024 & 2032
- Figure 6: North America Global Pharmaceutical Contract Manufacturing and Research Services Volume Share (%), by Country 2024 & 2032
- Figure 7: Europe Global Pharmaceutical Contract Manufacturing and Research Services Revenue (Million), by Country 2024 & 2032
- Figure 8: Europe Global Pharmaceutical Contract Manufacturing and Research Services Volume (K Unit), by Country 2024 & 2032
- Figure 9: Europe Global Pharmaceutical Contract Manufacturing and Research Services Revenue Share (%), by Country 2024 & 2032
- Figure 10: Europe Global Pharmaceutical Contract Manufacturing and Research Services Volume Share (%), by Country 2024 & 2032
- Figure 11: Asia Pacific Global Pharmaceutical Contract Manufacturing and Research Services Revenue (Million), by Country 2024 & 2032
- Figure 12: Asia Pacific Global Pharmaceutical Contract Manufacturing and Research Services Volume (K Unit), by Country 2024 & 2032
- Figure 13: Asia Pacific Global Pharmaceutical Contract Manufacturing and Research Services Revenue Share (%), by Country 2024 & 2032
- Figure 14: Asia Pacific Global Pharmaceutical Contract Manufacturing and Research Services Volume Share (%), by Country 2024 & 2032
- Figure 15: Middle East and Africa Global Pharmaceutical Contract Manufacturing and Research Services Revenue (Million), by Country 2024 & 2032
- Figure 16: Middle East and Africa Global Pharmaceutical Contract Manufacturing and Research Services Volume (K Unit), by Country 2024 & 2032
- Figure 17: Middle East and Africa Global Pharmaceutical Contract Manufacturing and Research Services Revenue Share (%), by Country 2024 & 2032
- Figure 18: Middle East and Africa Global Pharmaceutical Contract Manufacturing and Research Services Volume Share (%), by Country 2024 & 2032
- Figure 19: South America Global Pharmaceutical Contract Manufacturing and Research Services Revenue (Million), by Country 2024 & 2032
- Figure 20: South America Global Pharmaceutical Contract Manufacturing and Research Services Volume (K Unit), by Country 2024 & 2032
- Figure 21: South America Global Pharmaceutical Contract Manufacturing and Research Services Revenue Share (%), by Country 2024 & 2032
- Figure 22: South America Global Pharmaceutical Contract Manufacturing and Research Services Volume Share (%), by Country 2024 & 2032
- Figure 23: North America Global Pharmaceutical Contract Manufacturing and Research Services Revenue (Million), by Manufacturing Services 2024 & 2032
- Figure 24: North America Global Pharmaceutical Contract Manufacturing and Research Services Volume (K Unit), by Manufacturing Services 2024 & 2032
- Figure 25: North America Global Pharmaceutical Contract Manufacturing and Research Services Revenue Share (%), by Manufacturing Services 2024 & 2032
- Figure 26: North America Global Pharmaceutical Contract Manufacturing and Research Services Volume Share (%), by Manufacturing Services 2024 & 2032
- Figure 27: North America Global Pharmaceutical Contract Manufacturing and Research Services Revenue (Million), by Research Services 2024 & 2032
- Figure 28: North America Global Pharmaceutical Contract Manufacturing and Research Services Volume (K Unit), by Research Services 2024 & 2032
- Figure 29: North America Global Pharmaceutical Contract Manufacturing and Research Services Revenue Share (%), by Research Services 2024 & 2032
- Figure 30: North America Global Pharmaceutical Contract Manufacturing and Research Services Volume Share (%), by Research Services 2024 & 2032
- Figure 31: North America Global Pharmaceutical Contract Manufacturing and Research Services Revenue (Million), by Country 2024 & 2032
- Figure 32: North America Global Pharmaceutical Contract Manufacturing and Research Services Volume (K Unit), by Country 2024 & 2032
- Figure 33: North America Global Pharmaceutical Contract Manufacturing and Research Services Revenue Share (%), by Country 2024 & 2032
- Figure 34: North America Global Pharmaceutical Contract Manufacturing and Research Services Volume Share (%), by Country 2024 & 2032
- Figure 35: Europe Global Pharmaceutical Contract Manufacturing and Research Services Revenue (Million), by Manufacturing Services 2024 & 2032
- Figure 36: Europe Global Pharmaceutical Contract Manufacturing and Research Services Volume (K Unit), by Manufacturing Services 2024 & 2032
- Figure 37: Europe Global Pharmaceutical Contract Manufacturing and Research Services Revenue Share (%), by Manufacturing Services 2024 & 2032
- Figure 38: Europe Global Pharmaceutical Contract Manufacturing and Research Services Volume Share (%), by Manufacturing Services 2024 & 2032
- Figure 39: Europe Global Pharmaceutical Contract Manufacturing and Research Services Revenue (Million), by Research Services 2024 & 2032
- Figure 40: Europe Global Pharmaceutical Contract Manufacturing and Research Services Volume (K Unit), by Research Services 2024 & 2032
- Figure 41: Europe Global Pharmaceutical Contract Manufacturing and Research Services Revenue Share (%), by Research Services 2024 & 2032
- Figure 42: Europe Global Pharmaceutical Contract Manufacturing and Research Services Volume Share (%), by Research Services 2024 & 2032
- Figure 43: Europe Global Pharmaceutical Contract Manufacturing and Research Services Revenue (Million), by Country 2024 & 2032
- Figure 44: Europe Global Pharmaceutical Contract Manufacturing and Research Services Volume (K Unit), by Country 2024 & 2032
- Figure 45: Europe Global Pharmaceutical Contract Manufacturing and Research Services Revenue Share (%), by Country 2024 & 2032
- Figure 46: Europe Global Pharmaceutical Contract Manufacturing and Research Services Volume Share (%), by Country 2024 & 2032
- Figure 47: Asia Pacific Global Pharmaceutical Contract Manufacturing and Research Services Revenue (Million), by Manufacturing Services 2024 & 2032
- Figure 48: Asia Pacific Global Pharmaceutical Contract Manufacturing and Research Services Volume (K Unit), by Manufacturing Services 2024 & 2032
- Figure 49: Asia Pacific Global Pharmaceutical Contract Manufacturing and Research Services Revenue Share (%), by Manufacturing Services 2024 & 2032
- Figure 50: Asia Pacific Global Pharmaceutical Contract Manufacturing and Research Services Volume Share (%), by Manufacturing Services 2024 & 2032
- Figure 51: Asia Pacific Global Pharmaceutical Contract Manufacturing and Research Services Revenue (Million), by Research Services 2024 & 2032
- Figure 52: Asia Pacific Global Pharmaceutical Contract Manufacturing and Research Services Volume (K Unit), by Research Services 2024 & 2032
- Figure 53: Asia Pacific Global Pharmaceutical Contract Manufacturing and Research Services Revenue Share (%), by Research Services 2024 & 2032
- Figure 54: Asia Pacific Global Pharmaceutical Contract Manufacturing and Research Services Volume Share (%), by Research Services 2024 & 2032
- Figure 55: Asia Pacific Global Pharmaceutical Contract Manufacturing and Research Services Revenue (Million), by Country 2024 & 2032
- Figure 56: Asia Pacific Global Pharmaceutical Contract Manufacturing and Research Services Volume (K Unit), by Country 2024 & 2032
- Figure 57: Asia Pacific Global Pharmaceutical Contract Manufacturing and Research Services Revenue Share (%), by Country 2024 & 2032
- Figure 58: Asia Pacific Global Pharmaceutical Contract Manufacturing and Research Services Volume Share (%), by Country 2024 & 2032
- Figure 59: Middle East and Africa Global Pharmaceutical Contract Manufacturing and Research Services Revenue (Million), by Manufacturing Services 2024 & 2032
- Figure 60: Middle East and Africa Global Pharmaceutical Contract Manufacturing and Research Services Volume (K Unit), by Manufacturing Services 2024 & 2032
- Figure 61: Middle East and Africa Global Pharmaceutical Contract Manufacturing and Research Services Revenue Share (%), by Manufacturing Services 2024 & 2032
- Figure 62: Middle East and Africa Global Pharmaceutical Contract Manufacturing and Research Services Volume Share (%), by Manufacturing Services 2024 & 2032
- Figure 63: Middle East and Africa Global Pharmaceutical Contract Manufacturing and Research Services Revenue (Million), by Research Services 2024 & 2032
- Figure 64: Middle East and Africa Global Pharmaceutical Contract Manufacturing and Research Services Volume (K Unit), by Research Services 2024 & 2032
- Figure 65: Middle East and Africa Global Pharmaceutical Contract Manufacturing and Research Services Revenue Share (%), by Research Services 2024 & 2032
- Figure 66: Middle East and Africa Global Pharmaceutical Contract Manufacturing and Research Services Volume Share (%), by Research Services 2024 & 2032
- Figure 67: Middle East and Africa Global Pharmaceutical Contract Manufacturing and Research Services Revenue (Million), by Country 2024 & 2032
- Figure 68: Middle East and Africa Global Pharmaceutical Contract Manufacturing and Research Services Volume (K Unit), by Country 2024 & 2032
- Figure 69: Middle East and Africa Global Pharmaceutical Contract Manufacturing and Research Services Revenue Share (%), by Country 2024 & 2032
- Figure 70: Middle East and Africa Global Pharmaceutical Contract Manufacturing and Research Services Volume Share (%), by Country 2024 & 2032
- Figure 71: South America Global Pharmaceutical Contract Manufacturing and Research Services Revenue (Million), by Manufacturing Services 2024 & 2032
- Figure 72: South America Global Pharmaceutical Contract Manufacturing and Research Services Volume (K Unit), by Manufacturing Services 2024 & 2032
- Figure 73: South America Global Pharmaceutical Contract Manufacturing and Research Services Revenue Share (%), by Manufacturing Services 2024 & 2032
- Figure 74: South America Global Pharmaceutical Contract Manufacturing and Research Services Volume Share (%), by Manufacturing Services 2024 & 2032
- Figure 75: South America Global Pharmaceutical Contract Manufacturing and Research Services Revenue (Million), by Research Services 2024 & 2032
- Figure 76: South America Global Pharmaceutical Contract Manufacturing and Research Services Volume (K Unit), by Research Services 2024 & 2032
- Figure 77: South America Global Pharmaceutical Contract Manufacturing and Research Services Revenue Share (%), by Research Services 2024 & 2032
- Figure 78: South America Global Pharmaceutical Contract Manufacturing and Research Services Volume Share (%), by Research Services 2024 & 2032
- Figure 79: South America Global Pharmaceutical Contract Manufacturing and Research Services Revenue (Million), by Country 2024 & 2032
- Figure 80: South America Global Pharmaceutical Contract Manufacturing and Research Services Volume (K Unit), by Country 2024 & 2032
- Figure 81: South America Global Pharmaceutical Contract Manufacturing and Research Services Revenue Share (%), by Country 2024 & 2032
- Figure 82: South America Global Pharmaceutical Contract Manufacturing and Research Services Volume Share (%), by Country 2024 & 2032
List of Tables
- Table 1: Global Pharmaceutical Contract Manufacturing and Research Services Revenue Million Forecast, by Region 2019 & 2032
- Table 2: Global Pharmaceutical Contract Manufacturing and Research Services Volume K Unit Forecast, by Region 2019 & 2032
- Table 3: Global Pharmaceutical Contract Manufacturing and Research Services Revenue Million Forecast, by Manufacturing Services 2019 & 2032
- Table 4: Global Pharmaceutical Contract Manufacturing and Research Services Volume K Unit Forecast, by Manufacturing Services 2019 & 2032
- Table 5: Global Pharmaceutical Contract Manufacturing and Research Services Revenue Million Forecast, by Research Services 2019 & 2032
- Table 6: Global Pharmaceutical Contract Manufacturing and Research Services Volume K Unit Forecast, by Research Services 2019 & 2032
- Table 7: Global Pharmaceutical Contract Manufacturing and Research Services Revenue Million Forecast, by Region 2019 & 2032
- Table 8: Global Pharmaceutical Contract Manufacturing and Research Services Volume K Unit Forecast, by Region 2019 & 2032
- Table 9: Global Pharmaceutical Contract Manufacturing and Research Services Revenue Million Forecast, by Country 2019 & 2032
- Table 10: Global Pharmaceutical Contract Manufacturing and Research Services Volume K Unit Forecast, by Country 2019 & 2032
- Table 11: United States Global Pharmaceutical Contract Manufacturing and Research Services Revenue (Million) Forecast, by Application 2019 & 2032
- Table 12: United States Global Pharmaceutical Contract Manufacturing and Research Services Volume (K Unit) Forecast, by Application 2019 & 2032
- Table 13: Canada Global Pharmaceutical Contract Manufacturing and Research Services Revenue (Million) Forecast, by Application 2019 & 2032
- Table 14: Canada Global Pharmaceutical Contract Manufacturing and Research Services Volume (K Unit) Forecast, by Application 2019 & 2032
- Table 15: Mexico Global Pharmaceutical Contract Manufacturing and Research Services Revenue (Million) Forecast, by Application 2019 & 2032
- Table 16: Mexico Global Pharmaceutical Contract Manufacturing and Research Services Volume (K Unit) Forecast, by Application 2019 & 2032
- Table 17: Global Pharmaceutical Contract Manufacturing and Research Services Revenue Million Forecast, by Country 2019 & 2032
- Table 18: Global Pharmaceutical Contract Manufacturing and Research Services Volume K Unit Forecast, by Country 2019 & 2032
- Table 19: Germany Global Pharmaceutical Contract Manufacturing and Research Services Revenue (Million) Forecast, by Application 2019 & 2032
- Table 20: Germany Global Pharmaceutical Contract Manufacturing and Research Services Volume (K Unit) Forecast, by Application 2019 & 2032
- Table 21: United Kingdom Global Pharmaceutical Contract Manufacturing and Research Services Revenue (Million) Forecast, by Application 2019 & 2032
- Table 22: United Kingdom Global Pharmaceutical Contract Manufacturing and Research Services Volume (K Unit) Forecast, by Application 2019 & 2032
- Table 23: France Global Pharmaceutical Contract Manufacturing and Research Services Revenue (Million) Forecast, by Application 2019 & 2032
- Table 24: France Global Pharmaceutical Contract Manufacturing and Research Services Volume (K Unit) Forecast, by Application 2019 & 2032
- Table 25: Italy Global Pharmaceutical Contract Manufacturing and Research Services Revenue (Million) Forecast, by Application 2019 & 2032
- Table 26: Italy Global Pharmaceutical Contract Manufacturing and Research Services Volume (K Unit) Forecast, by Application 2019 & 2032
- Table 27: Spain Global Pharmaceutical Contract Manufacturing and Research Services Revenue (Million) Forecast, by Application 2019 & 2032
- Table 28: Spain Global Pharmaceutical Contract Manufacturing and Research Services Volume (K Unit) Forecast, by Application 2019 & 2032
- Table 29: Rest of Europe Global Pharmaceutical Contract Manufacturing and Research Services Revenue (Million) Forecast, by Application 2019 & 2032
- Table 30: Rest of Europe Global Pharmaceutical Contract Manufacturing and Research Services Volume (K Unit) Forecast, by Application 2019 & 2032
- Table 31: Global Pharmaceutical Contract Manufacturing and Research Services Revenue Million Forecast, by Country 2019 & 2032
- Table 32: Global Pharmaceutical Contract Manufacturing and Research Services Volume K Unit Forecast, by Country 2019 & 2032
- Table 33: China Global Pharmaceutical Contract Manufacturing and Research Services Revenue (Million) Forecast, by Application 2019 & 2032
- Table 34: China Global Pharmaceutical Contract Manufacturing and Research Services Volume (K Unit) Forecast, by Application 2019 & 2032
- Table 35: Japan Global Pharmaceutical Contract Manufacturing and Research Services Revenue (Million) Forecast, by Application 2019 & 2032
- Table 36: Japan Global Pharmaceutical Contract Manufacturing and Research Services Volume (K Unit) Forecast, by Application 2019 & 2032
- Table 37: India Global Pharmaceutical Contract Manufacturing and Research Services Revenue (Million) Forecast, by Application 2019 & 2032
- Table 38: India Global Pharmaceutical Contract Manufacturing and Research Services Volume (K Unit) Forecast, by Application 2019 & 2032
- Table 39: Australia Global Pharmaceutical Contract Manufacturing and Research Services Revenue (Million) Forecast, by Application 2019 & 2032
- Table 40: Australia Global Pharmaceutical Contract Manufacturing and Research Services Volume (K Unit) Forecast, by Application 2019 & 2032
- Table 41: South Korea Global Pharmaceutical Contract Manufacturing and Research Services Revenue (Million) Forecast, by Application 2019 & 2032
- Table 42: South Korea Global Pharmaceutical Contract Manufacturing and Research Services Volume (K Unit) Forecast, by Application 2019 & 2032
- Table 43: Rest of Asia Pacific Global Pharmaceutical Contract Manufacturing and Research Services Revenue (Million) Forecast, by Application 2019 & 2032
- Table 44: Rest of Asia Pacific Global Pharmaceutical Contract Manufacturing and Research Services Volume (K Unit) Forecast, by Application 2019 & 2032
- Table 45: Global Pharmaceutical Contract Manufacturing and Research Services Revenue Million Forecast, by Country 2019 & 2032
- Table 46: Global Pharmaceutical Contract Manufacturing and Research Services Volume K Unit Forecast, by Country 2019 & 2032
- Table 47: GCC Global Pharmaceutical Contract Manufacturing and Research Services Revenue (Million) Forecast, by Application 2019 & 2032
- Table 48: GCC Global Pharmaceutical Contract Manufacturing and Research Services Volume (K Unit) Forecast, by Application 2019 & 2032
- Table 49: South Africa Global Pharmaceutical Contract Manufacturing and Research Services Revenue (Million) Forecast, by Application 2019 & 2032
- Table 50: South Africa Global Pharmaceutical Contract Manufacturing and Research Services Volume (K Unit) Forecast, by Application 2019 & 2032
- Table 51: Rest of Middle East and Africa Global Pharmaceutical Contract Manufacturing and Research Services Revenue (Million) Forecast, by Application 2019 & 2032
- Table 52: Rest of Middle East and Africa Global Pharmaceutical Contract Manufacturing and Research Services Volume (K Unit) Forecast, by Application 2019 & 2032
- Table 53: Global Pharmaceutical Contract Manufacturing and Research Services Revenue Million Forecast, by Country 2019 & 2032
- Table 54: Global Pharmaceutical Contract Manufacturing and Research Services Volume K Unit Forecast, by Country 2019 & 2032
- Table 55: Brazil Global Pharmaceutical Contract Manufacturing and Research Services Revenue (Million) Forecast, by Application 2019 & 2032
- Table 56: Brazil Global Pharmaceutical Contract Manufacturing and Research Services Volume (K Unit) Forecast, by Application 2019 & 2032
- Table 57: Argentina Global Pharmaceutical Contract Manufacturing and Research Services Revenue (Million) Forecast, by Application 2019 & 2032
- Table 58: Argentina Global Pharmaceutical Contract Manufacturing and Research Services Volume (K Unit) Forecast, by Application 2019 & 2032
- Table 59: Rest of South America Global Pharmaceutical Contract Manufacturing and Research Services Revenue (Million) Forecast, by Application 2019 & 2032
- Table 60: Rest of South America Global Pharmaceutical Contract Manufacturing and Research Services Volume (K Unit) Forecast, by Application 2019 & 2032
- Table 61: Global Pharmaceutical Contract Manufacturing and Research Services Revenue Million Forecast, by Manufacturing Services 2019 & 2032
- Table 62: Global Pharmaceutical Contract Manufacturing and Research Services Volume K Unit Forecast, by Manufacturing Services 2019 & 2032
- Table 63: Global Pharmaceutical Contract Manufacturing and Research Services Revenue Million Forecast, by Research Services 2019 & 2032
- Table 64: Global Pharmaceutical Contract Manufacturing and Research Services Volume K Unit Forecast, by Research Services 2019 & 2032
- Table 65: Global Pharmaceutical Contract Manufacturing and Research Services Revenue Million Forecast, by Country 2019 & 2032
- Table 66: Global Pharmaceutical Contract Manufacturing and Research Services Volume K Unit Forecast, by Country 2019 & 2032
- Table 67: United States Global Pharmaceutical Contract Manufacturing and Research Services Revenue (Million) Forecast, by Application 2019 & 2032
- Table 68: United States Global Pharmaceutical Contract Manufacturing and Research Services Volume (K Unit) Forecast, by Application 2019 & 2032
- Table 69: Canada Global Pharmaceutical Contract Manufacturing and Research Services Revenue (Million) Forecast, by Application 2019 & 2032
- Table 70: Canada Global Pharmaceutical Contract Manufacturing and Research Services Volume (K Unit) Forecast, by Application 2019 & 2032
- Table 71: Mexico Global Pharmaceutical Contract Manufacturing and Research Services Revenue (Million) Forecast, by Application 2019 & 2032
- Table 72: Mexico Global Pharmaceutical Contract Manufacturing and Research Services Volume (K Unit) Forecast, by Application 2019 & 2032
- Table 73: Global Pharmaceutical Contract Manufacturing and Research Services Revenue Million Forecast, by Manufacturing Services 2019 & 2032
- Table 74: Global Pharmaceutical Contract Manufacturing and Research Services Volume K Unit Forecast, by Manufacturing Services 2019 & 2032
- Table 75: Global Pharmaceutical Contract Manufacturing and Research Services Revenue Million Forecast, by Research Services 2019 & 2032
- Table 76: Global Pharmaceutical Contract Manufacturing and Research Services Volume K Unit Forecast, by Research Services 2019 & 2032
- Table 77: Global Pharmaceutical Contract Manufacturing and Research Services Revenue Million Forecast, by Country 2019 & 2032
- Table 78: Global Pharmaceutical Contract Manufacturing and Research Services Volume K Unit Forecast, by Country 2019 & 2032
- Table 79: Germany Global Pharmaceutical Contract Manufacturing and Research Services Revenue (Million) Forecast, by Application 2019 & 2032
- Table 80: Germany Global Pharmaceutical Contract Manufacturing and Research Services Volume (K Unit) Forecast, by Application 2019 & 2032
- Table 81: United Kingdom Global Pharmaceutical Contract Manufacturing and Research Services Revenue (Million) Forecast, by Application 2019 & 2032
- Table 82: United Kingdom Global Pharmaceutical Contract Manufacturing and Research Services Volume (K Unit) Forecast, by Application 2019 & 2032
- Table 83: France Global Pharmaceutical Contract Manufacturing and Research Services Revenue (Million) Forecast, by Application 2019 & 2032
- Table 84: France Global Pharmaceutical Contract Manufacturing and Research Services Volume (K Unit) Forecast, by Application 2019 & 2032
- Table 85: Italy Global Pharmaceutical Contract Manufacturing and Research Services Revenue (Million) Forecast, by Application 2019 & 2032
- Table 86: Italy Global Pharmaceutical Contract Manufacturing and Research Services Volume (K Unit) Forecast, by Application 2019 & 2032
- Table 87: Spain Global Pharmaceutical Contract Manufacturing and Research Services Revenue (Million) Forecast, by Application 2019 & 2032
- Table 88: Spain Global Pharmaceutical Contract Manufacturing and Research Services Volume (K Unit) Forecast, by Application 2019 & 2032
- Table 89: Rest of Europe Global Pharmaceutical Contract Manufacturing and Research Services Revenue (Million) Forecast, by Application 2019 & 2032
- Table 90: Rest of Europe Global Pharmaceutical Contract Manufacturing and Research Services Volume (K Unit) Forecast, by Application 2019 & 2032
- Table 91: Global Pharmaceutical Contract Manufacturing and Research Services Revenue Million Forecast, by Manufacturing Services 2019 & 2032
- Table 92: Global Pharmaceutical Contract Manufacturing and Research Services Volume K Unit Forecast, by Manufacturing Services 2019 & 2032
- Table 93: Global Pharmaceutical Contract Manufacturing and Research Services Revenue Million Forecast, by Research Services 2019 & 2032
- Table 94: Global Pharmaceutical Contract Manufacturing and Research Services Volume K Unit Forecast, by Research Services 2019 & 2032
- Table 95: Global Pharmaceutical Contract Manufacturing and Research Services Revenue Million Forecast, by Country 2019 & 2032
- Table 96: Global Pharmaceutical Contract Manufacturing and Research Services Volume K Unit Forecast, by Country 2019 & 2032
- Table 97: China Global Pharmaceutical Contract Manufacturing and Research Services Revenue (Million) Forecast, by Application 2019 & 2032
- Table 98: China Global Pharmaceutical Contract Manufacturing and Research Services Volume (K Unit) Forecast, by Application 2019 & 2032
- Table 99: Japan Global Pharmaceutical Contract Manufacturing and Research Services Revenue (Million) Forecast, by Application 2019 & 2032
- Table 100: Japan Global Pharmaceutical Contract Manufacturing and Research Services Volume (K Unit) Forecast, by Application 2019 & 2032
- Table 101: India Global Pharmaceutical Contract Manufacturing and Research Services Revenue (Million) Forecast, by Application 2019 & 2032
- Table 102: India Global Pharmaceutical Contract Manufacturing and Research Services Volume (K Unit) Forecast, by Application 2019 & 2032
- Table 103: Australia Global Pharmaceutical Contract Manufacturing and Research Services Revenue (Million) Forecast, by Application 2019 & 2032
- Table 104: Australia Global Pharmaceutical Contract Manufacturing and Research Services Volume (K Unit) Forecast, by Application 2019 & 2032
- Table 105: South Korea Global Pharmaceutical Contract Manufacturing and Research Services Revenue (Million) Forecast, by Application 2019 & 2032
- Table 106: South Korea Global Pharmaceutical Contract Manufacturing and Research Services Volume (K Unit) Forecast, by Application 2019 & 2032
- Table 107: Rest of Asia Pacific Global Pharmaceutical Contract Manufacturing and Research Services Revenue (Million) Forecast, by Application 2019 & 2032
- Table 108: Rest of Asia Pacific Global Pharmaceutical Contract Manufacturing and Research Services Volume (K Unit) Forecast, by Application 2019 & 2032
- Table 109: Global Pharmaceutical Contract Manufacturing and Research Services Revenue Million Forecast, by Manufacturing Services 2019 & 2032
- Table 110: Global Pharmaceutical Contract Manufacturing and Research Services Volume K Unit Forecast, by Manufacturing Services 2019 & 2032
- Table 111: Global Pharmaceutical Contract Manufacturing and Research Services Revenue Million Forecast, by Research Services 2019 & 2032
- Table 112: Global Pharmaceutical Contract Manufacturing and Research Services Volume K Unit Forecast, by Research Services 2019 & 2032
- Table 113: Global Pharmaceutical Contract Manufacturing and Research Services Revenue Million Forecast, by Country 2019 & 2032
- Table 114: Global Pharmaceutical Contract Manufacturing and Research Services Volume K Unit Forecast, by Country 2019 & 2032
- Table 115: GCC Global Pharmaceutical Contract Manufacturing and Research Services Revenue (Million) Forecast, by Application 2019 & 2032
- Table 116: GCC Global Pharmaceutical Contract Manufacturing and Research Services Volume (K Unit) Forecast, by Application 2019 & 2032
- Table 117: South Africa Global Pharmaceutical Contract Manufacturing and Research Services Revenue (Million) Forecast, by Application 2019 & 2032
- Table 118: South Africa Global Pharmaceutical Contract Manufacturing and Research Services Volume (K Unit) Forecast, by Application 2019 & 2032
- Table 119: Rest of Middle East and Africa Global Pharmaceutical Contract Manufacturing and Research Services Revenue (Million) Forecast, by Application 2019 & 2032
- Table 120: Rest of Middle East and Africa Global Pharmaceutical Contract Manufacturing and Research Services Volume (K Unit) Forecast, by Application 2019 & 2032
- Table 121: Global Pharmaceutical Contract Manufacturing and Research Services Revenue Million Forecast, by Manufacturing Services 2019 & 2032
- Table 122: Global Pharmaceutical Contract Manufacturing and Research Services Volume K Unit Forecast, by Manufacturing Services 2019 & 2032
- Table 123: Global Pharmaceutical Contract Manufacturing and Research Services Revenue Million Forecast, by Research Services 2019 & 2032
- Table 124: Global Pharmaceutical Contract Manufacturing and Research Services Volume K Unit Forecast, by Research Services 2019 & 2032
- Table 125: Global Pharmaceutical Contract Manufacturing and Research Services Revenue Million Forecast, by Country 2019 & 2032
- Table 126: Global Pharmaceutical Contract Manufacturing and Research Services Volume K Unit Forecast, by Country 2019 & 2032
- Table 127: Brazil Global Pharmaceutical Contract Manufacturing and Research Services Revenue (Million) Forecast, by Application 2019 & 2032
- Table 128: Brazil Global Pharmaceutical Contract Manufacturing and Research Services Volume (K Unit) Forecast, by Application 2019 & 2032
- Table 129: Argentina Global Pharmaceutical Contract Manufacturing and Research Services Revenue (Million) Forecast, by Application 2019 & 2032
- Table 130: Argentina Global Pharmaceutical Contract Manufacturing and Research Services Volume (K Unit) Forecast, by Application 2019 & 2032
- Table 131: Rest of South America Global Pharmaceutical Contract Manufacturing and Research Services Revenue (Million) Forecast, by Application 2019 & 2032
- Table 132: Rest of South America Global Pharmaceutical Contract Manufacturing and Research Services Volume (K Unit) Forecast, by Application 2019 & 2032
Frequently Asked Questions
1. What is the projected Compound Annual Growth Rate (CAGR) of the Global Pharmaceutical Contract Manufacturing and Research Services?
The projected CAGR is approximately 7.00%.
2. Which companies are prominent players in the Global Pharmaceutical Contract Manufacturing and Research Services?
Key companies in the market include Labcorp Drug Development, Baxter BioPharma, Evonik Industries AG, Boehringer Ingelheim Biopharmaceuticals GmbH, Symbiosis Pharmaceutical Services, Aurigene Pharmaceutical Services Ltd, Piramal Pharma Solutions, Thermo Fisher Scientific (PPD Inc ), AbbVie, Dalton Pharma Services, Sterling Pharma Solutions, Lonza AG.
3. What are the main segments of the Global Pharmaceutical Contract Manufacturing and Research Services?
The market segments include Manufacturing Services, Research Services.
4. Can you provide details about the market size?
The market size is estimated to be USD XX Million as of 2022.
5. What are some drivers contributing to market growth?
Growing Demand To Develop Pharmaceutical Drugs; Low Manufacturing Cost And Improving Economic Condition of Developing Countries; Rising Use of Biologics.
6. What are the notable trends driving market growth?
Oncology Segment is Expected to Hold a Major Market Share in the Pharmaceutical Contract Manufacturing and Research Services Market.
7. Are there any restraints impacting market growth?
Regulatory Issues Pertaining to the Drug Approval; Limited Outsourcing Opted by Pharmaceutical Companies.
8. Can you provide examples of recent developments in the market?
N/A
9. What pricing options are available for accessing the report?
Pricing options include single-user, multi-user, and enterprise licenses priced at USD 4750, USD 5250, and USD 8750 respectively.
10. Is the market size provided in terms of value or volume?
The market size is provided in terms of value, measured in Million and volume, measured in K Unit.
11. Are there any specific market keywords associated with the report?
Yes, the market keyword associated with the report is "Global Pharmaceutical Contract Manufacturing and Research Services," which aids in identifying and referencing the specific market segment covered.
12. How do I determine which pricing option suits my needs best?
The pricing options vary based on user requirements and access needs. Individual users may opt for single-user licenses, while businesses requiring broader access may choose multi-user or enterprise licenses for cost-effective access to the report.
13. Are there any additional resources or data provided in the Global Pharmaceutical Contract Manufacturing and Research Services report?
While the report offers comprehensive insights, it's advisable to review the specific contents or supplementary materials provided to ascertain if additional resources or data are available.
14. How can I stay updated on further developments or reports in the Global Pharmaceutical Contract Manufacturing and Research Services?
To stay informed about further developments, trends, and reports in the Global Pharmaceutical Contract Manufacturing and Research Services, consider subscribing to industry newsletters, following relevant companies and organizations, or regularly checking reputable industry news sources and publications.
Methodology
Step 1 - Identification of Relevant Samples Size from Population Database


Step 2 - Approaches for Defining Global Market Size (Value, Volume* & Price*)

Note*: In applicable scenarios
Step 3 - Data Sources
Primary Research
- Web Analytics
- Survey Reports
- Research Institute
- Latest Research Reports
- Opinion Leaders
Secondary Research
- Annual Reports
- White Paper
- Latest Press Release
- Industry Association
- Paid Database
- Investor Presentations

Step 4 - Data Triangulation
Involves using different sources of information in order to increase the validity of a study
These sources are likely to be stakeholders in a program - participants, other researchers, program staff, other community members, and so on.
Then we put all data in single framework & apply various statistical tools to find out the dynamic on the market.
During the analysis stage, feedback from the stakeholder groups would be compared to determine areas of agreement as well as areas of divergence


