
Key Insights
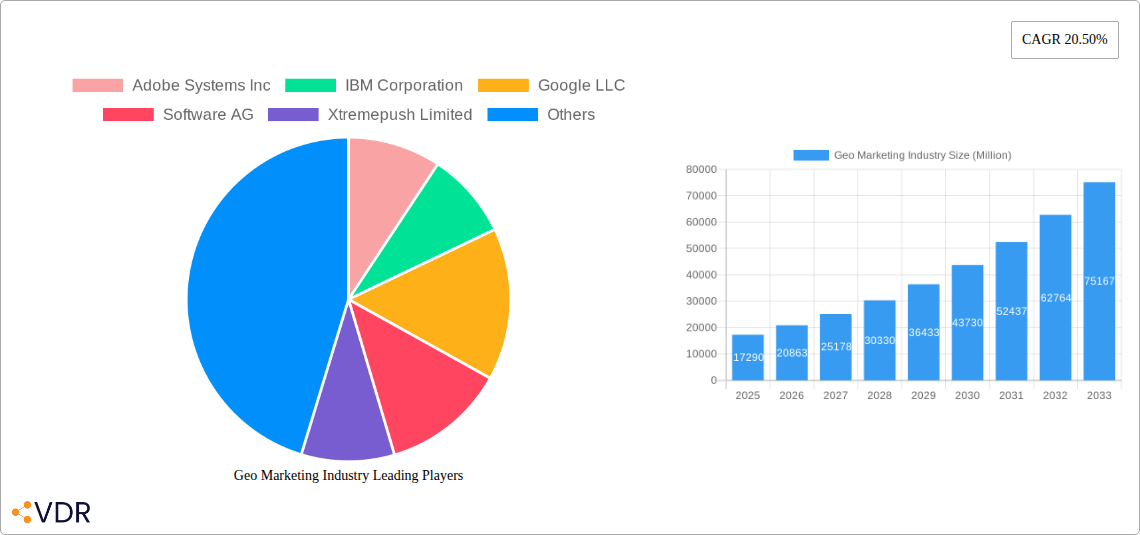
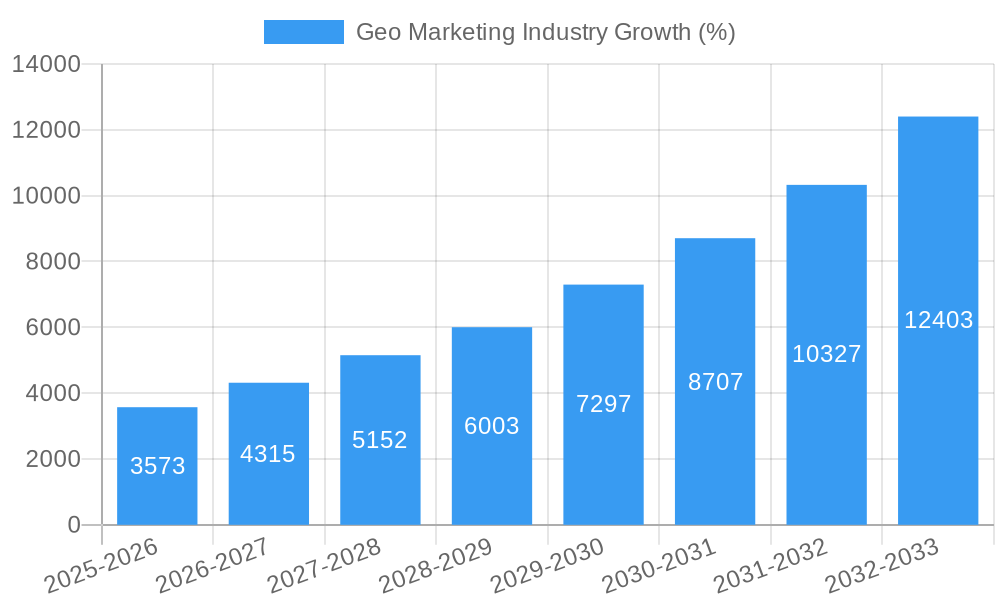
The global geospatial marketing industry, valued at $17.29 billion in 2025, is experiencing robust growth, projected to expand at a Compound Annual Growth Rate (CAGR) of 20.50% from 2025 to 2033. This rapid expansion is driven by several key factors. The increasing adoption of location-based services and mobile devices fuels the demand for targeted advertising and customer engagement strategies. Businesses across various sectors, including BFSI (Banking, Financial Services, and Insurance), IT and Telecommunications, Retail and E-commerce, Media and Entertainment, and Travel and Hospitality, are leveraging geospatial data and analytics to understand customer behavior, optimize marketing campaigns, and improve operational efficiency. Furthermore, advancements in technologies like artificial intelligence (AI), machine learning (ML), and the Internet of Things (IoT) are enhancing the capabilities of geospatial marketing platforms, enabling more precise targeting and personalized experiences. The shift towards cloud-based deployment models also contributes to market growth, offering scalability, cost-effectiveness, and improved accessibility. While data privacy concerns and the complexities of integrating geospatial data with existing marketing systems pose challenges, the overall market outlook remains exceptionally positive.
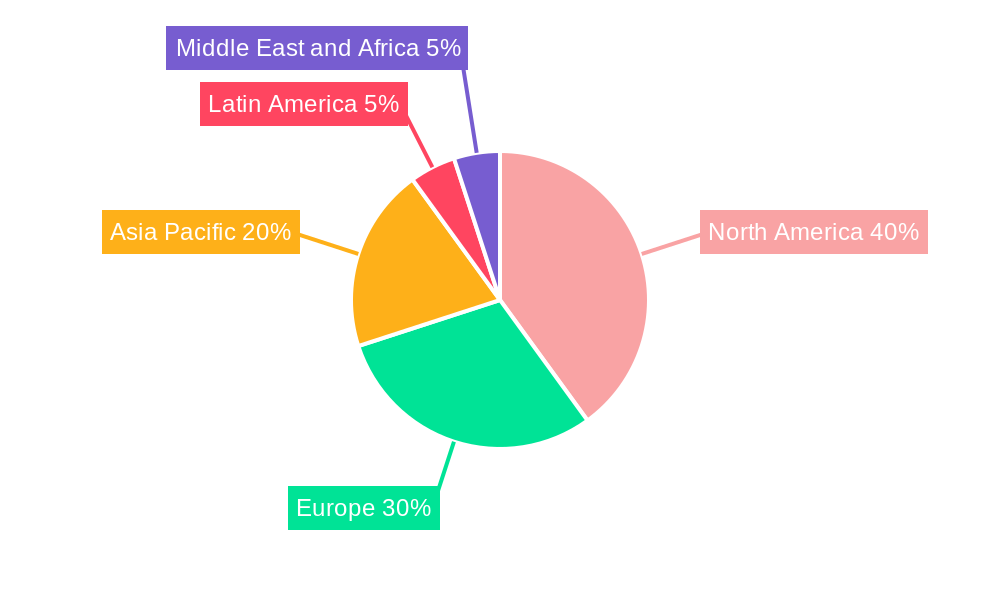
The market segmentation reveals significant opportunities across different components (software and services), deployment methods (cloud and on-premise), locations (indoor and outdoor), and end-user industries. North America is expected to maintain a leading market share, driven by early adoption and technological advancements, followed by Europe and the Asia-Pacific region, which exhibit strong growth potential due to increasing digitalization and expanding mobile penetration. Competitive landscape analysis indicates the presence of established players like Adobe, IBM, Google, and Microsoft, alongside emerging specialized geospatial marketing companies. The forecast period (2025-2033) will likely witness intensified competition, strategic partnerships, and technological innovation, further shaping the industry's trajectory. The ongoing development of location intelligence solutions and the integration of geospatial data into broader marketing technology stacks will continue to drive market expansion in the coming years.
Geo Marketing Industry Market Report: 2019-2033
This comprehensive report provides an in-depth analysis of the Geo Marketing industry, encompassing market dynamics, growth trends, competitive landscape, and future outlook. With a focus on key segments including Software, Services, Cloud, On-Premise, Indoor, Outdoor, BFSI, IT & Telecommunications, Retail & E-commerce, Media & Entertainment, and Travel & Hospitality, this report is an invaluable resource for industry professionals, investors, and strategic decision-makers. The study period covers 2019-2033, with a base year of 2025 and a forecast period of 2025-2033. The market size is presented in million units.
Geo Marketing Industry Market Dynamics & Structure
The Geo Marketing industry is characterized by a moderately concentrated market structure, with key players like Adobe Systems Inc, IBM Corporation, Google LLC, and others vying for market share. Technological innovation, particularly in areas like AI-powered location analytics and enhanced data accuracy, is a crucial driver of market growth. Regulatory frameworks concerning data privacy and usage significantly influence industry practices. The emergence of sophisticated competitive substitutes, such as advanced analytics platforms with geolocation capabilities, continuously puts pressure on existing players. End-user demographics, particularly the increasing adoption of mobile devices and the growth of e-commerce, shape the market's evolution. M&A activity in this sector is moderate, with xx deals recorded in the historical period (2019-2024), indicating a strategic approach to market consolidation and technological acquisition.
- Market Concentration: Moderately concentrated, with top 5 players holding an estimated xx% market share in 2025.
- Technological Innovation: AI-driven location intelligence, advanced analytics, and improved data accuracy are key drivers.
- Regulatory Landscape: Data privacy regulations (e.g., GDPR, CCPA) significantly impact data usage and market practices.
- Competitive Substitutes: Advanced analytics platforms with integrated geolocation capabilities pose a competitive threat.
- End-User Demographics: Growing adoption of mobile devices and e-commerce fuels demand for precise geolocation marketing.
- M&A Activity: xx M&A deals during 2019-2024, suggesting a trend toward consolidation and technological acquisition.
Geo Marketing Industry Growth Trends & Insights
The Geo Marketing market is experiencing robust growth, driven by increasing demand for targeted advertising, improved customer experience, and the rising adoption of location-based services. The market size was valued at xx million units in 2024 and is projected to reach xx million units by 2033, exhibiting a CAGR of xx% during the forecast period. This growth is fueled by technological disruptions, such as the advent of 5G technology enabling real-time location tracking and AI-powered predictive analytics enhancing campaign efficacy. Consumer behavior shifts, such as increased reliance on mobile devices and online shopping, are further contributing factors. Market penetration is estimated at xx% in 2025, with significant growth potential across various end-user industries.
Dominant Regions, Countries, or Segments in Geo Marketing Industry
North America currently dominates the Geo Marketing market, accounting for an estimated xx% market share in 2025, driven by early adoption of advanced technologies and a strong presence of key players. Within the segment breakdown, the Software component holds the largest share (xx%), followed by Services (xx%). Cloud deployment is the fastest-growing segment (xx% CAGR), exceeding On-Premise deployment. The Retail & E-commerce sector is the largest end-user industry, representing xx% of the total market in 2025, driven by the need for targeted promotions and improved customer engagement. Outdoor location-based marketing also presents significant growth opportunities, owing to the increased mobility of consumers.
- Key Drivers for North America: Advanced technological infrastructure, early adoption of location-based technologies, and strong presence of major technology companies.
- Software Segment Dominance: High demand for advanced analytics and location intelligence platforms.
- Cloud Deployment Growth: Scalability, cost-effectiveness, and accessibility drive the preference for cloud-based solutions.
- Retail & E-commerce Leadership: Focus on targeted customer engagement and optimized marketing campaigns.
- Outdoor Location-based Marketing: Increased consumer mobility presents significant growth potential.
Geo Marketing Industry Product Landscape
The Geo Marketing industry offers a range of solutions, from basic location-based advertising platforms to sophisticated AI-powered analytics dashboards. Products are differentiated by data accuracy, integration capabilities, analytical sophistication, and ease of use. Recent innovations focus on enhancing data privacy and security features and integrating machine learning algorithms for more precise audience targeting. Key performance indicators include campaign ROI, customer engagement metrics, and data accuracy levels. Unique selling propositions often center around data-driven insights, precise targeting, and integration with existing marketing stacks.
Key Drivers, Barriers & Challenges in Geo Marketing Industry
Key Drivers: Rising adoption of mobile devices and e-commerce, increasing demand for personalized marketing experiences, advancements in location data accuracy and analytics, and government initiatives to improve infrastructure.
Key Barriers & Challenges: Concerns surrounding data privacy and security, high implementation costs, complexity of data integration, and competition from alternative marketing strategies (e.g., programmatic advertising). These barriers create estimated xx million unit market slowdown annually.
Emerging Opportunities in Geo Marketing Industry
Emerging opportunities include the integration of geospatial data with other data sources (e.g., social media, CRM) for enhanced consumer profiling, the expansion of location-based services into emerging markets, and the development of innovative applications, like hyperlocal marketing and real-time location-based insights for improved customer journey optimization. Furthermore, the growing use of augmented reality (AR) and virtual reality (VR) presents opportunities for immersive location-based experiences.
Growth Accelerators in the Geo Marketing Industry
Long-term growth will be propelled by advancements in AI-powered location analytics, enabling more precise targeting and predictive capabilities. Strategic partnerships between technology providers and marketing agencies will facilitate wider adoption and integration. Expansion into new geographic markets and industries, particularly in developing economies, also offers substantial growth potential. The increasing sophistication of location-based advertising will drive further market expansion.
Key Players Shaping the Geo Marketing Industry Market
- Adobe Systems Inc
- IBM Corporation
- Google LLC
- Software AG
- Xtremepush Limited
- Cisco Systems Inc
- Microsoft Corporation
- Ericsson Inc
- Oracle Corporation
- ESRI Business Information Solutions Inc
- Qualcomm Inc
Notable Milestones in Geo Marketing Industry Sector
- Jan 2023: MapZot.AI launches mobile location data solution, enhancing foot traffic analysis and site selection for businesses.
- Apr 2022: Precisely introduces enhanced geo-addressing capabilities, improving data accuracy and global coverage.
In-Depth Geo Marketing Industry Market Outlook
The Geo Marketing industry is poised for significant growth in the coming years, driven by the convergence of technological advancements, evolving consumer behavior, and increasing demand for precise targeting. Strategic investments in AI-powered analytics, data security, and global market expansion will be critical for success. Opportunities exist across diverse industries, presenting a compelling outlook for long-term growth and value creation.
Geo Marketing Industry Segmentation
-
1. Components
- 1.1. Software
- 1.2. Services
-
2. Deployment
- 2.1. Cloud
- 2.2. On-Premise
-
3. Location
- 3.1. Indoor
- 3.2. Outdoor
-
4. End-User Industry
- 4.1. BFSI
- 4.2. IT and Telecommunications
- 4.3. Retail and E-commerce
- 4.4. Media and Entertainment
- 4.5. Travel and Hospitality
- 4.6. Other End-user Industries
Geo Marketing Industry Segmentation By Geography
- 1. North America
- 2. Europe
- 3. Asia Pacific
- 4. Latin America
- 5. Middle East and Africa
Geo Marketing Industry REPORT HIGHLIGHTS
| Aspects | Details |
|---|---|
| Study Period | 2019-2033 |
| Base Year | 2024 |
| Estimated Year | 2025 |
| Forecast Period | 2025-2033 |
| Historical Period | 2019-2024 |
| Growth Rate | CAGR of 20.50% from 2019-2033 |
| Segmentation |
|
Table of Contents
- 1. Introduction
- 1.1. Research Scope
- 1.2. Market Segmentation
- 1.3. Research Methodology
- 1.4. Definitions and Assumptions
- 2. Executive Summary
- 2.1. Introduction
- 3. Market Dynamics
- 3.1. Introduction
- 3.2. Market Drivers
- 3.2.1. Increasing Adoption of Emerging Technologies in Marketing Sector; Increasing Demand for Location-Based Intelligence to Enhance the Business Revenue
- 3.3. Market Restrains
- 3.3.1. Increasing Security and Privacy Concerns Among Enterprises
- 3.4. Market Trends
- 3.4.1. Services Components Segment is Expected to Hold Significant Market Share
- 4. Market Factor Analysis
- 4.1. Porters Five Forces
- 4.2. Supply/Value Chain
- 4.3. PESTEL analysis
- 4.4. Market Entropy
- 4.5. Patent/Trademark Analysis
- 5. Global Geo Marketing Industry Analysis, Insights and Forecast, 2019-2031
- 5.1. Market Analysis, Insights and Forecast - by Components
- 5.1.1. Software
- 5.1.2. Services
- 5.2. Market Analysis, Insights and Forecast - by Deployment
- 5.2.1. Cloud
- 5.2.2. On-Premise
- 5.3. Market Analysis, Insights and Forecast - by Location
- 5.3.1. Indoor
- 5.3.2. Outdoor
- 5.4. Market Analysis, Insights and Forecast - by End-User Industry
- 5.4.1. BFSI
- 5.4.2. IT and Telecommunications
- 5.4.3. Retail and E-commerce
- 5.4.4. Media and Entertainment
- 5.4.5. Travel and Hospitality
- 5.4.6. Other End-user Industries
- 5.5. Market Analysis, Insights and Forecast - by Region
- 5.5.1. North America
- 5.5.2. Europe
- 5.5.3. Asia Pacific
- 5.5.4. Latin America
- 5.5.5. Middle East and Africa
- 5.1. Market Analysis, Insights and Forecast - by Components
- 6. North America Geo Marketing Industry Analysis, Insights and Forecast, 2019-2031
- 6.1. Market Analysis, Insights and Forecast - by Components
- 6.1.1. Software
- 6.1.2. Services
- 6.2. Market Analysis, Insights and Forecast - by Deployment
- 6.2.1. Cloud
- 6.2.2. On-Premise
- 6.3. Market Analysis, Insights and Forecast - by Location
- 6.3.1. Indoor
- 6.3.2. Outdoor
- 6.4. Market Analysis, Insights and Forecast - by End-User Industry
- 6.4.1. BFSI
- 6.4.2. IT and Telecommunications
- 6.4.3. Retail and E-commerce
- 6.4.4. Media and Entertainment
- 6.4.5. Travel and Hospitality
- 6.4.6. Other End-user Industries
- 6.1. Market Analysis, Insights and Forecast - by Components
- 7. Europe Geo Marketing Industry Analysis, Insights and Forecast, 2019-2031
- 7.1. Market Analysis, Insights and Forecast - by Components
- 7.1.1. Software
- 7.1.2. Services
- 7.2. Market Analysis, Insights and Forecast - by Deployment
- 7.2.1. Cloud
- 7.2.2. On-Premise
- 7.3. Market Analysis, Insights and Forecast - by Location
- 7.3.1. Indoor
- 7.3.2. Outdoor
- 7.4. Market Analysis, Insights and Forecast - by End-User Industry
- 7.4.1. BFSI
- 7.4.2. IT and Telecommunications
- 7.4.3. Retail and E-commerce
- 7.4.4. Media and Entertainment
- 7.4.5. Travel and Hospitality
- 7.4.6. Other End-user Industries
- 7.1. Market Analysis, Insights and Forecast - by Components
- 8. Asia Pacific Geo Marketing Industry Analysis, Insights and Forecast, 2019-2031
- 8.1. Market Analysis, Insights and Forecast - by Components
- 8.1.1. Software
- 8.1.2. Services
- 8.2. Market Analysis, Insights and Forecast - by Deployment
- 8.2.1. Cloud
- 8.2.2. On-Premise
- 8.3. Market Analysis, Insights and Forecast - by Location
- 8.3.1. Indoor
- 8.3.2. Outdoor
- 8.4. Market Analysis, Insights and Forecast - by End-User Industry
- 8.4.1. BFSI
- 8.4.2. IT and Telecommunications
- 8.4.3. Retail and E-commerce
- 8.4.4. Media and Entertainment
- 8.4.5. Travel and Hospitality
- 8.4.6. Other End-user Industries
- 8.1. Market Analysis, Insights and Forecast - by Components
- 9. Latin America Geo Marketing Industry Analysis, Insights and Forecast, 2019-2031
- 9.1. Market Analysis, Insights and Forecast - by Components
- 9.1.1. Software
- 9.1.2. Services
- 9.2. Market Analysis, Insights and Forecast - by Deployment
- 9.2.1. Cloud
- 9.2.2. On-Premise
- 9.3. Market Analysis, Insights and Forecast - by Location
- 9.3.1. Indoor
- 9.3.2. Outdoor
- 9.4. Market Analysis, Insights and Forecast - by End-User Industry
- 9.4.1. BFSI
- 9.4.2. IT and Telecommunications
- 9.4.3. Retail and E-commerce
- 9.4.4. Media and Entertainment
- 9.4.5. Travel and Hospitality
- 9.4.6. Other End-user Industries
- 9.1. Market Analysis, Insights and Forecast - by Components
- 10. Middle East and Africa Geo Marketing Industry Analysis, Insights and Forecast, 2019-2031
- 10.1. Market Analysis, Insights and Forecast - by Components
- 10.1.1. Software
- 10.1.2. Services
- 10.2. Market Analysis, Insights and Forecast - by Deployment
- 10.2.1. Cloud
- 10.2.2. On-Premise
- 10.3. Market Analysis, Insights and Forecast - by Location
- 10.3.1. Indoor
- 10.3.2. Outdoor
- 10.4. Market Analysis, Insights and Forecast - by End-User Industry
- 10.4.1. BFSI
- 10.4.2. IT and Telecommunications
- 10.4.3. Retail and E-commerce
- 10.4.4. Media and Entertainment
- 10.4.5. Travel and Hospitality
- 10.4.6. Other End-user Industries
- 10.1. Market Analysis, Insights and Forecast - by Components
- 11. North America Geo Marketing Industry Analysis, Insights and Forecast, 2019-2031
- 11.1. Market Analysis, Insights and Forecast - By Country/Sub-region
- 11.1.1.
- 12. Europe Geo Marketing Industry Analysis, Insights and Forecast, 2019-2031
- 12.1. Market Analysis, Insights and Forecast - By Country/Sub-region
- 12.1.1.
- 13. Asia Pacific Geo Marketing Industry Analysis, Insights and Forecast, 2019-2031
- 13.1. Market Analysis, Insights and Forecast - By Country/Sub-region
- 13.1.1.
- 14. Latin America Geo Marketing Industry Analysis, Insights and Forecast, 2019-2031
- 14.1. Market Analysis, Insights and Forecast - By Country/Sub-region
- 14.1.1.
- 15. Middle East and Africa Geo Marketing Industry Analysis, Insights and Forecast, 2019-2031
- 15.1. Market Analysis, Insights and Forecast - By Country/Sub-region
- 15.1.1.
- 16. Competitive Analysis
- 16.1. Global Market Share Analysis 2024
- 16.2. Company Profiles
- 16.2.1 Adobe Systems Inc
- 16.2.1.1. Overview
- 16.2.1.2. Products
- 16.2.1.3. SWOT Analysis
- 16.2.1.4. Recent Developments
- 16.2.1.5. Financials (Based on Availability)
- 16.2.2 IBM Corporation
- 16.2.2.1. Overview
- 16.2.2.2. Products
- 16.2.2.3. SWOT Analysis
- 16.2.2.4. Recent Developments
- 16.2.2.5. Financials (Based on Availability)
- 16.2.3 Google LLC
- 16.2.3.1. Overview
- 16.2.3.2. Products
- 16.2.3.3. SWOT Analysis
- 16.2.3.4. Recent Developments
- 16.2.3.5. Financials (Based on Availability)
- 16.2.4 Software AG
- 16.2.4.1. Overview
- 16.2.4.2. Products
- 16.2.4.3. SWOT Analysis
- 16.2.4.4. Recent Developments
- 16.2.4.5. Financials (Based on Availability)
- 16.2.5 Xtremepush Limited
- 16.2.5.1. Overview
- 16.2.5.2. Products
- 16.2.5.3. SWOT Analysis
- 16.2.5.4. Recent Developments
- 16.2.5.5. Financials (Based on Availability)
- 16.2.6 Cisco Systems Inc
- 16.2.6.1. Overview
- 16.2.6.2. Products
- 16.2.6.3. SWOT Analysis
- 16.2.6.4. Recent Developments
- 16.2.6.5. Financials (Based on Availability)
- 16.2.7 Microsoft Corporation
- 16.2.7.1. Overview
- 16.2.7.2. Products
- 16.2.7.3. SWOT Analysis
- 16.2.7.4. Recent Developments
- 16.2.7.5. Financials (Based on Availability)
- 16.2.8 Ericsson Inc
- 16.2.8.1. Overview
- 16.2.8.2. Products
- 16.2.8.3. SWOT Analysis
- 16.2.8.4. Recent Developments
- 16.2.8.5. Financials (Based on Availability)
- 16.2.9 Oracle Corporation
- 16.2.9.1. Overview
- 16.2.9.2. Products
- 16.2.9.3. SWOT Analysis
- 16.2.9.4. Recent Developments
- 16.2.9.5. Financials (Based on Availability)
- 16.2.10 ESRI Business Information Solutions Inc
- 16.2.10.1. Overview
- 16.2.10.2. Products
- 16.2.10.3. SWOT Analysis
- 16.2.10.4. Recent Developments
- 16.2.10.5. Financials (Based on Availability)
- 16.2.11 Qualcomm Inc
- 16.2.11.1. Overview
- 16.2.11.2. Products
- 16.2.11.3. SWOT Analysis
- 16.2.11.4. Recent Developments
- 16.2.11.5. Financials (Based on Availability)
- 16.2.1 Adobe Systems Inc
List of Figures
- Figure 1: Global Geo Marketing Industry Revenue Breakdown (Million, %) by Region 2024 & 2032
- Figure 2: North America Geo Marketing Industry Revenue (Million), by Country 2024 & 2032
- Figure 3: North America Geo Marketing Industry Revenue Share (%), by Country 2024 & 2032
- Figure 4: Europe Geo Marketing Industry Revenue (Million), by Country 2024 & 2032
- Figure 5: Europe Geo Marketing Industry Revenue Share (%), by Country 2024 & 2032
- Figure 6: Asia Pacific Geo Marketing Industry Revenue (Million), by Country 2024 & 2032
- Figure 7: Asia Pacific Geo Marketing Industry Revenue Share (%), by Country 2024 & 2032
- Figure 8: Latin America Geo Marketing Industry Revenue (Million), by Country 2024 & 2032
- Figure 9: Latin America Geo Marketing Industry Revenue Share (%), by Country 2024 & 2032
- Figure 10: Middle East and Africa Geo Marketing Industry Revenue (Million), by Country 2024 & 2032
- Figure 11: Middle East and Africa Geo Marketing Industry Revenue Share (%), by Country 2024 & 2032
- Figure 12: North America Geo Marketing Industry Revenue (Million), by Components 2024 & 2032
- Figure 13: North America Geo Marketing Industry Revenue Share (%), by Components 2024 & 2032
- Figure 14: North America Geo Marketing Industry Revenue (Million), by Deployment 2024 & 2032
- Figure 15: North America Geo Marketing Industry Revenue Share (%), by Deployment 2024 & 2032
- Figure 16: North America Geo Marketing Industry Revenue (Million), by Location 2024 & 2032
- Figure 17: North America Geo Marketing Industry Revenue Share (%), by Location 2024 & 2032
- Figure 18: North America Geo Marketing Industry Revenue (Million), by End-User Industry 2024 & 2032
- Figure 19: North America Geo Marketing Industry Revenue Share (%), by End-User Industry 2024 & 2032
- Figure 20: North America Geo Marketing Industry Revenue (Million), by Country 2024 & 2032
- Figure 21: North America Geo Marketing Industry Revenue Share (%), by Country 2024 & 2032
- Figure 22: Europe Geo Marketing Industry Revenue (Million), by Components 2024 & 2032
- Figure 23: Europe Geo Marketing Industry Revenue Share (%), by Components 2024 & 2032
- Figure 24: Europe Geo Marketing Industry Revenue (Million), by Deployment 2024 & 2032
- Figure 25: Europe Geo Marketing Industry Revenue Share (%), by Deployment 2024 & 2032
- Figure 26: Europe Geo Marketing Industry Revenue (Million), by Location 2024 & 2032
- Figure 27: Europe Geo Marketing Industry Revenue Share (%), by Location 2024 & 2032
- Figure 28: Europe Geo Marketing Industry Revenue (Million), by End-User Industry 2024 & 2032
- Figure 29: Europe Geo Marketing Industry Revenue Share (%), by End-User Industry 2024 & 2032
- Figure 30: Europe Geo Marketing Industry Revenue (Million), by Country 2024 & 2032
- Figure 31: Europe Geo Marketing Industry Revenue Share (%), by Country 2024 & 2032
- Figure 32: Asia Pacific Geo Marketing Industry Revenue (Million), by Components 2024 & 2032
- Figure 33: Asia Pacific Geo Marketing Industry Revenue Share (%), by Components 2024 & 2032
- Figure 34: Asia Pacific Geo Marketing Industry Revenue (Million), by Deployment 2024 & 2032
- Figure 35: Asia Pacific Geo Marketing Industry Revenue Share (%), by Deployment 2024 & 2032
- Figure 36: Asia Pacific Geo Marketing Industry Revenue (Million), by Location 2024 & 2032
- Figure 37: Asia Pacific Geo Marketing Industry Revenue Share (%), by Location 2024 & 2032
- Figure 38: Asia Pacific Geo Marketing Industry Revenue (Million), by End-User Industry 2024 & 2032
- Figure 39: Asia Pacific Geo Marketing Industry Revenue Share (%), by End-User Industry 2024 & 2032
- Figure 40: Asia Pacific Geo Marketing Industry Revenue (Million), by Country 2024 & 2032
- Figure 41: Asia Pacific Geo Marketing Industry Revenue Share (%), by Country 2024 & 2032
- Figure 42: Latin America Geo Marketing Industry Revenue (Million), by Components 2024 & 2032
- Figure 43: Latin America Geo Marketing Industry Revenue Share (%), by Components 2024 & 2032
- Figure 44: Latin America Geo Marketing Industry Revenue (Million), by Deployment 2024 & 2032
- Figure 45: Latin America Geo Marketing Industry Revenue Share (%), by Deployment 2024 & 2032
- Figure 46: Latin America Geo Marketing Industry Revenue (Million), by Location 2024 & 2032
- Figure 47: Latin America Geo Marketing Industry Revenue Share (%), by Location 2024 & 2032
- Figure 48: Latin America Geo Marketing Industry Revenue (Million), by End-User Industry 2024 & 2032
- Figure 49: Latin America Geo Marketing Industry Revenue Share (%), by End-User Industry 2024 & 2032
- Figure 50: Latin America Geo Marketing Industry Revenue (Million), by Country 2024 & 2032
- Figure 51: Latin America Geo Marketing Industry Revenue Share (%), by Country 2024 & 2032
- Figure 52: Middle East and Africa Geo Marketing Industry Revenue (Million), by Components 2024 & 2032
- Figure 53: Middle East and Africa Geo Marketing Industry Revenue Share (%), by Components 2024 & 2032
- Figure 54: Middle East and Africa Geo Marketing Industry Revenue (Million), by Deployment 2024 & 2032
- Figure 55: Middle East and Africa Geo Marketing Industry Revenue Share (%), by Deployment 2024 & 2032
- Figure 56: Middle East and Africa Geo Marketing Industry Revenue (Million), by Location 2024 & 2032
- Figure 57: Middle East and Africa Geo Marketing Industry Revenue Share (%), by Location 2024 & 2032
- Figure 58: Middle East and Africa Geo Marketing Industry Revenue (Million), by End-User Industry 2024 & 2032
- Figure 59: Middle East and Africa Geo Marketing Industry Revenue Share (%), by End-User Industry 2024 & 2032
- Figure 60: Middle East and Africa Geo Marketing Industry Revenue (Million), by Country 2024 & 2032
- Figure 61: Middle East and Africa Geo Marketing Industry Revenue Share (%), by Country 2024 & 2032
List of Tables
- Table 1: Global Geo Marketing Industry Revenue Million Forecast, by Region 2019 & 2032
- Table 2: Global Geo Marketing Industry Revenue Million Forecast, by Components 2019 & 2032
- Table 3: Global Geo Marketing Industry Revenue Million Forecast, by Deployment 2019 & 2032
- Table 4: Global Geo Marketing Industry Revenue Million Forecast, by Location 2019 & 2032
- Table 5: Global Geo Marketing Industry Revenue Million Forecast, by End-User Industry 2019 & 2032
- Table 6: Global Geo Marketing Industry Revenue Million Forecast, by Region 2019 & 2032
- Table 7: Global Geo Marketing Industry Revenue Million Forecast, by Country 2019 & 2032
- Table 8: Geo Marketing Industry Revenue (Million) Forecast, by Application 2019 & 2032
- Table 9: Global Geo Marketing Industry Revenue Million Forecast, by Country 2019 & 2032
- Table 10: Geo Marketing Industry Revenue (Million) Forecast, by Application 2019 & 2032
- Table 11: Global Geo Marketing Industry Revenue Million Forecast, by Country 2019 & 2032
- Table 12: Geo Marketing Industry Revenue (Million) Forecast, by Application 2019 & 2032
- Table 13: Global Geo Marketing Industry Revenue Million Forecast, by Country 2019 & 2032
- Table 14: Geo Marketing Industry Revenue (Million) Forecast, by Application 2019 & 2032
- Table 15: Global Geo Marketing Industry Revenue Million Forecast, by Country 2019 & 2032
- Table 16: Geo Marketing Industry Revenue (Million) Forecast, by Application 2019 & 2032
- Table 17: Global Geo Marketing Industry Revenue Million Forecast, by Components 2019 & 2032
- Table 18: Global Geo Marketing Industry Revenue Million Forecast, by Deployment 2019 & 2032
- Table 19: Global Geo Marketing Industry Revenue Million Forecast, by Location 2019 & 2032
- Table 20: Global Geo Marketing Industry Revenue Million Forecast, by End-User Industry 2019 & 2032
- Table 21: Global Geo Marketing Industry Revenue Million Forecast, by Country 2019 & 2032
- Table 22: Global Geo Marketing Industry Revenue Million Forecast, by Components 2019 & 2032
- Table 23: Global Geo Marketing Industry Revenue Million Forecast, by Deployment 2019 & 2032
- Table 24: Global Geo Marketing Industry Revenue Million Forecast, by Location 2019 & 2032
- Table 25: Global Geo Marketing Industry Revenue Million Forecast, by End-User Industry 2019 & 2032
- Table 26: Global Geo Marketing Industry Revenue Million Forecast, by Country 2019 & 2032
- Table 27: Global Geo Marketing Industry Revenue Million Forecast, by Components 2019 & 2032
- Table 28: Global Geo Marketing Industry Revenue Million Forecast, by Deployment 2019 & 2032
- Table 29: Global Geo Marketing Industry Revenue Million Forecast, by Location 2019 & 2032
- Table 30: Global Geo Marketing Industry Revenue Million Forecast, by End-User Industry 2019 & 2032
- Table 31: Global Geo Marketing Industry Revenue Million Forecast, by Country 2019 & 2032
- Table 32: Global Geo Marketing Industry Revenue Million Forecast, by Components 2019 & 2032
- Table 33: Global Geo Marketing Industry Revenue Million Forecast, by Deployment 2019 & 2032
- Table 34: Global Geo Marketing Industry Revenue Million Forecast, by Location 2019 & 2032
- Table 35: Global Geo Marketing Industry Revenue Million Forecast, by End-User Industry 2019 & 2032
- Table 36: Global Geo Marketing Industry Revenue Million Forecast, by Country 2019 & 2032
- Table 37: Global Geo Marketing Industry Revenue Million Forecast, by Components 2019 & 2032
- Table 38: Global Geo Marketing Industry Revenue Million Forecast, by Deployment 2019 & 2032
- Table 39: Global Geo Marketing Industry Revenue Million Forecast, by Location 2019 & 2032
- Table 40: Global Geo Marketing Industry Revenue Million Forecast, by End-User Industry 2019 & 2032
- Table 41: Global Geo Marketing Industry Revenue Million Forecast, by Country 2019 & 2032
Frequently Asked Questions
1. What is the projected Compound Annual Growth Rate (CAGR) of the Geo Marketing Industry?
The projected CAGR is approximately 20.50%.
2. Which companies are prominent players in the Geo Marketing Industry?
Key companies in the market include Adobe Systems Inc, IBM Corporation, Google LLC, Software AG, Xtremepush Limited, Cisco Systems Inc, Microsoft Corporation, Ericsson Inc, Oracle Corporation, ESRI Business Information Solutions Inc, Qualcomm Inc.
3. What are the main segments of the Geo Marketing Industry?
The market segments include Components, Deployment, Location, End-User Industry.
4. Can you provide details about the market size?
The market size is estimated to be USD 17.29 Million as of 2022.
5. What are some drivers contributing to market growth?
Increasing Adoption of Emerging Technologies in Marketing Sector; Increasing Demand for Location-Based Intelligence to Enhance the Business Revenue.
6. What are the notable trends driving market growth?
Services Components Segment is Expected to Hold Significant Market Share.
7. Are there any restraints impacting market growth?
Increasing Security and Privacy Concerns Among Enterprises.
8. Can you provide examples of recent developments in the market?
Jan 2023: MapZot.AI provides Mobile Location data to assist businesses in increasing foot traffic. MapZot.AI provides site selection, portfolio analytics, and vacancy analysis by providing insights into the exact habits of consumers, allowing company owners to properly estimate customer accessibility. The data provided by MapZot.AI is insightful and simple; by combining detailed metrics such as store saturation and pull rates with a simple UI, any business owner can take advantage of the advanced analytics capabilities that MapZot.AI provides to gain insight into what drives customers to their stores and which potential locations could be advantageous for opening new ones.
9. What pricing options are available for accessing the report?
Pricing options include single-user, multi-user, and enterprise licenses priced at USD 4750, USD 5250, and USD 8750 respectively.
10. Is the market size provided in terms of value or volume?
The market size is provided in terms of value, measured in Million.
11. Are there any specific market keywords associated with the report?
Yes, the market keyword associated with the report is "Geo Marketing Industry," which aids in identifying and referencing the specific market segment covered.
12. How do I determine which pricing option suits my needs best?
The pricing options vary based on user requirements and access needs. Individual users may opt for single-user licenses, while businesses requiring broader access may choose multi-user or enterprise licenses for cost-effective access to the report.
13. Are there any additional resources or data provided in the Geo Marketing Industry report?
While the report offers comprehensive insights, it's advisable to review the specific contents or supplementary materials provided to ascertain if additional resources or data are available.
14. How can I stay updated on further developments or reports in the Geo Marketing Industry?
To stay informed about further developments, trends, and reports in the Geo Marketing Industry, consider subscribing to industry newsletters, following relevant companies and organizations, or regularly checking reputable industry news sources and publications.
Methodology
Step 1 - Identification of Relevant Samples Size from Population Database


Step 2 - Approaches for Defining Global Market Size (Value, Volume* & Price*)

Note*: In applicable scenarios
Step 3 - Data Sources
Primary Research
- Web Analytics
- Survey Reports
- Research Institute
- Latest Research Reports
- Opinion Leaders
Secondary Research
- Annual Reports
- White Paper
- Latest Press Release
- Industry Association
- Paid Database
- Investor Presentations

Step 4 - Data Triangulation
Involves using different sources of information in order to increase the validity of a study
These sources are likely to be stakeholders in a program - participants, other researchers, program staff, other community members, and so on.
Then we put all data in single framework & apply various statistical tools to find out the dynamic on the market.
During the analysis stage, feedback from the stakeholder groups would be compared to determine areas of agreement as well as areas of divergence


