

Key Insights
The global General Purpose Server market is projected for substantial growth, expected to reach a market size of $100 billion by 2024, with a Compound Annual Growth Rate (CAGR) of 4.5% through 2033. This expansion is driven by widespread digital transformation, increasing demand for data processing and analytics, and significant investments from sectors including Internet services, government, and telecommunications. The rise of cloud computing, edge computing, and the Internet of Things (IoT) further amplifies the need for versatile server infrastructure. Additionally, the adoption of AI and machine learning fuels demand for high-performance server capabilities for training and inference.
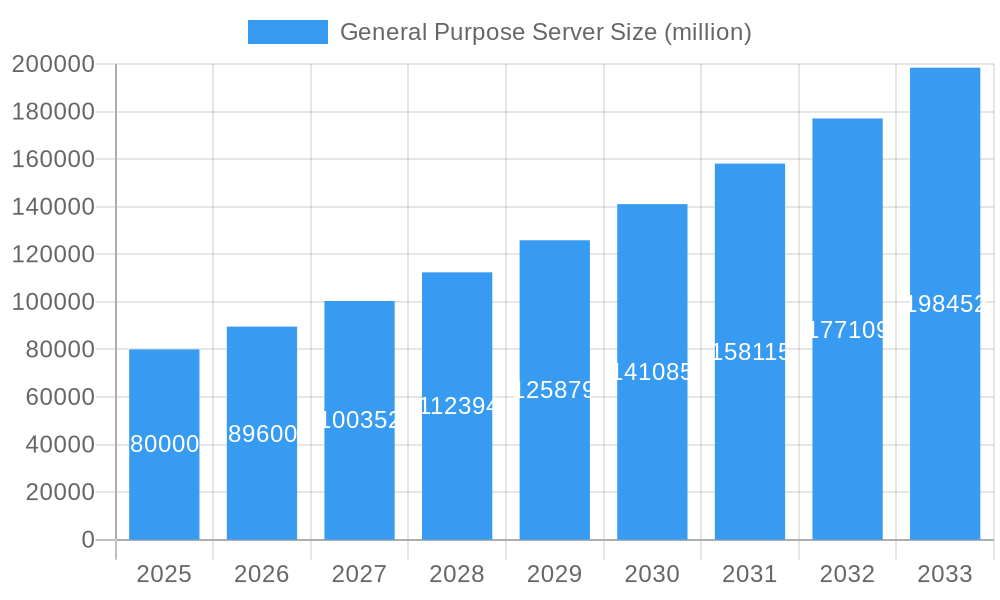
General Purpose Server Market Size (In Billion)
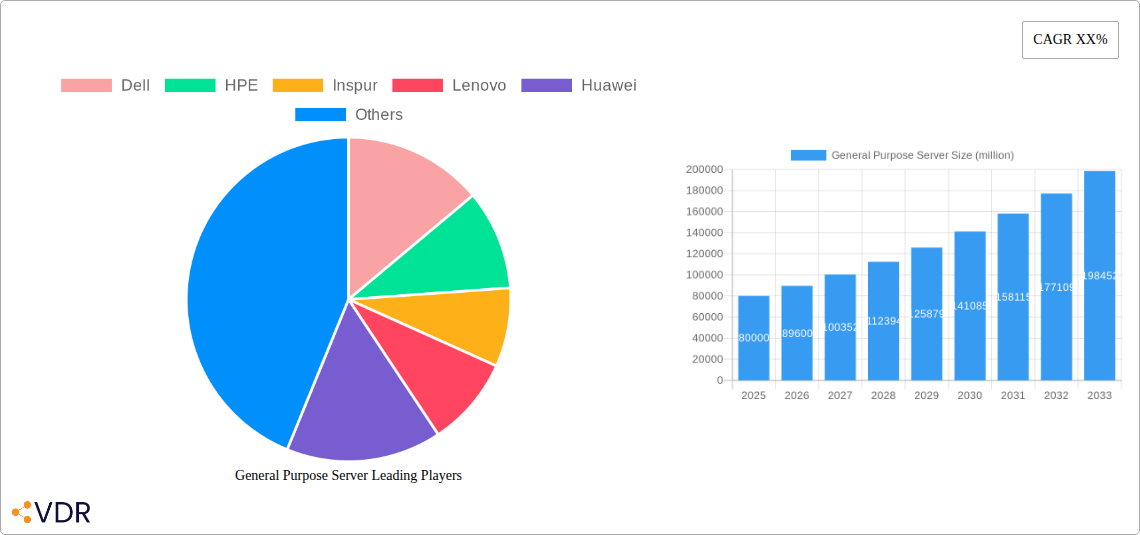
While market growth is robust, potential restraints include high initial capital expenditure for advanced hardware and the complexities of managing large-scale deployments. However, these are being addressed by the increasing availability of flexible and cost-effective cloud-based and managed services. Key trends shaping the market include the growth of hyperscale data centers, the demand for energy-efficient server designs (air and liquid-cooled), and enhanced networking integrations. Leading companies such as Dell, HPE, Inspur, Lenovo, and Huawei are innovating to provide advanced performance, scalability, and energy efficiency to meet diverse customer needs across telecommunications and financial services.
General Purpose Server Company Market Share
General Purpose Server Market Dynamics & Structure
The global General Purpose Server market is characterized by moderate concentration, with leading players like Dell, HPE, Inspur, and Lenovo holding significant market shares, estimated to be around 65% in 2025. Technological innovation is a primary driver, fueled by the relentless demand for increased processing power, enhanced energy efficiency, and advanced cooling solutions. Cloud computing adoption, the rise of AI and machine learning workloads, and the expansion of data centers are pushing the boundaries of server technology. Regulatory frameworks, primarily focused on data privacy and energy consumption, are shaping product development and deployment strategies. Competitive product substitutes, while limited in the core server market, include specialized hardware for specific workloads. End-user demographics are increasingly diverse, spanning Internet giants, government agencies, telecommunications providers, and financial institutions, each with unique performance and reliability demands. Mergers and acquisitions (M&A) are a steady feature, with approximately 5 to 8 significant deals anticipated annually, aimed at consolidating market position, acquiring new technologies, or expanding geographical reach. For instance, a key M&A trend involves hyperscalers acquiring specialized server component manufacturers to secure supply chains and optimize cost. Innovation barriers include high R&D costs and the lengthy product development cycles required for robust server hardware.
- Market Concentration: Dominated by a few key players, with a collective market share of approximately 65% in 2025.
- Technological Innovation: Driven by AI/ML, cloud computing, and demand for energy efficiency.
- Regulatory Landscape: Focused on data privacy and energy efficiency standards.
- Competitive Substitutes: Limited but present in specialized hardware solutions.
- End-User Segments: Diverse, including Internet, Government, Telecommunications, and Financial sectors.
- M&A Trends: Steady deal flow (5-8 major deals annually) for consolidation and technology acquisition.
General Purpose Server Growth Trends & Insights
The General Purpose Server market is poised for robust growth, projecting a compound annual growth rate (CAGR) of approximately 8.5% from 2025 to 2033. The market size, estimated at $XX billion in 2025, is expected to surge to $XX billion by 2033. This expansion is underpinned by escalating adoption rates across all major industry segments, driven by digital transformation initiatives and the burgeoning demand for data-intensive applications. Technological disruptions, particularly in the realm of Artificial Intelligence (AI), Machine Learning (ML), and high-performance computing (HPC), are acting as significant growth catalysts. The increasing complexity and computational requirements of AI models necessitate more powerful and specialized general-purpose servers, pushing the boundaries of processing, memory, and storage capabilities. Furthermore, the ongoing evolution of cloud infrastructure, with a continuous shift towards hybrid and multi-cloud environments, fuels sustained demand for scalable and flexible server solutions. Consumer behavior shifts, exemplified by the pervasive use of data-driven services and the exponential growth of IoT devices, are creating an ever-increasing volume of data that requires efficient processing and storage, further stimulating server market expansion. The adoption of liquid-cooled servers is also on the rise, driven by the need for higher power densities and improved energy efficiency in increasingly dense data center environments. This trend is particularly evident in high-performance computing and AI-focused deployments where heat dissipation is a critical concern. The market penetration of advanced server architectures, such as ARM-based processors, is also expected to gain momentum, offering competitive advantages in terms of power efficiency and cost-effectiveness for specific workloads. This sustained demand, coupled with technological advancements, paints a picture of a dynamic and expanding market for general-purpose servers.
Dominant Regions, Countries, or Segments in General Purpose Server
The Internet application segment is currently the dominant force driving growth within the General Purpose Server market, demonstrating significant market share and projected expansion. This dominance is propelled by several key factors, including the insatiable demand for cloud services, the rapid growth of e-commerce platforms, and the proliferation of online content and social media. Major internet companies, often referred to as hyperscalers, are continuously investing in massive data center infrastructure to support their global operations, making them the largest procurers of general-purpose servers. Their scale of deployment and continuous innovation cycles set the pace for the entire industry.
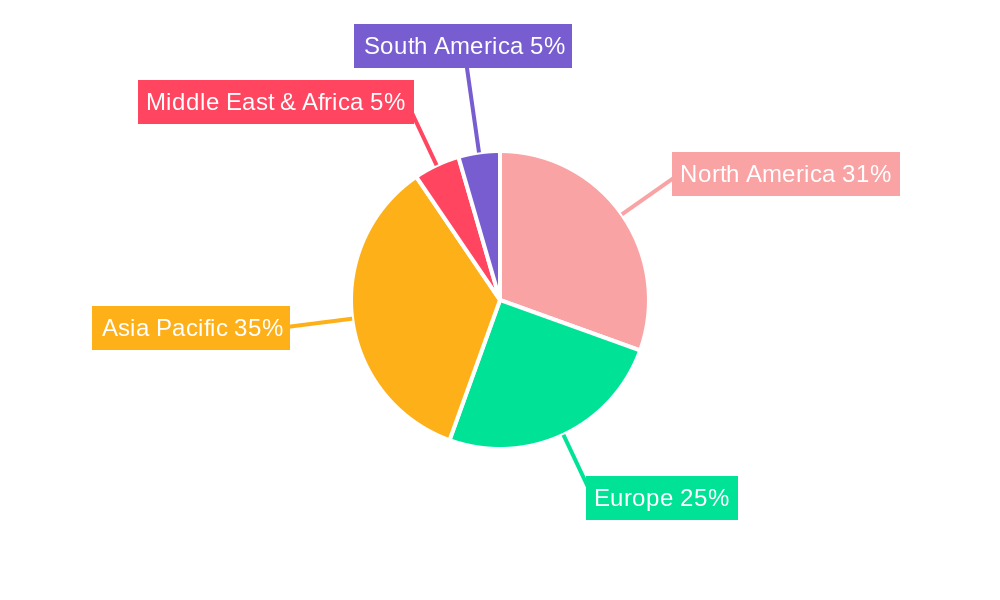
In terms of geographical dominance, North America, particularly the United States, remains the leading region. This is attributed to the presence of major technology hubs, a high concentration of cloud service providers, significant R&D investments in AI and big data, and a robust digital economy. Government initiatives supporting digital infrastructure development and a strong regulatory environment conducive to technological adoption further bolster its position.
Among the Types of servers, Air Cooled servers continue to hold a substantial market share due to their cost-effectiveness and widespread adoption in traditional data center deployments. However, the growth trajectory of Liquid Cooled servers is notably steeper. This surge is directly linked to the increasing power densities required by high-performance computing, AI, and machine learning workloads. As processors become more powerful and data centers become more compact, the limitations of air cooling become apparent, driving a greater preference for liquid cooling solutions that offer superior thermal management and energy efficiency.
- Dominant Application: Internet sector, driven by cloud computing, e-commerce, and content delivery.
- Leading Region: North America, spearheaded by the United States, due to its strong tech ecosystem and digital economy.
- Dominant Server Type (Current): Air Cooled, favored for cost-effectiveness and established infrastructure.
- High Growth Server Type: Liquid Cooled, propelled by the demands of AI, HPC, and high-density computing.
- Key Drivers in Internet Segment: Hyperscaler investments, data traffic growth, and demand for scalable cloud services.
- Key Drivers in North America: Technological innovation hubs, cloud provider presence, and supportive government policies.
- Key Drivers for Liquid Cooling: Increasing CPU/GPU power consumption, heat dissipation challenges in dense environments, and energy efficiency mandates.
General Purpose Server Product Landscape
The General Purpose Server product landscape is defined by continuous innovation focused on enhancing performance, efficiency, and adaptability. Leading manufacturers are introducing servers optimized for diverse workloads, from general-purpose computing and virtualization to demanding AI and high-performance computing (HPC) applications. Innovations include the integration of next-generation processors with increased core counts and higher clock speeds, advanced memory technologies like DDR5, and faster storage solutions such as NVMe SSDs. Furthermore, server designs are increasingly prioritizing energy efficiency, with advancements in power supply units and thermal management, including the growing adoption of liquid cooling for higher-density deployments. Software-defined networking (SDN) and storage (SDS) capabilities are also being seamlessly integrated, offering greater flexibility and manageability. The focus remains on delivering powerful, reliable, and scalable solutions that can adapt to the ever-evolving needs of the digital infrastructure.
Key Drivers, Barriers & Challenges in General Purpose Server
Key Drivers: The General Purpose Server market is propelled by the accelerating adoption of cloud computing, the burgeoning demand for AI and machine learning capabilities, and the continuous growth of big data analytics. Digital transformation initiatives across industries are creating an unprecedented need for robust and scalable computing infrastructure. Furthermore, the expansion of 5G networks and the proliferation of IoT devices are generating vast amounts of data, necessitating powerful server solutions for processing and analysis. Government investments in digital infrastructure and technological modernization also act as significant growth accelerators.
Key Barriers & Challenges: Significant challenges include intense price competition, leading to pressure on profit margins for manufacturers. The complexity of supply chains, particularly for critical components, poses a risk of disruption. Evolving cybersecurity threats demand constant innovation in server security features, adding to development costs. The high capital expenditure required for data center build-outs and server upgrades can be a barrier for some organizations. Furthermore, a shortage of skilled IT professionals capable of managing and optimizing complex server environments can hinder adoption and deployment.
Emerging Opportunities in General Purpose Server
Emerging opportunities in the General Purpose Server market lie in the growing demand for specialized servers tailored for specific high-growth workloads. The widespread adoption of edge computing presents a significant avenue, requiring compact, power-efficient servers deployed closer to data sources. The increasing integration of AI at the edge, for applications in autonomous vehicles, smart cities, and industrial automation, will drive demand for servers with embedded AI accelerators. Furthermore, the development of sustainable and energy-efficient server designs, aligning with global ESG (Environmental, Social, and Governance) mandates, will create new market niches. The ongoing evolution of composable infrastructure, allowing for dynamic allocation of compute, storage, and networking resources, represents another promising area for innovation and market expansion.
Growth Accelerators in the General Purpose Server Industry
Several key catalysts are accelerating the growth of the General Purpose Server industry. The relentless progress in semiconductor technology, leading to more powerful and energy-efficient processors, is a fundamental driver. Strategic partnerships between hardware manufacturers, software developers, and cloud service providers are fostering innovation and expanding market reach. The increasing global demand for data-intensive services, from streaming to online gaming and remote work, necessitates continuous upgrades and expansions of server infrastructure. Government initiatives promoting digitalization and the development of national digital infrastructures, particularly in emerging economies, are also significant growth accelerators.
Key Players Shaping the General Purpose Server Market
- Dell
- HPE
- Inspur
- Lenovo
- Huawei
- Supermicro
- IBM
- H3C
- Cisco
- Oracle
- Fujitsu
- ADLINK
- GIGABYTE
- Nettrix
- Enginetech
- PowerLeader
- Sugon
- Talkweb
- AEWIN
- Hikvision
Notable Milestones in General Purpose Server Sector
- 2019: Introduction of AMD EPYC processors offering increased core counts, significantly impacting the server CPU market.
- 2020: Increased adoption of ARM-based server processors for cloud infrastructure, driven by power efficiency and cost benefits.
- 2021: Significant advancements in AI-specific server designs, incorporating dedicated AI accelerators and optimized architectures.
- 2022: Growing emphasis on liquid cooling solutions for high-density data centers and AI/HPC deployments.
- 2023: Accelerated development of composable infrastructure solutions for greater flexibility in resource allocation.
- 2024: Continued market consolidation through strategic acquisitions and partnerships, focusing on specialized server technologies.
- 2025: Projected significant growth in edge server deployments driven by 5G and IoT expansion.
In-Depth General Purpose Server Market Outlook
The General Purpose Server market outlook remains exceptionally positive, with robust growth anticipated throughout the forecast period. The foundational drivers of digital transformation, cloud computing expansion, and the insatiable demand for AI and big data processing will continue to fuel market expansion. Emerging opportunities in edge computing and specialized AI workloads present significant untapped potential. The industry's ability to innovate and deliver increasingly powerful, energy-efficient, and adaptable server solutions will be crucial in meeting the evolving needs of businesses and consumers alike. Strategic investments in R&D, coupled with adaptive supply chain management and strong customer partnerships, will be key to capitalizing on the projected market growth and maintaining competitive advantage.
General Purpose Server Segmentation
-
1. Application
- 1.1. Internet
- 1.2. Government
- 1.3. Telecommunications
- 1.4. Financial
- 1.5. Other
-
2. Types
- 2.1. Air Cooled
- 2.2. Liquid Cooled
General Purpose Server Segmentation By Geography
-
1. North America
- 1.1. United States
- 1.2. Canada
- 1.3. Mexico
-
2. South America
- 2.1. Brazil
- 2.2. Argentina
- 2.3. Rest of South America
-
3. Europe
- 3.1. United Kingdom
- 3.2. Germany
- 3.3. France
- 3.4. Italy
- 3.5. Spain
- 3.6. Russia
- 3.7. Benelux
- 3.8. Nordics
- 3.9. Rest of Europe
-
4. Middle East & Africa
- 4.1. Turkey
- 4.2. Israel
- 4.3. GCC
- 4.4. North Africa
- 4.5. South Africa
- 4.6. Rest of Middle East & Africa
-
5. Asia Pacific
- 5.1. China
- 5.2. India
- 5.3. Japan
- 5.4. South Korea
- 5.5. ASEAN
- 5.6. Oceania
- 5.7. Rest of Asia Pacific
General Purpose Server Regional Market Share
Geographic Coverage of General Purpose Server
General Purpose Server REPORT HIGHLIGHTS
| Aspects | Details |
|---|---|
| Study Period | 2020-2034 |
| Base Year | 2025 |
| Estimated Year | 2026 |
| Forecast Period | 2026-2034 |
| Historical Period | 2020-2025 |
| Growth Rate | CAGR of 4.5% from 2020-2034 |
| Segmentation |
|
Table of Contents
- 1. Introduction
- 1.1. Research Scope
- 1.2. Market Segmentation
- 1.3. Research Objective
- 1.4. Definitions and Assumptions
- 2. Executive Summary
- 2.1. Market Snapshot
- 3. Market Dynamics
- 3.1. Market Drivers
- 3.2. Market Restrains
- 3.3. Market Trends
- 3.4. Market Opportunities
- 4. Market Factor Analysis
- 4.1. Porters Five Forces
- 4.1.1. Bargaining Power of Suppliers
- 4.1.2. Bargaining Power of Buyers
- 4.1.3. Threat of New Entrants
- 4.1.4. Threat of Substitutes
- 4.1.5. Competitive Rivalry
- 4.2. PESTEL analysis
- 4.3. BCG Analysis
- 4.3.1. Stars (High Growth, High Market Share)
- 4.3.2. Cash Cows (Low Growth, High Market Share)
- 4.3.3. Question Mark (High Growth, Low Market Share)
- 4.3.4. Dogs (Low Growth, Low Market Share)
- 4.4. Ansoff Matrix Analysis
- 4.5. Supply Chain Analysis
- 4.6. Regulatory Landscape
- 4.7. Current Market Potential and Opportunity Assessment (TAM–SAM–SOM Framework)
- 4.8. VDR Analyst Note
- 4.1. Porters Five Forces
- 5. Market Analysis, Insights and Forecast 2021-2033
- 5.1. Market Analysis, Insights and Forecast - by Application
- 5.1.1. Internet
- 5.1.2. Government
- 5.1.3. Telecommunications
- 5.1.4. Financial
- 5.1.5. Other
- 5.2. Market Analysis, Insights and Forecast - by Types
- 5.2.1. Air Cooled
- 5.2.2. Liquid Cooled
- 5.3. Market Analysis, Insights and Forecast - by Region
- 5.3.1. North America
- 5.3.2. South America
- 5.3.3. Europe
- 5.3.4. Middle East & Africa
- 5.3.5. Asia Pacific
- 5.1. Market Analysis, Insights and Forecast - by Application
- 6. Global General Purpose Server Analysis, Insights and Forecast, 2021-2033
- 6.1. Market Analysis, Insights and Forecast - by Application
- 6.1.1. Internet
- 6.1.2. Government
- 6.1.3. Telecommunications
- 6.1.4. Financial
- 6.1.5. Other
- 6.2. Market Analysis, Insights and Forecast - by Types
- 6.2.1. Air Cooled
- 6.2.2. Liquid Cooled
- 6.1. Market Analysis, Insights and Forecast - by Application
- 7. North America General Purpose Server Analysis, Insights and Forecast, 2021-2033
- 7.1. Market Analysis, Insights and Forecast - by Application
- 7.1.1. Internet
- 7.1.2. Government
- 7.1.3. Telecommunications
- 7.1.4. Financial
- 7.1.5. Other
- 7.2. Market Analysis, Insights and Forecast - by Types
- 7.2.1. Air Cooled
- 7.2.2. Liquid Cooled
- 7.1. Market Analysis, Insights and Forecast - by Application
- 8. South America General Purpose Server Analysis, Insights and Forecast, 2021-2033
- 8.1. Market Analysis, Insights and Forecast - by Application
- 8.1.1. Internet
- 8.1.2. Government
- 8.1.3. Telecommunications
- 8.1.4. Financial
- 8.1.5. Other
- 8.2. Market Analysis, Insights and Forecast - by Types
- 8.2.1. Air Cooled
- 8.2.2. Liquid Cooled
- 8.1. Market Analysis, Insights and Forecast - by Application
- 9. Europe General Purpose Server Analysis, Insights and Forecast, 2021-2033
- 9.1. Market Analysis, Insights and Forecast - by Application
- 9.1.1. Internet
- 9.1.2. Government
- 9.1.3. Telecommunications
- 9.1.4. Financial
- 9.1.5. Other
- 9.2. Market Analysis, Insights and Forecast - by Types
- 9.2.1. Air Cooled
- 9.2.2. Liquid Cooled
- 9.1. Market Analysis, Insights and Forecast - by Application
- 10. Middle East & Africa General Purpose Server Analysis, Insights and Forecast, 2021-2033
- 10.1. Market Analysis, Insights and Forecast - by Application
- 10.1.1. Internet
- 10.1.2. Government
- 10.1.3. Telecommunications
- 10.1.4. Financial
- 10.1.5. Other
- 10.2. Market Analysis, Insights and Forecast - by Types
- 10.2.1. Air Cooled
- 10.2.2. Liquid Cooled
- 10.1. Market Analysis, Insights and Forecast - by Application
- 11. Asia Pacific General Purpose Server Analysis, Insights and Forecast, 2021-2033
- 11.1. Market Analysis, Insights and Forecast - by Application
- 11.1.1. Internet
- 11.1.2. Government
- 11.1.3. Telecommunications
- 11.1.4. Financial
- 11.1.5. Other
- 11.2. Market Analysis, Insights and Forecast - by Types
- 11.2.1. Air Cooled
- 11.2.2. Liquid Cooled
- 11.1. Market Analysis, Insights and Forecast - by Application
- 12. Competitive Analysis
- 12.1. Company Profiles
- 12.1.1 Dell
- 12.1.1.1. Company Overview
- 12.1.1.2. Products
- 12.1.1.3. Company Financials
- 12.1.1.4. SWOT Analysis
- 12.1.2 HPE
- 12.1.2.1. Company Overview
- 12.1.2.2. Products
- 12.1.2.3. Company Financials
- 12.1.2.4. SWOT Analysis
- 12.1.3 Inspur
- 12.1.3.1. Company Overview
- 12.1.3.2. Products
- 12.1.3.3. Company Financials
- 12.1.3.4. SWOT Analysis
- 12.1.4 Lenovo
- 12.1.4.1. Company Overview
- 12.1.4.2. Products
- 12.1.4.3. Company Financials
- 12.1.4.4. SWOT Analysis
- 12.1.5 Huawei
- 12.1.5.1. Company Overview
- 12.1.5.2. Products
- 12.1.5.3. Company Financials
- 12.1.5.4. SWOT Analysis
- 12.1.6 Supermicro
- 12.1.6.1. Company Overview
- 12.1.6.2. Products
- 12.1.6.3. Company Financials
- 12.1.6.4. SWOT Analysis
- 12.1.7 IBM
- 12.1.7.1. Company Overview
- 12.1.7.2. Products
- 12.1.7.3. Company Financials
- 12.1.7.4. SWOT Analysis
- 12.1.8 H3C
- 12.1.8.1. Company Overview
- 12.1.8.2. Products
- 12.1.8.3. Company Financials
- 12.1.8.4. SWOT Analysis
- 12.1.9 Cisco
- 12.1.9.1. Company Overview
- 12.1.9.2. Products
- 12.1.9.3. Company Financials
- 12.1.9.4. SWOT Analysis
- 12.1.10 Oracle
- 12.1.10.1. Company Overview
- 12.1.10.2. Products
- 12.1.10.3. Company Financials
- 12.1.10.4. SWOT Analysis
- 12.1.11 Fujitsu
- 12.1.11.1. Company Overview
- 12.1.11.2. Products
- 12.1.11.3. Company Financials
- 12.1.11.4. SWOT Analysis
- 12.1.12 ADLINK
- 12.1.12.1. Company Overview
- 12.1.12.2. Products
- 12.1.12.3. Company Financials
- 12.1.12.4. SWOT Analysis
- 12.1.13 GIGABYTE
- 12.1.13.1. Company Overview
- 12.1.13.2. Products
- 12.1.13.3. Company Financials
- 12.1.13.4. SWOT Analysis
- 12.1.14 Nettrix
- 12.1.14.1. Company Overview
- 12.1.14.2. Products
- 12.1.14.3. Company Financials
- 12.1.14.4. SWOT Analysis
- 12.1.15 Enginetech
- 12.1.15.1. Company Overview
- 12.1.15.2. Products
- 12.1.15.3. Company Financials
- 12.1.15.4. SWOT Analysis
- 12.1.16 PowerLeader
- 12.1.16.1. Company Overview
- 12.1.16.2. Products
- 12.1.16.3. Company Financials
- 12.1.16.4. SWOT Analysis
- 12.1.17 Sugon
- 12.1.17.1. Company Overview
- 12.1.17.2. Products
- 12.1.17.3. Company Financials
- 12.1.17.4. SWOT Analysis
- 12.1.18 Talkweb
- 12.1.18.1. Company Overview
- 12.1.18.2. Products
- 12.1.18.3. Company Financials
- 12.1.18.4. SWOT Analysis
- 12.1.19 AEWIN
- 12.1.19.1. Company Overview
- 12.1.19.2. Products
- 12.1.19.3. Company Financials
- 12.1.19.4. SWOT Analysis
- 12.1.20 Hikvision
- 12.1.20.1. Company Overview
- 12.1.20.2. Products
- 12.1.20.3. Company Financials
- 12.1.20.4. SWOT Analysis
- 12.1.1 Dell
- 12.2. Market Entropy
- 12.2.1 Company's Key Areas Served
- 12.2.2 Recent Developments
- 12.3. Company Market Share Analysis 2025
- 12.3.1 Top 5 Companies Market Share Analysis
- 12.3.2 Top 3 Companies Market Share Analysis
- 12.4. List of Potential Customers
- 13. Research Methodology
List of Figures
- Figure 1: Global General Purpose Server Revenue Breakdown (billion, %) by Region 2025 & 2033
- Figure 2: Global General Purpose Server Volume Breakdown (K, %) by Region 2025 & 2033
- Figure 3: North America General Purpose Server Revenue (billion), by Application 2025 & 2033
- Figure 4: North America General Purpose Server Volume (K), by Application 2025 & 2033
- Figure 5: North America General Purpose Server Revenue Share (%), by Application 2025 & 2033
- Figure 6: North America General Purpose Server Volume Share (%), by Application 2025 & 2033
- Figure 7: North America General Purpose Server Revenue (billion), by Types 2025 & 2033
- Figure 8: North America General Purpose Server Volume (K), by Types 2025 & 2033
- Figure 9: North America General Purpose Server Revenue Share (%), by Types 2025 & 2033
- Figure 10: North America General Purpose Server Volume Share (%), by Types 2025 & 2033
- Figure 11: North America General Purpose Server Revenue (billion), by Country 2025 & 2033
- Figure 12: North America General Purpose Server Volume (K), by Country 2025 & 2033
- Figure 13: North America General Purpose Server Revenue Share (%), by Country 2025 & 2033
- Figure 14: North America General Purpose Server Volume Share (%), by Country 2025 & 2033
- Figure 15: South America General Purpose Server Revenue (billion), by Application 2025 & 2033
- Figure 16: South America General Purpose Server Volume (K), by Application 2025 & 2033
- Figure 17: South America General Purpose Server Revenue Share (%), by Application 2025 & 2033
- Figure 18: South America General Purpose Server Volume Share (%), by Application 2025 & 2033
- Figure 19: South America General Purpose Server Revenue (billion), by Types 2025 & 2033
- Figure 20: South America General Purpose Server Volume (K), by Types 2025 & 2033
- Figure 21: South America General Purpose Server Revenue Share (%), by Types 2025 & 2033
- Figure 22: South America General Purpose Server Volume Share (%), by Types 2025 & 2033
- Figure 23: South America General Purpose Server Revenue (billion), by Country 2025 & 2033
- Figure 24: South America General Purpose Server Volume (K), by Country 2025 & 2033
- Figure 25: South America General Purpose Server Revenue Share (%), by Country 2025 & 2033
- Figure 26: South America General Purpose Server Volume Share (%), by Country 2025 & 2033
- Figure 27: Europe General Purpose Server Revenue (billion), by Application 2025 & 2033
- Figure 28: Europe General Purpose Server Volume (K), by Application 2025 & 2033
- Figure 29: Europe General Purpose Server Revenue Share (%), by Application 2025 & 2033
- Figure 30: Europe General Purpose Server Volume Share (%), by Application 2025 & 2033
- Figure 31: Europe General Purpose Server Revenue (billion), by Types 2025 & 2033
- Figure 32: Europe General Purpose Server Volume (K), by Types 2025 & 2033
- Figure 33: Europe General Purpose Server Revenue Share (%), by Types 2025 & 2033
- Figure 34: Europe General Purpose Server Volume Share (%), by Types 2025 & 2033
- Figure 35: Europe General Purpose Server Revenue (billion), by Country 2025 & 2033
- Figure 36: Europe General Purpose Server Volume (K), by Country 2025 & 2033
- Figure 37: Europe General Purpose Server Revenue Share (%), by Country 2025 & 2033
- Figure 38: Europe General Purpose Server Volume Share (%), by Country 2025 & 2033
- Figure 39: Middle East & Africa General Purpose Server Revenue (billion), by Application 2025 & 2033
- Figure 40: Middle East & Africa General Purpose Server Volume (K), by Application 2025 & 2033
- Figure 41: Middle East & Africa General Purpose Server Revenue Share (%), by Application 2025 & 2033
- Figure 42: Middle East & Africa General Purpose Server Volume Share (%), by Application 2025 & 2033
- Figure 43: Middle East & Africa General Purpose Server Revenue (billion), by Types 2025 & 2033
- Figure 44: Middle East & Africa General Purpose Server Volume (K), by Types 2025 & 2033
- Figure 45: Middle East & Africa General Purpose Server Revenue Share (%), by Types 2025 & 2033
- Figure 46: Middle East & Africa General Purpose Server Volume Share (%), by Types 2025 & 2033
- Figure 47: Middle East & Africa General Purpose Server Revenue (billion), by Country 2025 & 2033
- Figure 48: Middle East & Africa General Purpose Server Volume (K), by Country 2025 & 2033
- Figure 49: Middle East & Africa General Purpose Server Revenue Share (%), by Country 2025 & 2033
- Figure 50: Middle East & Africa General Purpose Server Volume Share (%), by Country 2025 & 2033
- Figure 51: Asia Pacific General Purpose Server Revenue (billion), by Application 2025 & 2033
- Figure 52: Asia Pacific General Purpose Server Volume (K), by Application 2025 & 2033
- Figure 53: Asia Pacific General Purpose Server Revenue Share (%), by Application 2025 & 2033
- Figure 54: Asia Pacific General Purpose Server Volume Share (%), by Application 2025 & 2033
- Figure 55: Asia Pacific General Purpose Server Revenue (billion), by Types 2025 & 2033
- Figure 56: Asia Pacific General Purpose Server Volume (K), by Types 2025 & 2033
- Figure 57: Asia Pacific General Purpose Server Revenue Share (%), by Types 2025 & 2033
- Figure 58: Asia Pacific General Purpose Server Volume Share (%), by Types 2025 & 2033
- Figure 59: Asia Pacific General Purpose Server Revenue (billion), by Country 2025 & 2033
- Figure 60: Asia Pacific General Purpose Server Volume (K), by Country 2025 & 2033
- Figure 61: Asia Pacific General Purpose Server Revenue Share (%), by Country 2025 & 2033
- Figure 62: Asia Pacific General Purpose Server Volume Share (%), by Country 2025 & 2033
List of Tables
- Table 1: Global General Purpose Server Revenue billion Forecast, by Application 2020 & 2033
- Table 2: Global General Purpose Server Volume K Forecast, by Application 2020 & 2033
- Table 3: Global General Purpose Server Revenue billion Forecast, by Types 2020 & 2033
- Table 4: Global General Purpose Server Volume K Forecast, by Types 2020 & 2033
- Table 5: Global General Purpose Server Revenue billion Forecast, by Region 2020 & 2033
- Table 6: Global General Purpose Server Volume K Forecast, by Region 2020 & 2033
- Table 7: Global General Purpose Server Revenue billion Forecast, by Application 2020 & 2033
- Table 8: Global General Purpose Server Volume K Forecast, by Application 2020 & 2033
- Table 9: Global General Purpose Server Revenue billion Forecast, by Types 2020 & 2033
- Table 10: Global General Purpose Server Volume K Forecast, by Types 2020 & 2033
- Table 11: Global General Purpose Server Revenue billion Forecast, by Country 2020 & 2033
- Table 12: Global General Purpose Server Volume K Forecast, by Country 2020 & 2033
- Table 13: United States General Purpose Server Revenue (billion) Forecast, by Application 2020 & 2033
- Table 14: United States General Purpose Server Volume (K) Forecast, by Application 2020 & 2033
- Table 15: Canada General Purpose Server Revenue (billion) Forecast, by Application 2020 & 2033
- Table 16: Canada General Purpose Server Volume (K) Forecast, by Application 2020 & 2033
- Table 17: Mexico General Purpose Server Revenue (billion) Forecast, by Application 2020 & 2033
- Table 18: Mexico General Purpose Server Volume (K) Forecast, by Application 2020 & 2033
- Table 19: Global General Purpose Server Revenue billion Forecast, by Application 2020 & 2033
- Table 20: Global General Purpose Server Volume K Forecast, by Application 2020 & 2033
- Table 21: Global General Purpose Server Revenue billion Forecast, by Types 2020 & 2033
- Table 22: Global General Purpose Server Volume K Forecast, by Types 2020 & 2033
- Table 23: Global General Purpose Server Revenue billion Forecast, by Country 2020 & 2033
- Table 24: Global General Purpose Server Volume K Forecast, by Country 2020 & 2033
- Table 25: Brazil General Purpose Server Revenue (billion) Forecast, by Application 2020 & 2033
- Table 26: Brazil General Purpose Server Volume (K) Forecast, by Application 2020 & 2033
- Table 27: Argentina General Purpose Server Revenue (billion) Forecast, by Application 2020 & 2033
- Table 28: Argentina General Purpose Server Volume (K) Forecast, by Application 2020 & 2033
- Table 29: Rest of South America General Purpose Server Revenue (billion) Forecast, by Application 2020 & 2033
- Table 30: Rest of South America General Purpose Server Volume (K) Forecast, by Application 2020 & 2033
- Table 31: Global General Purpose Server Revenue billion Forecast, by Application 2020 & 2033
- Table 32: Global General Purpose Server Volume K Forecast, by Application 2020 & 2033
- Table 33: Global General Purpose Server Revenue billion Forecast, by Types 2020 & 2033
- Table 34: Global General Purpose Server Volume K Forecast, by Types 2020 & 2033
- Table 35: Global General Purpose Server Revenue billion Forecast, by Country 2020 & 2033
- Table 36: Global General Purpose Server Volume K Forecast, by Country 2020 & 2033
- Table 37: United Kingdom General Purpose Server Revenue (billion) Forecast, by Application 2020 & 2033
- Table 38: United Kingdom General Purpose Server Volume (K) Forecast, by Application 2020 & 2033
- Table 39: Germany General Purpose Server Revenue (billion) Forecast, by Application 2020 & 2033
- Table 40: Germany General Purpose Server Volume (K) Forecast, by Application 2020 & 2033
- Table 41: France General Purpose Server Revenue (billion) Forecast, by Application 2020 & 2033
- Table 42: France General Purpose Server Volume (K) Forecast, by Application 2020 & 2033
- Table 43: Italy General Purpose Server Revenue (billion) Forecast, by Application 2020 & 2033
- Table 44: Italy General Purpose Server Volume (K) Forecast, by Application 2020 & 2033
- Table 45: Spain General Purpose Server Revenue (billion) Forecast, by Application 2020 & 2033
- Table 46: Spain General Purpose Server Volume (K) Forecast, by Application 2020 & 2033
- Table 47: Russia General Purpose Server Revenue (billion) Forecast, by Application 2020 & 2033
- Table 48: Russia General Purpose Server Volume (K) Forecast, by Application 2020 & 2033
- Table 49: Benelux General Purpose Server Revenue (billion) Forecast, by Application 2020 & 2033
- Table 50: Benelux General Purpose Server Volume (K) Forecast, by Application 2020 & 2033
- Table 51: Nordics General Purpose Server Revenue (billion) Forecast, by Application 2020 & 2033
- Table 52: Nordics General Purpose Server Volume (K) Forecast, by Application 2020 & 2033
- Table 53: Rest of Europe General Purpose Server Revenue (billion) Forecast, by Application 2020 & 2033
- Table 54: Rest of Europe General Purpose Server Volume (K) Forecast, by Application 2020 & 2033
- Table 55: Global General Purpose Server Revenue billion Forecast, by Application 2020 & 2033
- Table 56: Global General Purpose Server Volume K Forecast, by Application 2020 & 2033
- Table 57: Global General Purpose Server Revenue billion Forecast, by Types 2020 & 2033
- Table 58: Global General Purpose Server Volume K Forecast, by Types 2020 & 2033
- Table 59: Global General Purpose Server Revenue billion Forecast, by Country 2020 & 2033
- Table 60: Global General Purpose Server Volume K Forecast, by Country 2020 & 2033
- Table 61: Turkey General Purpose Server Revenue (billion) Forecast, by Application 2020 & 2033
- Table 62: Turkey General Purpose Server Volume (K) Forecast, by Application 2020 & 2033
- Table 63: Israel General Purpose Server Revenue (billion) Forecast, by Application 2020 & 2033
- Table 64: Israel General Purpose Server Volume (K) Forecast, by Application 2020 & 2033
- Table 65: GCC General Purpose Server Revenue (billion) Forecast, by Application 2020 & 2033
- Table 66: GCC General Purpose Server Volume (K) Forecast, by Application 2020 & 2033
- Table 67: North Africa General Purpose Server Revenue (billion) Forecast, by Application 2020 & 2033
- Table 68: North Africa General Purpose Server Volume (K) Forecast, by Application 2020 & 2033
- Table 69: South Africa General Purpose Server Revenue (billion) Forecast, by Application 2020 & 2033
- Table 70: South Africa General Purpose Server Volume (K) Forecast, by Application 2020 & 2033
- Table 71: Rest of Middle East & Africa General Purpose Server Revenue (billion) Forecast, by Application 2020 & 2033
- Table 72: Rest of Middle East & Africa General Purpose Server Volume (K) Forecast, by Application 2020 & 2033
- Table 73: Global General Purpose Server Revenue billion Forecast, by Application 2020 & 2033
- Table 74: Global General Purpose Server Volume K Forecast, by Application 2020 & 2033
- Table 75: Global General Purpose Server Revenue billion Forecast, by Types 2020 & 2033
- Table 76: Global General Purpose Server Volume K Forecast, by Types 2020 & 2033
- Table 77: Global General Purpose Server Revenue billion Forecast, by Country 2020 & 2033
- Table 78: Global General Purpose Server Volume K Forecast, by Country 2020 & 2033
- Table 79: China General Purpose Server Revenue (billion) Forecast, by Application 2020 & 2033
- Table 80: China General Purpose Server Volume (K) Forecast, by Application 2020 & 2033
- Table 81: India General Purpose Server Revenue (billion) Forecast, by Application 2020 & 2033
- Table 82: India General Purpose Server Volume (K) Forecast, by Application 2020 & 2033
- Table 83: Japan General Purpose Server Revenue (billion) Forecast, by Application 2020 & 2033
- Table 84: Japan General Purpose Server Volume (K) Forecast, by Application 2020 & 2033
- Table 85: South Korea General Purpose Server Revenue (billion) Forecast, by Application 2020 & 2033
- Table 86: South Korea General Purpose Server Volume (K) Forecast, by Application 2020 & 2033
- Table 87: ASEAN General Purpose Server Revenue (billion) Forecast, by Application 2020 & 2033
- Table 88: ASEAN General Purpose Server Volume (K) Forecast, by Application 2020 & 2033
- Table 89: Oceania General Purpose Server Revenue (billion) Forecast, by Application 2020 & 2033
- Table 90: Oceania General Purpose Server Volume (K) Forecast, by Application 2020 & 2033
- Table 91: Rest of Asia Pacific General Purpose Server Revenue (billion) Forecast, by Application 2020 & 2033
- Table 92: Rest of Asia Pacific General Purpose Server Volume (K) Forecast, by Application 2020 & 2033
Frequently Asked Questions
1. What is the projected Compound Annual Growth Rate (CAGR) of the General Purpose Server?
The projected CAGR is approximately 4.5%.
2. Which companies are prominent players in the General Purpose Server?
Key companies in the market include Dell, HPE, Inspur, Lenovo, Huawei, Supermicro, IBM, H3C, Cisco, Oracle, Fujitsu, ADLINK, GIGABYTE, Nettrix, Enginetech, PowerLeader, Sugon, Talkweb, AEWIN, Hikvision.
3. What are the main segments of the General Purpose Server?
The market segments include Application, Types.
4. Can you provide details about the market size?
The market size is estimated to be USD 100 billion as of 2022.
5. What are some drivers contributing to market growth?
N/A
6. What are the notable trends driving market growth?
N/A
7. Are there any restraints impacting market growth?
N/A
8. Can you provide examples of recent developments in the market?
N/A
9. What pricing options are available for accessing the report?
Pricing options include single-user, multi-user, and enterprise licenses priced at USD 3350.00, USD 5025.00, and USD 6700.00 respectively.
10. Is the market size provided in terms of value or volume?
The market size is provided in terms of value, measured in billion and volume, measured in K.
11. Are there any specific market keywords associated with the report?
Yes, the market keyword associated with the report is "General Purpose Server," which aids in identifying and referencing the specific market segment covered.
12. How do I determine which pricing option suits my needs best?
The pricing options vary based on user requirements and access needs. Individual users may opt for single-user licenses, while businesses requiring broader access may choose multi-user or enterprise licenses for cost-effective access to the report.
13. Are there any additional resources or data provided in the General Purpose Server report?
While the report offers comprehensive insights, it's advisable to review the specific contents or supplementary materials provided to ascertain if additional resources or data are available.
14. How can I stay updated on further developments or reports in the General Purpose Server?
To stay informed about further developments, trends, and reports in the General Purpose Server, consider subscribing to industry newsletters, following relevant companies and organizations, or regularly checking reputable industry news sources and publications.
Methodology
Step 1 - Identification of Relevant Samples Size from Population Database


Step 2 - Approaches for Defining Global Market Size (Value, Volume* & Price*)

Note*: In applicable scenarios
Step 3 - Data Sources
Primary Research
- Web Analytics
- Survey Reports
- Research Institute
- Latest Research Reports
- Opinion Leaders
Secondary Research
- Annual Reports
- White Paper
- Latest Press Release
- Industry Association
- Paid Database
- Investor Presentations

Step 4 - Data Triangulation
Involves using different sources of information in order to increase the validity of a study
These sources are likely to be stakeholders in a program - participants, other researchers, program staff, other community members, and so on.
Then we put all data in single framework & apply various statistical tools to find out the dynamic on the market.
During the analysis stage, feedback from the stakeholder groups would be compared to determine areas of agreement as well as areas of divergence