

Key Insights
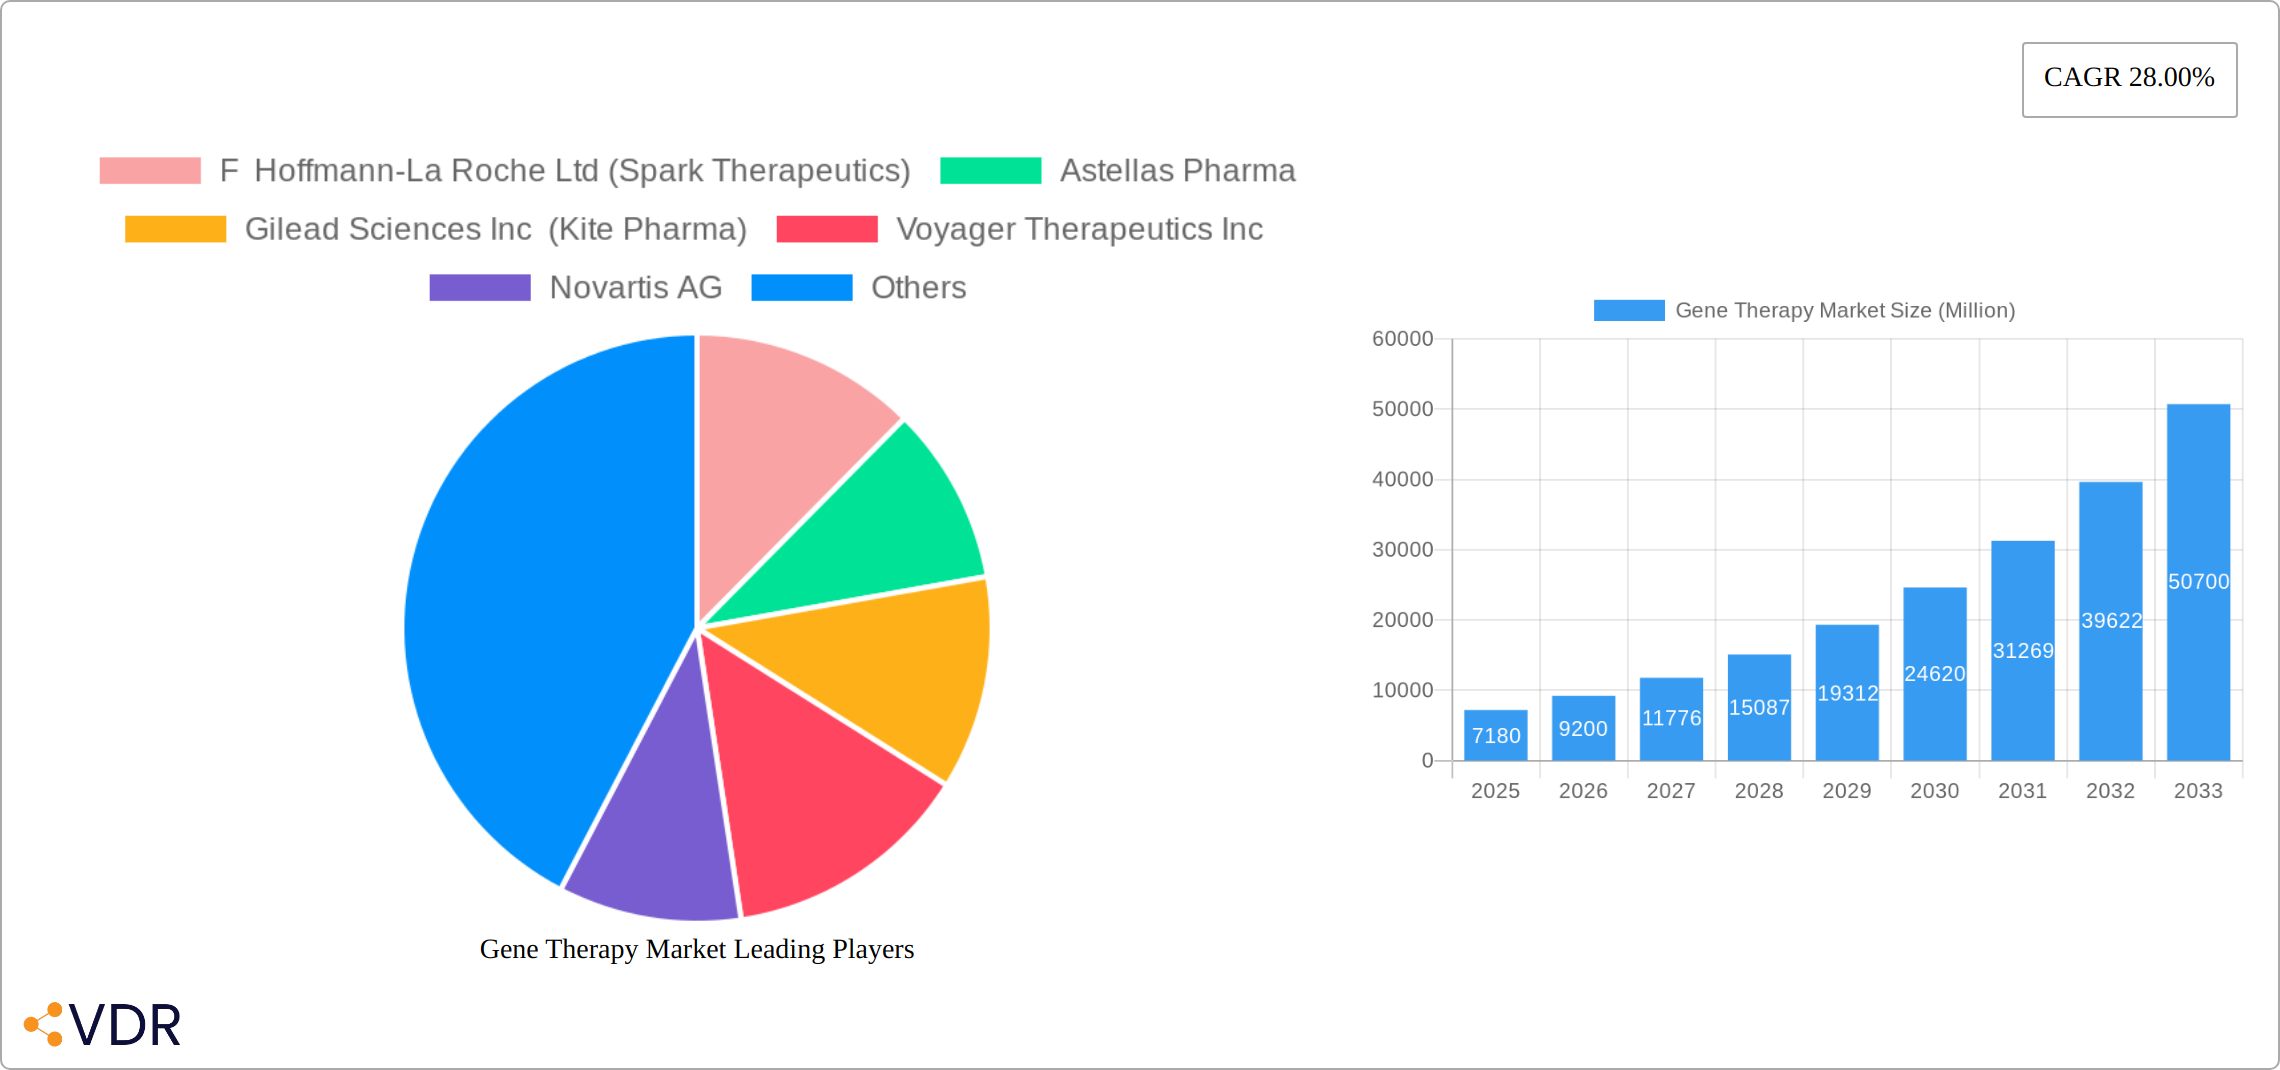
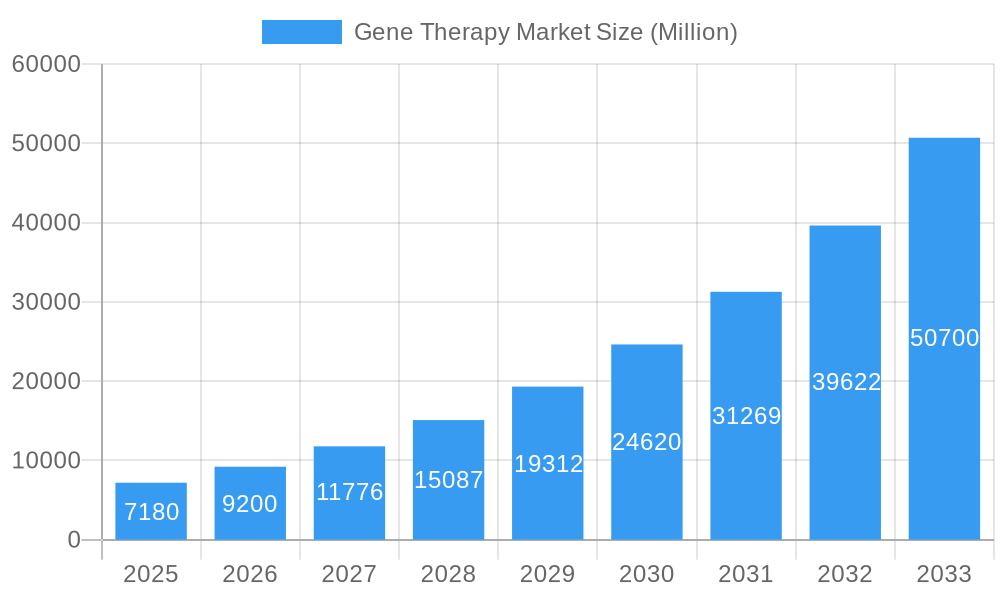
The global gene therapy market, valued at $7.18 billion in 2025, is projected to experience substantial growth, driven by a compound annual growth rate (CAGR) of 28% from 2025 to 2033. This rapid expansion is fueled by several key factors. Firstly, the increasing prevalence of genetic disorders, such as cancer, metabolic disorders, and eye diseases, creates a significant unmet medical need. Secondly, advancements in viral vector technologies, particularly adeno-associated virus (AAV) vectors and lentiviral vectors, are improving the safety and efficacy of gene therapies, leading to a wider range of therapeutic applications. The success of several gene therapy products in recent years, receiving regulatory approvals and demonstrating clinical efficacy, has further boosted investor confidence and accelerated market growth. Finally, ongoing research and development efforts focused on novel gene editing techniques, such as CRISPR-Cas9, hold immense potential for future innovation and market expansion. The competitive landscape features a mix of large pharmaceutical companies with established infrastructure and smaller, more specialized biotech firms, driving innovation and ensuring a diverse range of therapeutic approaches.
Gene Therapy Market Market Size (In Billion)
Significant regional variations in market share are anticipated, with North America currently holding the largest share due to high adoption rates, advanced healthcare infrastructure, and substantial investments in research and development. However, rapidly developing economies in Asia-Pacific and Europe are expected to witness significant growth in the coming years, driven by increasing awareness of gene therapy benefits, growing healthcare spending, and regulatory approvals. While challenges remain, including high manufacturing costs and potential long-term safety concerns, the overall market outlook for gene therapy remains exceptionally positive, promising transformative advancements in treating a wide range of debilitating diseases and improving patient outcomes. The market segmentation by indication and technology reflects the diverse and evolving nature of the field, with ongoing research continually expanding treatment options.
Gene Therapy Market Company Market Share
Gene Therapy Market: A Comprehensive Report (2019-2033)
This in-depth report provides a comprehensive analysis of the Gene Therapy Market, encompassing historical data (2019-2024), current estimates (2025), and future projections (2025-2033). We delve into market dynamics, growth trends, dominant segments, key players, and emerging opportunities within this rapidly evolving sector. The report is crucial for industry professionals, investors, and researchers seeking a detailed understanding of this transformative medical field. Market values are presented in Million units.
Gene Therapy Market Market Dynamics & Structure
The gene therapy market is experiencing explosive growth, driven by a confluence of factors: breakthrough technological advancements, the urgent need for effective treatments for previously incurable genetic diseases, and increasing investment from both public and private sectors. While several key players dominate specific segments, the market exhibits moderate concentration, leaving room for emerging players and innovative therapies. Technological innovation remains the primary engine of growth, with continuous refinement of viral vector technologies (AAV, Lentiviral, etc.), gene editing tools (like CRISPR-Cas9 and base editing), and advanced delivery systems. This rapid innovation, however, is balanced by a stringent regulatory landscape (e.g., FDA, EMA), which impacts market entry and approval timelines, creating a considerable hurdle for new entrants. Manufacturing complexities and high development costs represent significant innovation barriers, further shaping the competitive landscape. The market is also highly dynamic, characterized by considerable mergers and acquisitions (M&A) activity, with larger pharmaceutical companies strategically acquiring smaller biotech firms possessing promising gene therapy pipelines.
- Market Concentration: Moderately concentrated, with a few key players holding significant but not dominant market share. The competitive landscape is evolving rapidly.
- Technological Innovation: Rapid advancements in viral vectors (AAV, Lentiviral, Adenoviral), CRISPR-Cas9 and base editing gene editing, improved delivery methods (targeted delivery, nanoparticles), and next-generation sequencing technologies are driving market expansion.
- Regulatory Landscape: Stringent regulatory approvals (e.g., FDA, EMA, PMDA) influence market entry and product launch timelines, requiring substantial investment in clinical trials and regulatory compliance.
- Competitive Substitutes: While limited direct substitutes exist, conventional therapies and emerging modalities (e.g., cell therapies) pose indirect competition.
- M&A Activity: Significant M&A activity continues, reflecting the strategic importance of gene therapy within the broader pharmaceutical and biotechnology industries.
- Innovation Barriers: High R&D costs, manufacturing complexities (particularly for viral vectors), long and expensive clinical trial periods, and the inherent challenges associated with gene editing technology remain significant hurdles.
Gene Therapy Market Growth Trends & Insights
The gene therapy market is experiencing exponential growth, driven by a confluence of factors. The increasing prevalence of genetic disorders, coupled with a growing understanding of gene function and editing technologies, is fueling demand. Technological disruptions, such as the development of more efficient and safer viral vectors, are significantly impacting market dynamics. Consumer behavior is shifting towards personalized medicine, further bolstering the adoption of gene therapies. The market is expected to grow at a CAGR of xx% during the forecast period (2025-2033), reaching a market size of xx Million units by 2033. Market penetration is currently low but is expected to increase significantly as more gene therapies receive regulatory approval and become more widely accessible. The adoption rate is highest in developed nations with robust healthcare infrastructure.
Dominant Regions, Countries, or Segments in Gene Therapy Market
North America currently dominates the gene therapy market, driven by high research funding, advanced healthcare infrastructure, and early adoption of novel therapies. Within indications, Cancer and Spinal Muscular Atrophy (SMA) segments show the highest growth. Adeno-associated virus (AAV) vectors currently hold a substantial market share due to their established safety profile and efficacy.
- Leading Region: North America (xx% market share in 2025)
- Leading Indication: Cancer (xx% market share in 2025), followed by SMA.
- Leading Vector Technology: Adeno-associated virus (AAV) vectors (xx% market share in 2025).
- Key Drivers: High R&D investment, strong regulatory support, advanced healthcare infrastructure, growing awareness of genetic disorders.
Gene Therapy Market Product Landscape
The gene therapy product landscape is marked by a diverse range of therapies targeting various indications, utilizing different vector technologies and delivery methods. Product innovation is driven by enhanced vector design, improved targeting mechanisms, and more effective gene editing techniques. Unique selling propositions focus on improved efficacy, reduced side effects, and personalized treatment approaches. Technological advancements continue to push the boundaries of gene therapy, enabling treatment of previously intractable diseases.
Key Drivers, Barriers & Challenges in Gene Therapy Market
Key Drivers:
- Technological advancements in gene editing and vector development
- Growing prevalence of genetic disorders
- Increased investment in R&D and clinical trials
- Favorable regulatory environment in certain regions
- Growing awareness and acceptance among patients and physicians
Challenges & Restraints:
- High R&D costs and long development timelines
- Manufacturing complexities and scalability challenges
- Potential long-term side effects and safety concerns
- Stringent regulatory requirements and approval processes
- High treatment costs limiting accessibility
Emerging Opportunities in Gene Therapy Market
- Expansion into emerging markets with unmet medical needs
- Development of gene therapies for currently untreatable diseases
- Advancement of gene editing technologies, like CRISPR, for improved precision
- Combination therapies integrating gene therapy with other modalities
- Personalized gene therapies tailored to individual patient genetics
Growth Accelerators in the Gene Therapy Market Industry
Technological breakthroughs, strategic partnerships between pharmaceutical companies and biotech startups, and the expansion of gene therapy applications into new therapeutic areas are key catalysts driving long-term market growth. Increased investment from both public and private sectors further fuels this expansion.
Key Players Shaping the Gene Therapy Market Market
- F Hoffmann-La Roche Ltd (Spark Therapeutics)
- Astellas Pharma
- Gilead Sciences Inc (Kite Pharma)
- Voyager Therapeutics Inc
- Novartis AG
- Amgen Inc
- UniQure NV
- Generation Bio
- Abeona Therapeutics Inc
- Bluebird Bio Inc
- Poseida Therapeutics
- Biogen Inc
Notable Milestones in Gene Therapy Market Sector
- August 2022: US FDA approves Zynteglo (betibeglogene autotemcel), the first cell-based gene therapy for beta-thalassemia.
- October 2022: Sarepta Therapeutics applies for accelerated FDA approval of delandistrogene moxeparvovec for Duchenne Muscular Dystrophy (DMD).
In-Depth Gene Therapy Market Market Outlook
The future of the gene therapy market is exceptionally promising. Continued technological advancements, coupled with increasing regulatory approvals and growing patient awareness, will drive substantial market expansion. Strategic partnerships and investments will further accelerate growth, creating significant opportunities for both established pharmaceutical companies and emerging biotech firms. The market is poised for significant expansion across various therapeutic areas, resulting in a transformative impact on healthcare.
Gene Therapy Market Segmentation
-
1. Indication
- 1.1. Cancer
- 1.2. Metabolic Disorders
- 1.3. Eye Disorders
- 1.4. Spinal Muscular Atrophy
- 1.5. Other Indications
-
2. Technology
- 2.1. Adeno Virus Vector
- 2.2. Adeno-associated Virus Vector
- 2.3. Lentiviral Vector
- 2.4. Retroviral Vector
- 2.5. Herpes Virus Vector
- 2.6. Other Technologies
Gene Therapy Market Segmentation By Geography
-
1. North America
- 1.1. United States
- 1.2. Canada
- 1.3. Mexico
-
2. Europe
- 2.1. Germany
- 2.2. United Kingdom
- 2.3. France
- 2.4. Italy
- 2.5. Spain
- 2.6. Rest of Europe
-
3. Asia Pacific
- 3.1. China
- 3.2. Japan
- 3.3. India
- 3.4. Australia
- 3.5. South Korea
- 3.6. Rest of Asia Pacific
-
4. Middle East and Africa
- 4.1. GCC
- 4.2. South Africa
- 4.3. Rest of Middle East and Africa
-
5. South America
- 5.1. Brazil
- 5.2. Argentina
- 5.3. Rest of South America
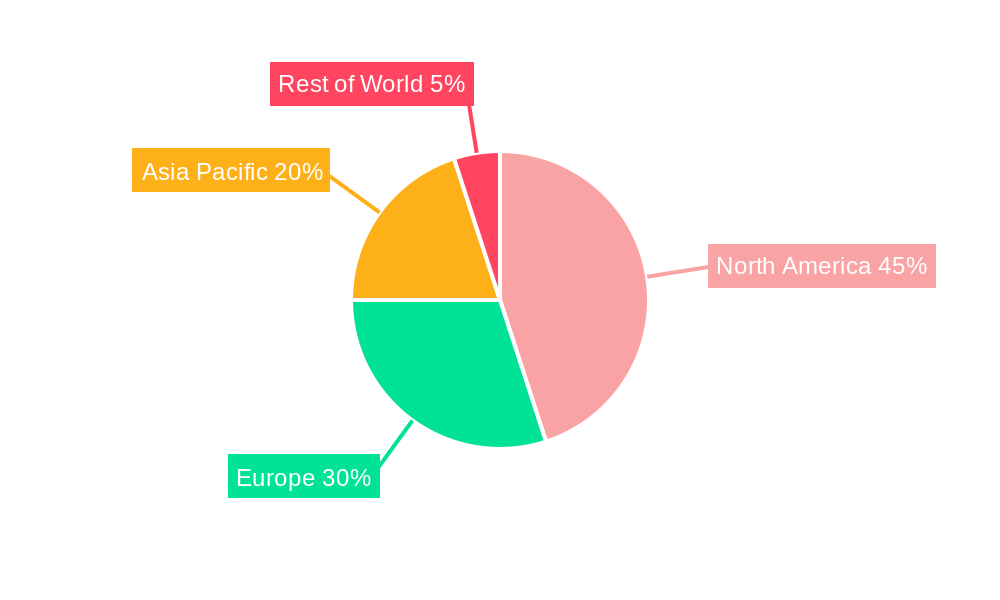
Gene Therapy Market Regional Market Share
Geographic Coverage of Gene Therapy Market
Gene Therapy Market REPORT HIGHLIGHTS
| Aspects | Details |
|---|---|
| Study Period | 2020-2034 |
| Base Year | 2025 |
| Estimated Year | 2026 |
| Forecast Period | 2026-2034 |
| Historical Period | 2020-2025 |
| Growth Rate | CAGR of 28.00% from 2020-2034 |
| Segmentation |
|
Table of Contents
- 1. Introduction
- 1.1. Research Scope
- 1.2. Market Segmentation
- 1.3. Research Methodology
- 1.4. Definitions and Assumptions
- 2. Executive Summary
- 2.1. Introduction
- 3. Market Dynamics
- 3.1. Introduction
- 3.2. Market Drivers
- 3.2.1. Rising Investments in Research and Development; Technological Advancements; Growing Prevalence of Target Diseases like Cancer
- 3.3. Market Restrains
- 3.3.1. Lack of Standard Regulations; High Price of Products
- 3.4. Market Trends
- 3.4.1. Cancer is Expected to Hold Significant Market Share in the Indication Segment over the Forecast Period
- 4. Market Factor Analysis
- 4.1. Porters Five Forces
- 4.2. Supply/Value Chain
- 4.3. PESTEL analysis
- 4.4. Market Entropy
- 4.5. Patent/Trademark Analysis
- 5. Global Gene Therapy Market Analysis, Insights and Forecast, 2020-2032
- 5.1. Market Analysis, Insights and Forecast - by Indication
- 5.1.1. Cancer
- 5.1.2. Metabolic Disorders
- 5.1.3. Eye Disorders
- 5.1.4. Spinal Muscular Atrophy
- 5.1.5. Other Indications
- 5.2. Market Analysis, Insights and Forecast - by Technology
- 5.2.1. Adeno Virus Vector
- 5.2.2. Adeno-associated Virus Vector
- 5.2.3. Lentiviral Vector
- 5.2.4. Retroviral Vector
- 5.2.5. Herpes Virus Vector
- 5.2.6. Other Technologies
- 5.3. Market Analysis, Insights and Forecast - by Region
- 5.3.1. North America
- 5.3.2. Europe
- 5.3.3. Asia Pacific
- 5.3.4. Middle East and Africa
- 5.3.5. South America
- 5.1. Market Analysis, Insights and Forecast - by Indication
- 6. North America Gene Therapy Market Analysis, Insights and Forecast, 2020-2032
- 6.1. Market Analysis, Insights and Forecast - by Indication
- 6.1.1. Cancer
- 6.1.2. Metabolic Disorders
- 6.1.3. Eye Disorders
- 6.1.4. Spinal Muscular Atrophy
- 6.1.5. Other Indications
- 6.2. Market Analysis, Insights and Forecast - by Technology
- 6.2.1. Adeno Virus Vector
- 6.2.2. Adeno-associated Virus Vector
- 6.2.3. Lentiviral Vector
- 6.2.4. Retroviral Vector
- 6.2.5. Herpes Virus Vector
- 6.2.6. Other Technologies
- 6.1. Market Analysis, Insights and Forecast - by Indication
- 7. Europe Gene Therapy Market Analysis, Insights and Forecast, 2020-2032
- 7.1. Market Analysis, Insights and Forecast - by Indication
- 7.1.1. Cancer
- 7.1.2. Metabolic Disorders
- 7.1.3. Eye Disorders
- 7.1.4. Spinal Muscular Atrophy
- 7.1.5. Other Indications
- 7.2. Market Analysis, Insights and Forecast - by Technology
- 7.2.1. Adeno Virus Vector
- 7.2.2. Adeno-associated Virus Vector
- 7.2.3. Lentiviral Vector
- 7.2.4. Retroviral Vector
- 7.2.5. Herpes Virus Vector
- 7.2.6. Other Technologies
- 7.1. Market Analysis, Insights and Forecast - by Indication
- 8. Asia Pacific Gene Therapy Market Analysis, Insights and Forecast, 2020-2032
- 8.1. Market Analysis, Insights and Forecast - by Indication
- 8.1.1. Cancer
- 8.1.2. Metabolic Disorders
- 8.1.3. Eye Disorders
- 8.1.4. Spinal Muscular Atrophy
- 8.1.5. Other Indications
- 8.2. Market Analysis, Insights and Forecast - by Technology
- 8.2.1. Adeno Virus Vector
- 8.2.2. Adeno-associated Virus Vector
- 8.2.3. Lentiviral Vector
- 8.2.4. Retroviral Vector
- 8.2.5. Herpes Virus Vector
- 8.2.6. Other Technologies
- 8.1. Market Analysis, Insights and Forecast - by Indication
- 9. Middle East and Africa Gene Therapy Market Analysis, Insights and Forecast, 2020-2032
- 9.1. Market Analysis, Insights and Forecast - by Indication
- 9.1.1. Cancer
- 9.1.2. Metabolic Disorders
- 9.1.3. Eye Disorders
- 9.1.4. Spinal Muscular Atrophy
- 9.1.5. Other Indications
- 9.2. Market Analysis, Insights and Forecast - by Technology
- 9.2.1. Adeno Virus Vector
- 9.2.2. Adeno-associated Virus Vector
- 9.2.3. Lentiviral Vector
- 9.2.4. Retroviral Vector
- 9.2.5. Herpes Virus Vector
- 9.2.6. Other Technologies
- 9.1. Market Analysis, Insights and Forecast - by Indication
- 10. South America Gene Therapy Market Analysis, Insights and Forecast, 2020-2032
- 10.1. Market Analysis, Insights and Forecast - by Indication
- 10.1.1. Cancer
- 10.1.2. Metabolic Disorders
- 10.1.3. Eye Disorders
- 10.1.4. Spinal Muscular Atrophy
- 10.1.5. Other Indications
- 10.2. Market Analysis, Insights and Forecast - by Technology
- 10.2.1. Adeno Virus Vector
- 10.2.2. Adeno-associated Virus Vector
- 10.2.3. Lentiviral Vector
- 10.2.4. Retroviral Vector
- 10.2.5. Herpes Virus Vector
- 10.2.6. Other Technologies
- 10.1. Market Analysis, Insights and Forecast - by Indication
- 11. Competitive Analysis
- 11.1. Global Market Share Analysis 2025
- 11.2. Company Profiles
- 11.2.1 F Hoffmann-La Roche Ltd (Spark Therapeutics)
- 11.2.1.1. Overview
- 11.2.1.2. Products
- 11.2.1.3. SWOT Analysis
- 11.2.1.4. Recent Developments
- 11.2.1.5. Financials (Based on Availability)
- 11.2.2 Astellas Pharma
- 11.2.2.1. Overview
- 11.2.2.2. Products
- 11.2.2.3. SWOT Analysis
- 11.2.2.4. Recent Developments
- 11.2.2.5. Financials (Based on Availability)
- 11.2.3 Gilead Sciences Inc (Kite Pharma)
- 11.2.3.1. Overview
- 11.2.3.2. Products
- 11.2.3.3. SWOT Analysis
- 11.2.3.4. Recent Developments
- 11.2.3.5. Financials (Based on Availability)
- 11.2.4 Voyager Therapeutics Inc
- 11.2.4.1. Overview
- 11.2.4.2. Products
- 11.2.4.3. SWOT Analysis
- 11.2.4.4. Recent Developments
- 11.2.4.5. Financials (Based on Availability)
- 11.2.5 Novartis AG
- 11.2.5.1. Overview
- 11.2.5.2. Products
- 11.2.5.3. SWOT Analysis
- 11.2.5.4. Recent Developments
- 11.2.5.5. Financials (Based on Availability)
- 11.2.6 Amgen Inc
- 11.2.6.1. Overview
- 11.2.6.2. Products
- 11.2.6.3. SWOT Analysis
- 11.2.6.4. Recent Developments
- 11.2.6.5. Financials (Based on Availability)
- 11.2.7 UniQure NV
- 11.2.7.1. Overview
- 11.2.7.2. Products
- 11.2.7.3. SWOT Analysis
- 11.2.7.4. Recent Developments
- 11.2.7.5. Financials (Based on Availability)
- 11.2.8 Generation Bio
- 11.2.8.1. Overview
- 11.2.8.2. Products
- 11.2.8.3. SWOT Analysis
- 11.2.8.4. Recent Developments
- 11.2.8.5. Financials (Based on Availability)
- 11.2.9 Abeona Therapeutics Inc
- 11.2.9.1. Overview
- 11.2.9.2. Products
- 11.2.9.3. SWOT Analysis
- 11.2.9.4. Recent Developments
- 11.2.9.5. Financials (Based on Availability)
- 11.2.10 Bluebird Bio Inc
- 11.2.10.1. Overview
- 11.2.10.2. Products
- 11.2.10.3. SWOT Analysis
- 11.2.10.4. Recent Developments
- 11.2.10.5. Financials (Based on Availability)
- 11.2.11 Poseida Therapeutics
- 11.2.11.1. Overview
- 11.2.11.2. Products
- 11.2.11.3. SWOT Analysis
- 11.2.11.4. Recent Developments
- 11.2.11.5. Financials (Based on Availability)
- 11.2.12 Biogen Inc
- 11.2.12.1. Overview
- 11.2.12.2. Products
- 11.2.12.3. SWOT Analysis
- 11.2.12.4. Recent Developments
- 11.2.12.5. Financials (Based on Availability)
- 11.2.1 F Hoffmann-La Roche Ltd (Spark Therapeutics)
List of Figures
- Figure 1: Global Gene Therapy Market Revenue Breakdown (Million, %) by Region 2025 & 2033
- Figure 2: Global Gene Therapy Market Volume Breakdown (K Unit, %) by Region 2025 & 2033
- Figure 3: North America Gene Therapy Market Revenue (Million), by Indication 2025 & 2033
- Figure 4: North America Gene Therapy Market Volume (K Unit), by Indication 2025 & 2033
- Figure 5: North America Gene Therapy Market Revenue Share (%), by Indication 2025 & 2033
- Figure 6: North America Gene Therapy Market Volume Share (%), by Indication 2025 & 2033
- Figure 7: North America Gene Therapy Market Revenue (Million), by Technology 2025 & 2033
- Figure 8: North America Gene Therapy Market Volume (K Unit), by Technology 2025 & 2033
- Figure 9: North America Gene Therapy Market Revenue Share (%), by Technology 2025 & 2033
- Figure 10: North America Gene Therapy Market Volume Share (%), by Technology 2025 & 2033
- Figure 11: North America Gene Therapy Market Revenue (Million), by Country 2025 & 2033
- Figure 12: North America Gene Therapy Market Volume (K Unit), by Country 2025 & 2033
- Figure 13: North America Gene Therapy Market Revenue Share (%), by Country 2025 & 2033
- Figure 14: North America Gene Therapy Market Volume Share (%), by Country 2025 & 2033
- Figure 15: Europe Gene Therapy Market Revenue (Million), by Indication 2025 & 2033
- Figure 16: Europe Gene Therapy Market Volume (K Unit), by Indication 2025 & 2033
- Figure 17: Europe Gene Therapy Market Revenue Share (%), by Indication 2025 & 2033
- Figure 18: Europe Gene Therapy Market Volume Share (%), by Indication 2025 & 2033
- Figure 19: Europe Gene Therapy Market Revenue (Million), by Technology 2025 & 2033
- Figure 20: Europe Gene Therapy Market Volume (K Unit), by Technology 2025 & 2033
- Figure 21: Europe Gene Therapy Market Revenue Share (%), by Technology 2025 & 2033
- Figure 22: Europe Gene Therapy Market Volume Share (%), by Technology 2025 & 2033
- Figure 23: Europe Gene Therapy Market Revenue (Million), by Country 2025 & 2033
- Figure 24: Europe Gene Therapy Market Volume (K Unit), by Country 2025 & 2033
- Figure 25: Europe Gene Therapy Market Revenue Share (%), by Country 2025 & 2033
- Figure 26: Europe Gene Therapy Market Volume Share (%), by Country 2025 & 2033
- Figure 27: Asia Pacific Gene Therapy Market Revenue (Million), by Indication 2025 & 2033
- Figure 28: Asia Pacific Gene Therapy Market Volume (K Unit), by Indication 2025 & 2033
- Figure 29: Asia Pacific Gene Therapy Market Revenue Share (%), by Indication 2025 & 2033
- Figure 30: Asia Pacific Gene Therapy Market Volume Share (%), by Indication 2025 & 2033
- Figure 31: Asia Pacific Gene Therapy Market Revenue (Million), by Technology 2025 & 2033
- Figure 32: Asia Pacific Gene Therapy Market Volume (K Unit), by Technology 2025 & 2033
- Figure 33: Asia Pacific Gene Therapy Market Revenue Share (%), by Technology 2025 & 2033
- Figure 34: Asia Pacific Gene Therapy Market Volume Share (%), by Technology 2025 & 2033
- Figure 35: Asia Pacific Gene Therapy Market Revenue (Million), by Country 2025 & 2033
- Figure 36: Asia Pacific Gene Therapy Market Volume (K Unit), by Country 2025 & 2033
- Figure 37: Asia Pacific Gene Therapy Market Revenue Share (%), by Country 2025 & 2033
- Figure 38: Asia Pacific Gene Therapy Market Volume Share (%), by Country 2025 & 2033
- Figure 39: Middle East and Africa Gene Therapy Market Revenue (Million), by Indication 2025 & 2033
- Figure 40: Middle East and Africa Gene Therapy Market Volume (K Unit), by Indication 2025 & 2033
- Figure 41: Middle East and Africa Gene Therapy Market Revenue Share (%), by Indication 2025 & 2033
- Figure 42: Middle East and Africa Gene Therapy Market Volume Share (%), by Indication 2025 & 2033
- Figure 43: Middle East and Africa Gene Therapy Market Revenue (Million), by Technology 2025 & 2033
- Figure 44: Middle East and Africa Gene Therapy Market Volume (K Unit), by Technology 2025 & 2033
- Figure 45: Middle East and Africa Gene Therapy Market Revenue Share (%), by Technology 2025 & 2033
- Figure 46: Middle East and Africa Gene Therapy Market Volume Share (%), by Technology 2025 & 2033
- Figure 47: Middle East and Africa Gene Therapy Market Revenue (Million), by Country 2025 & 2033
- Figure 48: Middle East and Africa Gene Therapy Market Volume (K Unit), by Country 2025 & 2033
- Figure 49: Middle East and Africa Gene Therapy Market Revenue Share (%), by Country 2025 & 2033
- Figure 50: Middle East and Africa Gene Therapy Market Volume Share (%), by Country 2025 & 2033
- Figure 51: South America Gene Therapy Market Revenue (Million), by Indication 2025 & 2033
- Figure 52: South America Gene Therapy Market Volume (K Unit), by Indication 2025 & 2033
- Figure 53: South America Gene Therapy Market Revenue Share (%), by Indication 2025 & 2033
- Figure 54: South America Gene Therapy Market Volume Share (%), by Indication 2025 & 2033
- Figure 55: South America Gene Therapy Market Revenue (Million), by Technology 2025 & 2033
- Figure 56: South America Gene Therapy Market Volume (K Unit), by Technology 2025 & 2033
- Figure 57: South America Gene Therapy Market Revenue Share (%), by Technology 2025 & 2033
- Figure 58: South America Gene Therapy Market Volume Share (%), by Technology 2025 & 2033
- Figure 59: South America Gene Therapy Market Revenue (Million), by Country 2025 & 2033
- Figure 60: South America Gene Therapy Market Volume (K Unit), by Country 2025 & 2033
- Figure 61: South America Gene Therapy Market Revenue Share (%), by Country 2025 & 2033
- Figure 62: South America Gene Therapy Market Volume Share (%), by Country 2025 & 2033
List of Tables
- Table 1: Global Gene Therapy Market Revenue Million Forecast, by Indication 2020 & 2033
- Table 2: Global Gene Therapy Market Volume K Unit Forecast, by Indication 2020 & 2033
- Table 3: Global Gene Therapy Market Revenue Million Forecast, by Technology 2020 & 2033
- Table 4: Global Gene Therapy Market Volume K Unit Forecast, by Technology 2020 & 2033
- Table 5: Global Gene Therapy Market Revenue Million Forecast, by Region 2020 & 2033
- Table 6: Global Gene Therapy Market Volume K Unit Forecast, by Region 2020 & 2033
- Table 7: Global Gene Therapy Market Revenue Million Forecast, by Indication 2020 & 2033
- Table 8: Global Gene Therapy Market Volume K Unit Forecast, by Indication 2020 & 2033
- Table 9: Global Gene Therapy Market Revenue Million Forecast, by Technology 2020 & 2033
- Table 10: Global Gene Therapy Market Volume K Unit Forecast, by Technology 2020 & 2033
- Table 11: Global Gene Therapy Market Revenue Million Forecast, by Country 2020 & 2033
- Table 12: Global Gene Therapy Market Volume K Unit Forecast, by Country 2020 & 2033
- Table 13: United States Gene Therapy Market Revenue (Million) Forecast, by Application 2020 & 2033
- Table 14: United States Gene Therapy Market Volume (K Unit) Forecast, by Application 2020 & 2033
- Table 15: Canada Gene Therapy Market Revenue (Million) Forecast, by Application 2020 & 2033
- Table 16: Canada Gene Therapy Market Volume (K Unit) Forecast, by Application 2020 & 2033
- Table 17: Mexico Gene Therapy Market Revenue (Million) Forecast, by Application 2020 & 2033
- Table 18: Mexico Gene Therapy Market Volume (K Unit) Forecast, by Application 2020 & 2033
- Table 19: Global Gene Therapy Market Revenue Million Forecast, by Indication 2020 & 2033
- Table 20: Global Gene Therapy Market Volume K Unit Forecast, by Indication 2020 & 2033
- Table 21: Global Gene Therapy Market Revenue Million Forecast, by Technology 2020 & 2033
- Table 22: Global Gene Therapy Market Volume K Unit Forecast, by Technology 2020 & 2033
- Table 23: Global Gene Therapy Market Revenue Million Forecast, by Country 2020 & 2033
- Table 24: Global Gene Therapy Market Volume K Unit Forecast, by Country 2020 & 2033
- Table 25: Germany Gene Therapy Market Revenue (Million) Forecast, by Application 2020 & 2033
- Table 26: Germany Gene Therapy Market Volume (K Unit) Forecast, by Application 2020 & 2033
- Table 27: United Kingdom Gene Therapy Market Revenue (Million) Forecast, by Application 2020 & 2033
- Table 28: United Kingdom Gene Therapy Market Volume (K Unit) Forecast, by Application 2020 & 2033
- Table 29: France Gene Therapy Market Revenue (Million) Forecast, by Application 2020 & 2033
- Table 30: France Gene Therapy Market Volume (K Unit) Forecast, by Application 2020 & 2033
- Table 31: Italy Gene Therapy Market Revenue (Million) Forecast, by Application 2020 & 2033
- Table 32: Italy Gene Therapy Market Volume (K Unit) Forecast, by Application 2020 & 2033
- Table 33: Spain Gene Therapy Market Revenue (Million) Forecast, by Application 2020 & 2033
- Table 34: Spain Gene Therapy Market Volume (K Unit) Forecast, by Application 2020 & 2033
- Table 35: Rest of Europe Gene Therapy Market Revenue (Million) Forecast, by Application 2020 & 2033
- Table 36: Rest of Europe Gene Therapy Market Volume (K Unit) Forecast, by Application 2020 & 2033
- Table 37: Global Gene Therapy Market Revenue Million Forecast, by Indication 2020 & 2033
- Table 38: Global Gene Therapy Market Volume K Unit Forecast, by Indication 2020 & 2033
- Table 39: Global Gene Therapy Market Revenue Million Forecast, by Technology 2020 & 2033
- Table 40: Global Gene Therapy Market Volume K Unit Forecast, by Technology 2020 & 2033
- Table 41: Global Gene Therapy Market Revenue Million Forecast, by Country 2020 & 2033
- Table 42: Global Gene Therapy Market Volume K Unit Forecast, by Country 2020 & 2033
- Table 43: China Gene Therapy Market Revenue (Million) Forecast, by Application 2020 & 2033
- Table 44: China Gene Therapy Market Volume (K Unit) Forecast, by Application 2020 & 2033
- Table 45: Japan Gene Therapy Market Revenue (Million) Forecast, by Application 2020 & 2033
- Table 46: Japan Gene Therapy Market Volume (K Unit) Forecast, by Application 2020 & 2033
- Table 47: India Gene Therapy Market Revenue (Million) Forecast, by Application 2020 & 2033
- Table 48: India Gene Therapy Market Volume (K Unit) Forecast, by Application 2020 & 2033
- Table 49: Australia Gene Therapy Market Revenue (Million) Forecast, by Application 2020 & 2033
- Table 50: Australia Gene Therapy Market Volume (K Unit) Forecast, by Application 2020 & 2033
- Table 51: South Korea Gene Therapy Market Revenue (Million) Forecast, by Application 2020 & 2033
- Table 52: South Korea Gene Therapy Market Volume (K Unit) Forecast, by Application 2020 & 2033
- Table 53: Rest of Asia Pacific Gene Therapy Market Revenue (Million) Forecast, by Application 2020 & 2033
- Table 54: Rest of Asia Pacific Gene Therapy Market Volume (K Unit) Forecast, by Application 2020 & 2033
- Table 55: Global Gene Therapy Market Revenue Million Forecast, by Indication 2020 & 2033
- Table 56: Global Gene Therapy Market Volume K Unit Forecast, by Indication 2020 & 2033
- Table 57: Global Gene Therapy Market Revenue Million Forecast, by Technology 2020 & 2033
- Table 58: Global Gene Therapy Market Volume K Unit Forecast, by Technology 2020 & 2033
- Table 59: Global Gene Therapy Market Revenue Million Forecast, by Country 2020 & 2033
- Table 60: Global Gene Therapy Market Volume K Unit Forecast, by Country 2020 & 2033
- Table 61: GCC Gene Therapy Market Revenue (Million) Forecast, by Application 2020 & 2033
- Table 62: GCC Gene Therapy Market Volume (K Unit) Forecast, by Application 2020 & 2033
- Table 63: South Africa Gene Therapy Market Revenue (Million) Forecast, by Application 2020 & 2033
- Table 64: South Africa Gene Therapy Market Volume (K Unit) Forecast, by Application 2020 & 2033
- Table 65: Rest of Middle East and Africa Gene Therapy Market Revenue (Million) Forecast, by Application 2020 & 2033
- Table 66: Rest of Middle East and Africa Gene Therapy Market Volume (K Unit) Forecast, by Application 2020 & 2033
- Table 67: Global Gene Therapy Market Revenue Million Forecast, by Indication 2020 & 2033
- Table 68: Global Gene Therapy Market Volume K Unit Forecast, by Indication 2020 & 2033
- Table 69: Global Gene Therapy Market Revenue Million Forecast, by Technology 2020 & 2033
- Table 70: Global Gene Therapy Market Volume K Unit Forecast, by Technology 2020 & 2033
- Table 71: Global Gene Therapy Market Revenue Million Forecast, by Country 2020 & 2033
- Table 72: Global Gene Therapy Market Volume K Unit Forecast, by Country 2020 & 2033
- Table 73: Brazil Gene Therapy Market Revenue (Million) Forecast, by Application 2020 & 2033
- Table 74: Brazil Gene Therapy Market Volume (K Unit) Forecast, by Application 2020 & 2033
- Table 75: Argentina Gene Therapy Market Revenue (Million) Forecast, by Application 2020 & 2033
- Table 76: Argentina Gene Therapy Market Volume (K Unit) Forecast, by Application 2020 & 2033
- Table 77: Rest of South America Gene Therapy Market Revenue (Million) Forecast, by Application 2020 & 2033
- Table 78: Rest of South America Gene Therapy Market Volume (K Unit) Forecast, by Application 2020 & 2033
Frequently Asked Questions
1. What is the projected Compound Annual Growth Rate (CAGR) of the Gene Therapy Market?
The projected CAGR is approximately 28.00%.
2. Which companies are prominent players in the Gene Therapy Market?
Key companies in the market include F Hoffmann-La Roche Ltd (Spark Therapeutics), Astellas Pharma, Gilead Sciences Inc (Kite Pharma), Voyager Therapeutics Inc , Novartis AG, Amgen Inc, UniQure NV, Generation Bio, Abeona Therapeutics Inc, Bluebird Bio Inc, Poseida Therapeutics, Biogen Inc.
3. What are the main segments of the Gene Therapy Market?
The market segments include Indication, Technology.
4. Can you provide details about the market size?
The market size is estimated to be USD 7.18 Million as of 2022.
5. What are some drivers contributing to market growth?
Rising Investments in Research and Development; Technological Advancements; Growing Prevalence of Target Diseases like Cancer.
6. What are the notable trends driving market growth?
Cancer is Expected to Hold Significant Market Share in the Indication Segment over the Forecast Period.
7. Are there any restraints impacting market growth?
Lack of Standard Regulations; High Price of Products.
8. Can you provide examples of recent developments in the market?
In October 2022, Sarepta Therapeutics applied to the US FDA to grant accelerated approval to the gene therapy S (delandistrogene moxeparvovec) for the treatment of Duchenne Muscular Dystrophy (DMD).
9. What pricing options are available for accessing the report?
Pricing options include single-user, multi-user, and enterprise licenses priced at USD 4750, USD 5250, and USD 8750 respectively.
10. Is the market size provided in terms of value or volume?
The market size is provided in terms of value, measured in Million and volume, measured in K Unit.
11. Are there any specific market keywords associated with the report?
Yes, the market keyword associated with the report is "Gene Therapy Market," which aids in identifying and referencing the specific market segment covered.
12. How do I determine which pricing option suits my needs best?
The pricing options vary based on user requirements and access needs. Individual users may opt for single-user licenses, while businesses requiring broader access may choose multi-user or enterprise licenses for cost-effective access to the report.
13. Are there any additional resources or data provided in the Gene Therapy Market report?
While the report offers comprehensive insights, it's advisable to review the specific contents or supplementary materials provided to ascertain if additional resources or data are available.
14. How can I stay updated on further developments or reports in the Gene Therapy Market?
To stay informed about further developments, trends, and reports in the Gene Therapy Market, consider subscribing to industry newsletters, following relevant companies and organizations, or regularly checking reputable industry news sources and publications.
Methodology
Step 1 - Identification of Relevant Samples Size from Population Database


Step 2 - Approaches for Defining Global Market Size (Value, Volume* & Price*)

Note*: In applicable scenarios
Step 3 - Data Sources
Primary Research
- Web Analytics
- Survey Reports
- Research Institute
- Latest Research Reports
- Opinion Leaders
Secondary Research
- Annual Reports
- White Paper
- Latest Press Release
- Industry Association
- Paid Database
- Investor Presentations

Step 4 - Data Triangulation
Involves using different sources of information in order to increase the validity of a study
These sources are likely to be stakeholders in a program - participants, other researchers, program staff, other community members, and so on.
Then we put all data in single framework & apply various statistical tools to find out the dynamic on the market.
During the analysis stage, feedback from the stakeholder groups would be compared to determine areas of agreement as well as areas of divergence